Asymmetry in Polymer Peaks - CasaXPS
Asymmetry in Polymer Peaks - CasaXPS
Asymmetry in Polymer Peaks - CasaXPS

Create successful ePaper yourself
Turn your PDF publications into a flip-book with our unique Google optimized e-Paper software.
Copyright © 2006 Casa Software Ltd. www.casaxps.com<br />
<strong>Asymmetry</strong> of <strong>Peaks</strong> <strong>in</strong> the XPS of <strong>Polymer</strong>s<br />
When a photon is absorbed by a material, the energy transferred may cause the excitation<br />
of both the electronic and atomic structure of the compounds on the surface. Thus, an<br />
electron ejected from the surface follow<strong>in</strong>g the absorption of a photon of a given energy,<br />
appears with k<strong>in</strong>etic energy dependent on more than simply the <strong>in</strong>itial core level state of<br />
the electron. A proportion of the photon energy may contribute to atomic oscillations<br />
associated with the bonds with<strong>in</strong> a molecule and is not available to the photoelectron as<br />
k<strong>in</strong>etic energy. The consequence of these alternative energy transfer mechanisms is that<br />
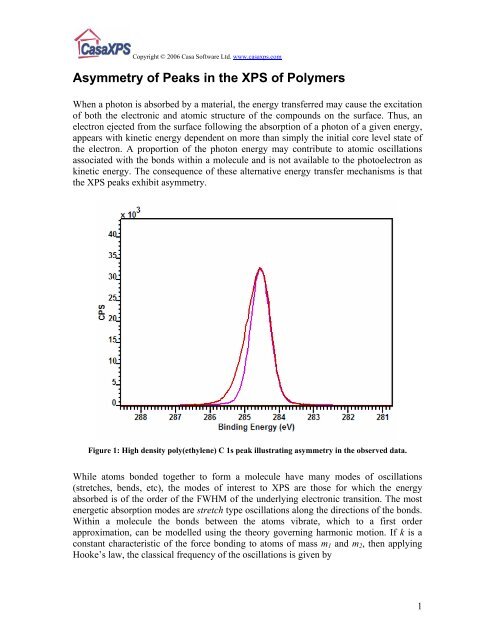
the XPS peaks exhibit asymmetry.<br />
Figure 1: High density poly(ethylene) C 1s peak illustrat<strong>in</strong>g asymmetry <strong>in</strong> the observed data.<br />
While atoms bonded together to form a molecule have many modes of oscillations<br />
(stretches, bends, etc), the modes of <strong>in</strong>terest to XPS are those for which the energy<br />
absorbed is of the order of the FWHM of the underly<strong>in</strong>g electronic transition. The most<br />
energetic absorption modes are stretch type oscillations along the directions of the bonds.<br />
With<strong>in</strong> a molecule the bonds between the atoms vibrate, which to a first order<br />
approximation, can be modelled us<strong>in</strong>g the theory govern<strong>in</strong>g harmonic motion. If k is a<br />
constant characteristic of the force bond<strong>in</strong>g to atoms of mass m 1 and m 2 , then apply<strong>in</strong>g<br />
Hooke’s law, the classical frequency of the oscillations is given by<br />
1
Copyright © 2006 Casa Software Ltd. www.casaxps.com<br />
1 k 1 k<br />
υ = = .<br />
2π<br />
m1m2<br />
2π<br />
m<br />
m + m<br />
1<br />
2<br />
The story is however <strong>in</strong>complete without <strong>in</strong>troduc<strong>in</strong>g a quantum mechanically description<br />
of the atomic oscillations. The Schröd<strong>in</strong>ger equation for a particle of reduced mass m<br />
perform<strong>in</strong>g harmonic motion is:<br />
2<br />
d ψ 2m<br />
⎛ 1 2 ⎞<br />
+ = 0<br />
2 2<br />
⎜ E − kx ⎟ψ<br />
.<br />
dx h ⎝ 2 ⎠<br />
The solutions of the Schröd<strong>in</strong>ger equation require the energy of the oscillations to be<br />
quantized:<br />
⎛ 1 ⎞<br />
E n<br />
= ⎜n<br />
+ ⎟hυ<br />
for n = 0, 1, 2, … .<br />
⎝ 2 ⎠<br />
Thus, so far as the potential energy between two atoms can be described by the harmonic<br />
oscillatory potential of ½kx 2 , the atoms with<strong>in</strong> a bond may vibrate with energies which<br />
are equally spaced. Therefore, energy loss events associated with the ejection of an<br />
electron by the absorption of a photon result <strong>in</strong> a sequence of XPS peaks offset <strong>in</strong> energy<br />
by the allowed vibrational energy levels <strong>in</strong> the atomic bonds.<br />
Infrared spectroscopy is based on the absorption of photons by molecular bonds with<br />
frequencies from the <strong>in</strong>frared region of the electromagnetic spectrum. Absorption peaks<br />
occur at frequencies correspond<strong>in</strong>g to the quantized vibrational energy level of these<br />
bonds; therefore IR spectra provide a measure of the expected peak separations<br />
contribut<strong>in</strong>g to the asymmetry <strong>in</strong> the XPS C 1s data. The IR spectra from even the<br />
simplest materials are complicated by the numerous vibrational modes, so any<br />
assumption that the observed XPS spectra are a simple sequence of symmetric peaks is<br />
only an approximation to the reality of the processes responsible for the XPS data.<br />
Nevertheless, an idea of the energies <strong>in</strong>volved <strong>in</strong> the vibrational splitt<strong>in</strong>g of a XPS peak<br />
can be estimated.<br />
The peaks <strong>in</strong> IR spectra are typically plotted us<strong>in</strong>g wave number <strong>in</strong> units of cm -1 . The<br />
energy <strong>in</strong> eV can be computed from the wave number, which is the reciprocal of the<br />
wave length λ is given by (h is Planks constant and c is the speed of light) :<br />
18 -1<br />
−1<br />
⎛ 1 ⎞ −1<br />
-4 ⎛ 1 ⎞<br />
E ( eV ) = 6.242×<br />
10 (eVJ ) h(<br />
Js)<br />
c(<br />
ms ) ⎜ ⎟(<br />
cm )100 = 1.239841×<br />
10 ⎜ ⎟<br />
⎝ λ ⎠<br />
⎝ λ ⎠<br />
The wave number for a C-H bond absorption peak is typically 3100cm -1 , therefore the<br />
energy is 0.384 eV. As a result, the energy transitions <strong>in</strong> the stretch vibrational states of<br />
C-H molecular bond <strong>in</strong> high density poly(ethylene) are <strong>in</strong> the region of 0.384 eV and<br />
therefore small compared to the b<strong>in</strong>d<strong>in</strong>g energy of a 1s electron <strong>in</strong> a carbon atom, but are<br />
significant compared to the FWHM of the C 1s peak measured us<strong>in</strong>g high resolution XPS<br />
(~ 1 eV). These shifted C 1s peaks account for the asymmetry apparent <strong>in</strong> the data<br />
envelope for HDPE <strong>in</strong> Figure 1.<br />
2
Copyright © 2006 Casa Software Ltd. www.casaxps.com<br />
When construct<strong>in</strong>g a peak model for vibrational states <strong>in</strong> XPS data there are at least two<br />
strategies for fitt<strong>in</strong>g peaks to the asymmetric data:<br />
1. Introduce a set of symmetric Gaussian-Lorentzian peaks where the position<br />
constra<strong>in</strong>t for each of the peak-set are def<strong>in</strong>ed <strong>in</strong> terms of equally spaced offsets<br />
from the pr<strong>in</strong>cipal peak. Typically the FWHM constra<strong>in</strong>s can be established so<br />
that each of the peaks represent<strong>in</strong>g the vibrational states are of identical width.<br />
2. Construct a l<strong>in</strong>e-shape us<strong>in</strong>g the VS(E,A1,A2,A3,A4)GL(n) or<br />
VS(E,A1,A2,A3)GL(n) str<strong>in</strong>gs. The result<strong>in</strong>g l<strong>in</strong>e-shape is a sequence of<br />
Gaussian-Lorentzian peaks separated by the value of the E parameter, where the<br />
amplitude of each peak is def<strong>in</strong>ed relative to the first peak and specified us<strong>in</strong>g the<br />
parameters A1, A2, A3 and A4. The advantage of modell<strong>in</strong>g the data us<strong>in</strong>g the<br />
VS(,,,)GL() or VS(,,,)SGL() l<strong>in</strong>e-shapes over other asymmetric l<strong>in</strong>e-shapes is that<br />
the result<strong>in</strong>g profiles are asymmetric <strong>in</strong> a physically understandable way and also<br />
have the localised nature of the SGL/GL profiles.<br />
Figure 2 is an example of the VS()SGL() l<strong>in</strong>e-shape where the separation of the peaks are<br />
large compared to the FWHM of the underly<strong>in</strong>g SGL def<strong>in</strong>ition. The same sequence of<br />
peaks used to construct a more appropriate l<strong>in</strong>e-shape for the C 1s peak is illustrated <strong>in</strong><br />
Figure 3, where the step size between the peaks <strong>in</strong> the VS model is 0.633.<br />
Figure 2: VS()SGL() l<strong>in</strong>e-shape where the energy step is too large for the FWHM. The essential<br />
structure of the VS peaks can be seen clearly.<br />
3
Copyright © 2006 Casa Software Ltd. www.casaxps.com<br />
Figure 3: Correctly adjusted energy offset parameter <strong>in</strong> the VS()SGL() l<strong>in</strong>e-shape appropriate for<br />
the data.<br />
The relative height of the component peaks <strong>in</strong> the VS l<strong>in</strong>e-shape can be deduced by an<br />
analysis on the data us<strong>in</strong>g strategy 1 above. That is, the C 1s peak <strong>in</strong> Figure 1 can be<br />
fitted us<strong>in</strong>g constra<strong>in</strong>ed peaks as shown <strong>in</strong> Figure 4. The position and FWHM constra<strong>in</strong>ts<br />
were established before fitt<strong>in</strong>g to the C 1s data, while the area constra<strong>in</strong>ts were set follow<br />
fitt<strong>in</strong>g as a means to illustrate the relative areas of the constituent peaks. S<strong>in</strong>ce the<br />
FWHM are all the same, the relative amplitudes of the peaks are also <strong>in</strong> the same<br />
proportion. These amplitude ratios were used to determ<strong>in</strong>e the parameters for the<br />
VS()SGL() l<strong>in</strong>e-shape. Note, the offset is not directly transferable from strategy 1 to<br />
strategy 2. This is because the l<strong>in</strong>e-shape is constructed us<strong>in</strong>g peaks of unit FWHM rather<br />
than physically mean<strong>in</strong>gful parameters and the result<strong>in</strong>g l<strong>in</strong>e-shape is mapped onto the<br />
data <strong>in</strong> units of the physically mean<strong>in</strong>gful FWHM. That is to say, the E parameter is<br />
scaled by the FWHM of the fitted l<strong>in</strong>e-shape.<br />
The environment of an electron ejected from a core level of carbon <strong>in</strong> a C=O bond may<br />
differ from a similar core level from a C-H bond, therefore the separation of the<br />
vibrational states change and as a result the degree of asymmetry <strong>in</strong> an XPS peak may<br />
also change. Figure 5 is an example of a fit to PMMA <strong>in</strong> which vary<strong>in</strong>g degrees of<br />
asymmetry are used to model the data. Aga<strong>in</strong>, the significance of the energy offset used<br />
<strong>in</strong> the VS l<strong>in</strong>e-shape is limited to the objective of obta<strong>in</strong><strong>in</strong>g a fit to the data. It is the<br />
ability of the VS l<strong>in</strong>e-shape to recreate the types of shapes observed <strong>in</strong> the data that is<br />
important rather than attempt<strong>in</strong>g to construct the exact structure underly<strong>in</strong>g the electronic<br />
plus vibrational states.<br />
4
Copyright © 2006 Casa Software Ltd. www.casaxps.com<br />
Figure 4: Constra<strong>in</strong>ed peaks model<strong>in</strong>g the asymmetry <strong>in</strong> the HDPE C 1s spectrum.<br />
Figure 5: Poly(methyl methacrylate) PMMA fitted us<strong>in</strong>g a variety of VS()SGL() parameters.<br />
5