Component Display Options - CasaXPS
Component Display Options - CasaXPS
Component Display Options - CasaXPS

You also want an ePaper? Increase the reach of your titles
YUMPU automatically turns print PDFs into web optimized ePapers that Google loves.
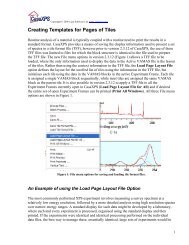
Copyright © 2007 Casa Software Ltd. www.casaxps.com<br />
Synthetic <strong>Component</strong>s<br />
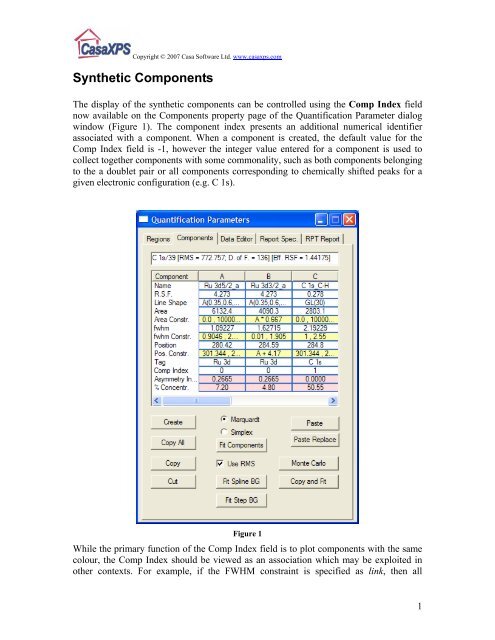
The display of the synthetic components can be controlled using the Comp Index field<br />
now available on the <strong>Component</strong>s property page of the Quantification Parameter dialog<br />
window (Figure 1). The component index presents an additional numerical identifier<br />
associated with a component. When a component is created, the default value for the<br />
Comp Index field is -1, however the integer value entered for a component is used to<br />
collect together components with some commonality, such as both components belonging<br />
to the a doublet pair or all components corresponding to chemically shifted peaks for a<br />
given electronic configuration (e.g. C 1s).<br />
Figure 1<br />
While the primary function of the Comp Index field is to plot components with the same<br />
colour, the Comp Index should be viewed as an association which may be exploited in<br />
other contexts. For example, if the FWHM constraint is specified as link, then all<br />
1
Copyright © 2007 Casa Software Ltd. www.casaxps.com<br />
components with the same Comp Index will have their FWHM constraint adjusted to<br />
ensure all components with the same Comp Index have the same FWHM as the<br />
component for which the key word link was entered.<br />
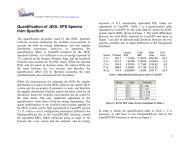
<strong>Component</strong>s are plotted using the Custom palette of colours viewed using the Colour<br />
dialog window available from the Colour property page of the Tile <strong>Display</strong> Parameters<br />
dialog window. The Custom palette consists of sixteen colours, each of which are user<br />
definable, and are referenced via the Comp Index field using the indices 0 to 15. When<br />
the use of the Comp Index is enabled, the default value for the Comp Index, namely -1,<br />
causes the components to be plotted using the colour with index 15. All other indices<br />
between 0 and 15 will select the colours from the Custom Palette from left to right and<br />
then top to bottom, as seen on the Colour dialog window (Figure 2).<br />
Figure 2<br />
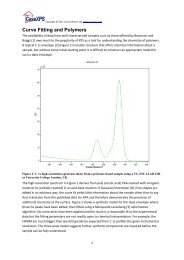
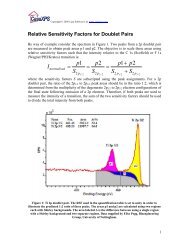
The set of components displayed in Figure 3 correspond to the Custom palette in Figure<br />
2. While each component is identifiable using the annotation component table colour<br />
coded for each of the components using the custom colours, it is sometimes more<br />
convenient to group together peaks to simplify the plot. For the data in Figure 3, the data<br />
envelope is attributed to four C 1s peaks and two chemically shifted doublet pair from the<br />
Ru 3d transition. Grouping peaks according to the nature of the transitions simplifies the<br />
display as seen in Figure 4.<br />
2
Copyright © 2007 Casa Software Ltd. www.casaxps.com<br />
Figure 3<br />
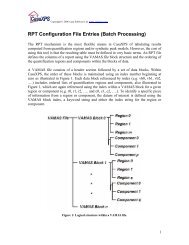
Figure 4<br />
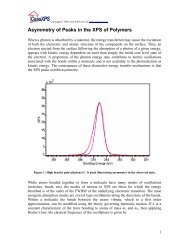
The mechanism for grouping component colours via the Comp Index is enabled using the<br />
tick boxes on the Colour property page of the Tile <strong>Display</strong> Parameter dialog window.<br />
Figure 5 shows the appropriate tick box in the state suitable for the display in Figure 4.<br />
The components in Figure 4 are arranged so that the doublet pair Ru 3d 5/2_a and Ru 3d<br />
3/2_a both have an index of 0, while the four C 1s components are assigned an index of 1<br />
and the final pair of Ru 3d transitions Ru 3d 5/2_b and Ru 3d 3/2_b have an index of 2.<br />
3
Copyright © 2007 Casa Software Ltd. www.casaxps.com<br />
Figure 5<br />
The reduction in colours used to illustrate the peak model simplify the display in Figure 4<br />
compared to Figure 3; nevertheless a further simplification can be achieved by combining<br />
the intensities from peaks with the same Comp Index number. Rather than displaying the<br />
individual peaks, Figure 6 displays the intensity collected into curves for each of Comp<br />
Index values assigned to the components. For the data in Figure 6, each of the doublet<br />
pairs are assigned distinct indices; also, the set of C 1s peaks are differentiated from the<br />
Ru 3d peaks by a unique Comp Index value. As a result, three curves corresponding to<br />
the three different Comp Indices appear on the display. Collecting the components with<br />
common Comp Index values is achieved by ticking the Combine Comp Index tick box.<br />
4
Copyright © 2007 Casa Software Ltd. www.casaxps.com<br />
Figure 6<br />
One further use of the Comp Index is to fill the components with the assigned colour as<br />
illustrated in Figure 7. The plot in Figure 7 uses distinct Comp Index values for each<br />
component to highlight the connection between the O 1s peak in the inset tile with the Si<br />
2p oxide peak in the silicon data. The tick box Fill Combined <strong>Component</strong>s is used to<br />
achieve the effect in Figure 7; the subtlety lies in the use of the Combine Comp Index<br />
tick box while using distinct Comp Indices to achieve the block fill of the individual<br />
components. The intended use of the Combine Comp Index is to provide an extension to<br />
the display of combined peaks such as those in Figure 6 using a block fill applied to the<br />
collective curve; however using the fill option with components each of which are assign<br />
unique Comp Indices provides a means of filling individual components.<br />
5
Copyright © 2007 Casa Software Ltd. www.casaxps.com<br />
Figure 7<br />
6