Component Display Options - CasaXPS
Component Display Options - CasaXPS
Component Display Options - CasaXPS

You also want an ePaper? Increase the reach of your titles
YUMPU automatically turns print PDFs into web optimized ePapers that Google loves.
Copyright © 2007 Casa Software Ltd. www.casaxps.com<br />
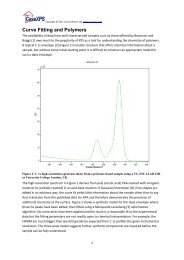
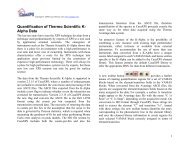
Figure 5<br />
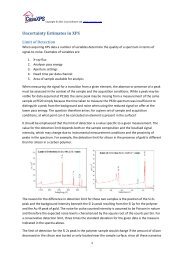
The reduction in colours used to illustrate the peak model simplify the display in Figure 4<br />
compared to Figure 3; nevertheless a further simplification can be achieved by combining<br />
the intensities from peaks with the same Comp Index number. Rather than displaying the<br />
individual peaks, Figure 6 displays the intensity collected into curves for each of Comp<br />
Index values assigned to the components. For the data in Figure 6, each of the doublet<br />
pairs are assigned distinct indices; also, the set of C 1s peaks are differentiated from the<br />
Ru 3d peaks by a unique Comp Index value. As a result, three curves corresponding to<br />
the three different Comp Indices appear on the display. Collecting the components with<br />
common Comp Index values is achieved by ticking the Combine Comp Index tick box.<br />
4