Scott County Substance Use Epidemiological Profile 2008 - Iowa ...
Scott County Substance Use Epidemiological Profile 2008 - Iowa ...
Scott County Substance Use Epidemiological Profile 2008 - Iowa ...

You also want an ePaper? Increase the reach of your titles
YUMPU automatically turns print PDFs into web optimized ePapers that Google loves.
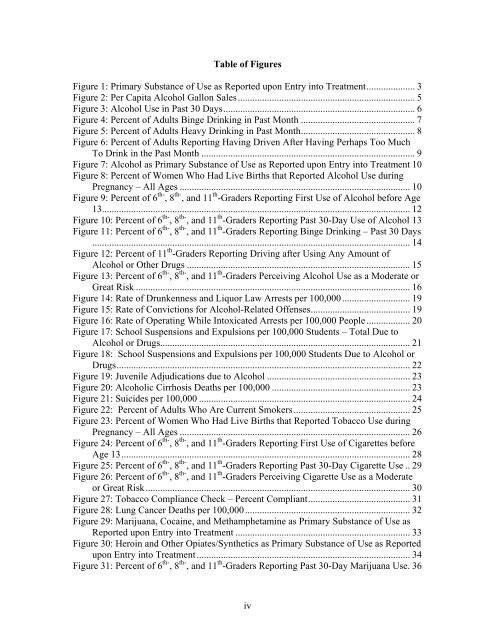
Table of Figures<br />
Figure 1: Primary <strong>Substance</strong> of <strong>Use</strong> as Reported upon Entry into Treatment.................... 3<br />
Figure 2: Per Capita Alcohol Gallon Sales......................................................................... 5<br />
Figure 3: Alcohol <strong>Use</strong> in Past 30 Days............................................................................... 6<br />
Figure 4: Percent of Adults Binge Drinking in Past Month ............................................... 7<br />
Figure 5: Percent of Adults Heavy Drinking in Past Month............................................... 8<br />
Figure 6: Percent of Adults Reporting Having Driven After Having Perhaps Too Much<br />
To Drink in the Past Month ........................................................................................ 9<br />
Figure 7: Alcohol as Primary <strong>Substance</strong> of <strong>Use</strong> as Reported upon Entry into Treatment 10<br />
Figure 8: Percent of Women Who Had Live Births that Reported Alcohol <strong>Use</strong> during<br />
Pregnancy – All Ages ............................................................................................... 10<br />
Figure 9: Percent of 6 th- , 8 th- , and 11 th -Graders Reporting First <strong>Use</strong> of Alcohol before Age<br />
13............................................................................................................................... 12<br />
Figure 10: Percent of 6 th- , 8 th- , and 11 th -Graders Reporting Past 30-Day <strong>Use</strong> of Alcohol 13<br />
Figure 11: Percent of 6 th- , 8 th- , and 11 th -Graders Reporting Binge Drinking – Past 30 Days<br />
................................................................................................................................... 14<br />
Figure 12: Percent of 11 th -Graders Reporting Driving after Using Any Amount of<br />
Alcohol or Other Drugs ............................................................................................ 15<br />
Figure 13: Percent of 6 th- , 8 th- , and 11 th -Graders Perceiving Alcohol <strong>Use</strong> as a Moderate or<br />
Great Risk ................................................................................................................. 16<br />
Figure 14: Rate of Drunkenness and Liquor Law Arrests per 100,000............................ 19<br />
Figure 15: Rate of Convictions for Alcohol-Related Offenses......................................... 19<br />
Figure 16: Rate of Operating While Intoxicated Arrests per 100,000 People.................. 20<br />
Figure 17: School Suspensions and Expulsions per 100,000 Students – Total Due to<br />
Alcohol or Drugs....................................................................................................... 21<br />
Figure 18: School Suspensions and Expulsions per 100,000 Students Due to Alcohol or<br />
Drugs......................................................................................................................... 22<br />
Figure 19: Juvenile Adjudications due to Alcohol ........................................................... 23<br />
Figure 20: Alcoholic Cirrhosis Deaths per 100,000 ......................................................... 23<br />
Figure 21: Suicides per 100,000 ....................................................................................... 24<br />
Figure 22: Percent of Adults Who Are Current Smokers................................................ 25<br />
Figure 23: Percent of Women Who Had Live Births that Reported Tobacco <strong>Use</strong> during<br />
Pregnancy – All Ages ............................................................................................... 26<br />
Figure 24: Percent of 6 th- , 8 th- , and 11 th -Graders Reporting First <strong>Use</strong> of Cigarettes before<br />
Age 13....................................................................................................................... 28<br />
Figure 25: Percent of 6 th- , 8 th- , and 11 th -Graders Reporting Past 30-Day Cigarette <strong>Use</strong> .. 29<br />
Figure 26: Percent of 6 th- , 8 th- , and 11 th -Graders Perceiving Cigarette <strong>Use</strong> as a Moderate<br />
or Great Risk............................................................................................................. 30<br />
Figure 27: Tobacco Compliance Check – Percent Compliant.......................................... 31<br />
Figure 28: Lung Cancer Deaths per 100,000.................................................................... 32<br />
Figure 29: Marijuana, Cocaine, and Methamphetamine as Primary <strong>Substance</strong> of <strong>Use</strong> as<br />
Reported upon Entry into Treatment ........................................................................ 33<br />
Figure 30: Heroin and Other Opiates/Synthetics as Primary <strong>Substance</strong> of <strong>Use</strong> as Reported<br />
upon Entry into Treatment........................................................................................ 34<br />
Figure 31: Percent of 6 th- , 8 th- , and 11 th -Graders Reporting Past 30-Day Marijuana <strong>Use</strong>. 36<br />
iv