Modelling the Socio-Economic Impact of HIV/AIDS in South Africa
Modelling the Socio-Economic Impact of HIV/AIDS in South Africa
Modelling the Socio-Economic Impact of HIV/AIDS in South Africa

You also want an ePaper? Increase the reach of your titles
YUMPU automatically turns print PDFs into web optimized ePapers that Google loves.
3 First Results<br />
In this paper, we solely present prelim<strong>in</strong>ary results from <strong>the</strong> prototype model. After <strong>the</strong> <strong>in</strong>itial<br />
simulation runs used to verify <strong>the</strong> model implementation, we started to explore different scenarios.<br />
One such scenario <strong>in</strong>vestigates <strong>the</strong> effects <strong>of</strong> grants on <strong>the</strong> households. Receiv<strong>in</strong>g a grant affects <strong>the</strong><br />
survival <strong>of</strong> <strong>the</strong> household significantly. Without farm<strong>in</strong>g, where grants and remittances rema<strong>in</strong> <strong>the</strong><br />
only source <strong>of</strong> <strong>in</strong>come, any fur<strong>the</strong>r grant helps <strong>the</strong> households cope with expenses for subsistence,<br />
health care and funerals for a much longer time.<br />
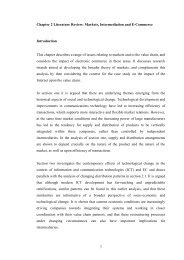
Figure 1 shows <strong>the</strong> results <strong>of</strong> a simulation run (900 months), where children are only eligible for<br />
a grant if <strong>the</strong>y are orphans suffer<strong>in</strong>g from <strong>HIV</strong>/<strong>AIDS</strong>. With 100 <strong>in</strong>itial households and <strong>the</strong> probability<br />
<strong>of</strong> obta<strong>in</strong><strong>in</strong>g work outside <strong>the</strong> village set to 40%, <strong>the</strong> social networks <strong>of</strong> <strong>the</strong> households (top left corner<br />
<strong>of</strong> figure 1) show a high dissolution rate <strong>of</strong> <strong>in</strong>itial households (green), with a significantly high number<br />
<strong>of</strong> accommodat<strong>in</strong>g households (blue). Membership <strong>in</strong> funeral clubs <strong>in</strong>creases rapidly, as shown <strong>in</strong> <strong>the</strong><br />
top right <strong>of</strong> figure 1, due to households experienc<strong>in</strong>g an <strong>in</strong>crease <strong>in</strong> <strong>the</strong> deaths <strong>of</strong> family members<br />
(bottom right chart), f<strong>in</strong>ally lead<strong>in</strong>g to dissolution <strong>of</strong> households (bottom left chart).<br />
Figure 1: <strong>Impact</strong> on <strong>the</strong> households’ structure with no child grant and restricted orphan grant.<br />
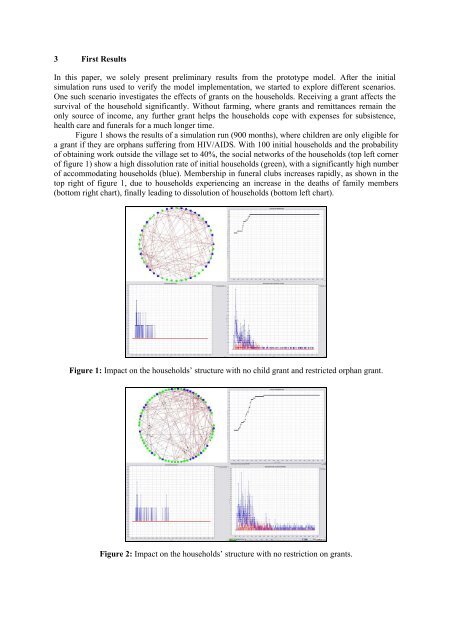
Figure 2: <strong>Impact</strong> on <strong>the</strong> households’ structure with no restriction on grants.