1 Agent-Based Modelling Incorporating Qualitative and Quantitative ...
1 Agent-Based Modelling Incorporating Qualitative and Quantitative ...
1 Agent-Based Modelling Incorporating Qualitative and Quantitative ...

You also want an ePaper? Increase the reach of your titles
YUMPU automatically turns print PDFs into web optimized ePapers that Google loves.
<strong>Agent</strong>-<strong>Based</strong> <strong>Modelling</strong> <strong>Incorporating</strong> <strong>Qualitative</strong> <strong>and</strong> <strong>Quantitative</strong> Methods: A Case Study<br />
Investigating the Impact of E-commerce upon the Value Chain.<br />
Richard Taylor<br />
Centre for Policy <strong>Modelling</strong><br />
Manchester Metropolitan University<br />
Manchester M1 3GH, U.K.<br />
E-mail: r.i.taylor@mmu.ac.uk<br />
Abstract<br />
This paper investigates the question of how new e-commerce technology is changing the organisational structure of<br />
value chains. The research presented in this paper illustrates a new methodology that unites qualitative <strong>and</strong> quantitative<br />
approaches, by undertaking a detailed case study within a major international organisation. The focus is upon exploring<br />
those issues identified as interesting <strong>and</strong> important by a small stakeholder group working in the company <strong>and</strong> actively<br />
participating in the research.<br />
The qualitative investigation involves an interpretive study of interview data collected during a fieldwork phase. The<br />
context of the case study is a business transformation programme to develop Internet-based e-commerce that is designed<br />
to link customers to an electronic mall, thereby improving information flow, customer service, <strong>and</strong> internal efficiency.<br />
The qualitative research aims to capture the attitudes, perceptions <strong>and</strong> behavioural patterns observed in customers <strong>and</strong><br />
other trading partners. The quantitative approach is embodied in an agent-based simulation model, which produces<br />
numerical outputs that are compared with statistical data gathered during the fieldwork. The objective is to develop an<br />
explanatory model that can be used to improve stakeholders' underst<strong>and</strong>ings of the workings of the value chain.<br />
Simulation experiments are carried out to investigate a number of projected system scenarios, <strong>and</strong> to test hypotheses<br />
about the impact of e-commerce drawn from the literature <strong>and</strong> from the findings of other e-commerce case studies. The<br />
main findings of this research relate to the anticipated role of intermediaries in the value chain, <strong>and</strong> to the identification<br />
of key drivers <strong>and</strong> inhibitors to customer take-up of e-commerce. The paper argues that a multi-methodology approach<br />
is appropriate to simulation-based projects. It identifies stakeholder participation as being particularly useful because it<br />
enables strong validation procedures to be carried out.<br />
1
1. Background<br />
The value chain model describes how the different stages of business operations are organised,<br />
including all processes involved in designing, manufacturing, <strong>and</strong> distributing products from the<br />
initial blueprints to the final delivery to the end user. Each step in the chain adds value to the<br />
overall operation. Traditionally, the value chain perspective views a company as a chain of<br />
activities. Porter (1985) distinguishes between value chains, describing activities internal to one<br />
company, <strong>and</strong> value systems, describing several organisations, each carrying out different processes<br />
<strong>and</strong> linking them with its trading partners. However, many researchers also use the former to<br />
discuss chains involving interorganisational processes. It is widely accepted that extensive value<br />
chains often suffer from problems with information flow - some of the links are not as good as<br />
others in providing necessary information – <strong>and</strong> it is proposed that development of new information<br />
<strong>and</strong> communications technology (ICT), has the potential to improve the networking aspects of the<br />
value chain. This includes design, procurement, distribution, marketing, inventory <strong>and</strong> customer<br />
relationship management, for example.<br />
We propose that value chains <strong>and</strong> interorganisational systems (IOS) are an appropriate area for the<br />
application of ABSS techniques, <strong>and</strong> that models developed will be able to improve our<br />
underst<strong>and</strong>ings of value chain issues. The systems we are exploring involve many heterogeneous<br />
actors, have dense interactions amongst them, <strong>and</strong> are structured with decentralised communication<br />
processes – exactly the type of systems typically developed by researchers in this field. Examples of<br />
previous work carried out to model aspects of the value chain, which include the closely related<br />
issues of supply, distribution, <strong>and</strong> intermediation, are (Parunak <strong>and</strong> V<strong>and</strong>erbok 1998; Moss,<br />
Edmonds et al. 2000; Fioretti 2001). The work presented in this paper similarly models the value<br />
chain <strong>and</strong> also considers the impact of new ICT by virtue of being closely tied to an investigative<br />
case study. A combination of qualitative <strong>and</strong> quantitative methods is used in parallel with the<br />
modelling exercise. The line of reasoning taken in this project is that relying on quantitative data<br />
collection alone could be limiting in terms of underst<strong>and</strong>ing the attitudes <strong>and</strong> behaviours of social<br />
actors, <strong>and</strong> that qualitative techniques producing primary data much richer in context could be more<br />
insightful in this regard.<br />
2
Broadening our literature survey to consider the impact of technology upon markets, our first<br />
objective is to put the impact of e-commerce into its historical context <strong>and</strong> identify parallels in the<br />
history of technological change. The tendency, perhaps, of many commentators is to overemphasise<br />
the importance of electronic commerce (EC) while it is still in its infancy, <strong>and</strong> to miss the fact that<br />
its value comes from how well it can be integrated with existing business systems <strong>and</strong> processes,<br />
<strong>and</strong> with those of partner organisations. The risk has been amply demonstrated by the<br />
underperformance of many new electronic marketplaces, the failure of many dot-com companies,<br />
<strong>and</strong> highly speculative investment behaviour. Recent work (Timmers 1999; Turban, Lee et al. 1999;<br />
Berryman, Harrington et al. 2000) has highlighted the new opportunities presented by Internetbased<br />
e-commerce, the strategic <strong>and</strong> operational benefits, implications for intermediaries, <strong>and</strong> the<br />
new organisational forms <strong>and</strong> market systems that are developing to take advantage of them. The<br />
research presented in this paper aims to take business history as a starting point for underst<strong>and</strong>ing<br />
changes brought about by the introduction of e-commerce technology.<br />
Business historians Ch<strong>and</strong>ler (1977) <strong>and</strong> Porter <strong>and</strong> Livesay (1971) carried out a study of the US<br />
economy for the years 1830-1900 which described how the economic growth that was fuelled by<br />
the development of railway <strong>and</strong> telegraph systems led to a pattern of manufacturer domination over<br />
product distribution <strong>and</strong> marketing arrangements. Among the new distribution systems developed<br />
were company-owned sales offices <strong>and</strong> travelling salesmen. The role of the independent<br />
intermediary was diminished, as large hierarchical organisations were favoured over market<br />
systems to carry out the distribution function. Central to the argument of Porter & Livesay was that<br />
new technology, <strong>and</strong> its impact upon products <strong>and</strong> markets, was a key driver in the development of<br />
new distribution channels <strong>and</strong> marketing strategies, <strong>and</strong> shifts in power relations amongst trading<br />
partners that control <strong>and</strong> operate within them.<br />
Of particular interest recently has been the identification of industries that might be at risk from the<br />
development of e-commerce technology. Researchers have focussed upon financial markets (Bakos<br />
2000) tourism <strong>and</strong> leisure (Chircu <strong>and</strong> Kauffman 2000), (McCubbrey 1999), or car dealerships<br />
(Watson <strong>and</strong> McKeown 1999; Marshall, Sor et al. 2000) as markets potentially subject to upheaval.<br />
3
Those most anticipated as at risk are intermediaries involved in the information processing<br />
requirements of other customers <strong>and</strong> suppliers, where those functions are open to potential<br />
improvements. Other researchers posit competition from Internet-only companies, the so called<br />
‘dot-coms’ or ‘cybermediaries’ e.g. (Jin <strong>and</strong> Robey 1999). In the early stages of development of the<br />
Internet, EDI <strong>and</strong> other electronic networking technologies, researchers argued that we would see<br />
much disintermediation (Malone, Yates et al. 1987) (Tapscott 1996) i.e. traditional intermediaries<br />
would be bypassed in the process of reshaping certain industrial sectors. More recent research has<br />
questioned whether this disintermediaton process is as universal as first suggested. For example, we<br />
consider the more sophisticated model of Chircu <strong>and</strong> Kauffman (2000) who introduce the concept<br />
of the intermediation / disintermediation / reintermediation (IDR) framework which they argue<br />
applies to the introduction of new IT innovations that cause structural adjustments. The idea is that<br />
changing market conditions also bring new opportunities for intermediation to which the threatened<br />
intermediary should adapt, or reintermediate:<br />
“A disenfranchised traditional player is able to compete again by leveraging technological<br />
innovations with cospecialized assets.” (Chircu <strong>and</strong> Kauffman 2000)<br />
The historical perspective has concentrated on, firstly, the conflict between competition <strong>and</strong><br />
cooperation in markets, <strong>and</strong> secondly the question of how to balance between markets <strong>and</strong><br />
hierarchies as alternative ways to organise production <strong>and</strong> distribution. Markets have the advantage<br />
of flexibility in that components which become unproductive or unnecessary can be easily changed<br />
for better options. However, market mechanisms do not usually produce good information flow.<br />
Integration via hierarchies has the advantage of improving coordination <strong>and</strong> control between the<br />
component parts, <strong>and</strong> doing so at a lower cost. This perspective suggests that there is a tendency<br />
towards market systems when the nature of the product is generic, <strong>and</strong> the market is diffuse. This<br />
describes the situation in the case study (assuming that products can be sold ‘off the shelf’). We<br />
hypothesise therefore, that in the supply chain we examine, market intermediation will remain a<br />
very important function.<br />
4
However, in the context of new ICT, research (Fabris 1997; 2001) emphasises the importance of<br />
collaboration over competition amongst members of the value network. This perspective is justified<br />
by the increasing interdependence amongst companies, <strong>and</strong> the growing sales in extranet <strong>and</strong> other<br />
interorganisational networking technology. Academics are increasingly turning their attention to<br />
trade networks as the unit of analysis of their research, as alternative to the more traditional view of<br />
individual companies as essentially unitary elements. These two points taken together imply that it<br />
might be less useful for researchers to consider the dichotomy between markets <strong>and</strong> hierarchies <strong>and</strong><br />
between competition <strong>and</strong> cooperation as the focus of a study of e-commerce. An alternative<br />
viewpoint (Rayport <strong>and</strong> Sviokla 1996; Swaminathan, Smith et al. 1998) proposes that organisations<br />
are increasingly organising into ‘virtual value chains’ for the duration of individual projects,<br />
providing both flexibility <strong>and</strong> high levels coordination within trade networks. The reason there is a<br />
less clear distinction between electronic markets <strong>and</strong> hierarchies is that better information is<br />
available through market mechanisms augmented by networking technology. This allows<br />
companies to collaborate better by coordinating those activities undertaken jointly. Benjamin <strong>and</strong><br />
Wig<strong>and</strong> argue that:<br />
“It is becoming increasingly difficult to delineate accurately the borders of today’s organizations.<br />
Driven by IT’s ability to produce ever cheaper unit costs for coordination, organizations are<br />
implementing, increasingly rapidly, new links for relating to each other…the new forms indicate an<br />
ongoing transformation of value chains due to technological change.” (Benjamin <strong>and</strong> Wig<strong>and</strong><br />
1995)<br />
The focus of this paper is on the role of the intermediary <strong>and</strong> the development of a potential new<br />
marketing <strong>and</strong> distribution arrangement, namely direct sales via the Internet channel. We use the<br />
methods of case study research with stakeholder participation in conjunction with agent-based<br />
modelling (described in part 3) but first provide more details about the case study (part 2). The<br />
subject of the next section is how the case study lets us address these themes of the research<br />
(exploring the impact of e-commerce on the supply chain, the historical perspective of change) <strong>and</strong><br />
lets us test our methodological approach (integrating qualitative <strong>and</strong> quantitative approaches to<br />
agent-based modelling research).<br />
5
2. The Case Study<br />
Several reasons justified our decision to carry out a case study. Firstly, it would supply us with real<br />
problems <strong>and</strong> issues to address in e-commerce <strong>and</strong> with which to test our approach. Secondly, it<br />
would provide us with a good supply of qualitative <strong>and</strong> quantitative data with which to inform, <strong>and</strong><br />
give an empirical basis to, our model. Thirdly, it would enable us to enlist the input of a<br />
‘stakeholder’ group to evaluate the model <strong>and</strong> the simulation results. We define the stakeholder as<br />
the person or persons who play an interactive role in the social system under study, <strong>and</strong> have expert<br />
knowledge about how that system works both in terms of its macro- <strong>and</strong> micro- properties. The role<br />
of the case study, therefore, is to ground the modelling techniques under development in a process<br />
involving qualitative data <strong>and</strong> the participation of industrial collaborators. In addition, we can argue<br />
that the models thus developed are more likely to be relevant to those issues <strong>and</strong> more likely to be<br />
demonstrably useful to industrial practitioners.<br />
For the case study, our ideal requirements were access to the organisation <strong>and</strong> close cooperation<br />
over a period of several months to enable us to carry out an iterative process of data collection,<br />
modelling, <strong>and</strong> analysis. Secondly, we looked for substantial business process-reengineering<br />
involving e-commerce taking place, where statistical data about the actual uptake <strong>and</strong> usage of the<br />
e-commerce systems could be collected. Thirdly, we wanted to make contact with large<br />
manufacturing companies, situated <strong>and</strong> operating in the North West of Engl<strong>and</strong>, since large<br />
companies are likely to have several employees working in e-commerce, <strong>and</strong> the logistics of access<br />
would be simplified in the vicinity of MMU. Fourthly, we required contacts at the company that<br />
had an interest in the success of the project, who could see the value potential of the research <strong>and</strong><br />
were willing to become stakeholders, providing input <strong>and</strong> working closely with the researcher. We<br />
were fortunate to find one company that fitted the bill very well.<br />
As part of a large multinational based in the UK, our industrial partners manufacture a range of<br />
products to equip factories with Industrial Automation equipment. The market is exclusively<br />
business-to-business: engineers work closely with customers who rely on their technological<br />
6
expertise to help design new production facilities. The company has thous<strong>and</strong>s of direct customers<br />
who are supplied directly from a central European store. There are also a large number of<br />
independent distributing companies (distributors) who hold inventory <strong>and</strong> cover every region of the<br />
UK. Distributors hold stock locally <strong>and</strong> offer technical assistance to speedily, <strong>and</strong> cost-effectively,<br />
serve the smaller customers. Unlike the manufacturer, they provide for credit card purchases <strong>and</strong><br />
are willing to take the financial risk of dealing with smaller customers. Another important benefit<br />
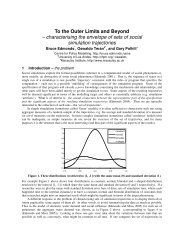
distributors give to the manufacturer is in having local sales forces, thus acting as a ‘multiplier’ of<br />
their products, reaching customers that they otherwise would not. The distribution arrangement is<br />
shown in Figure 1.<br />
Figure 1: Market structure. Heavy lines show the flow of orders <strong>and</strong> normal lines show the market relationships<br />
(representing all other kinds of information flow).<br />
Manufacturer's<br />
Central Supplies<br />
Orders<br />
Manufacturer<br />
Order Management<br />
Orders<br />
Internal Sales<br />
Distribution<br />
Team<br />
Regional<br />
Sales 1<br />
Regional<br />
Sales 50<br />
Orders<br />
Distributor<br />
Sales<br />
Distributor<br />
Sales<br />
Customer<br />
Customer<br />
Customer<br />
Customer<br />
VIA<br />
DISTRIBUTION<br />
DIRECT<br />
CUSTOMERS<br />
7
Electronic Data Interchange (EDI) is one well-established e-commerce technology that has been<br />
used with business partners (some distributors <strong>and</strong> some large customers) for a number of years.<br />
The focus now is on providing e-commerce to the remaining partners through use of Internet-based<br />
e-commerce. The company are undergoing business process reengineering to integrate EDI, existing<br />
dial-up Internet systems <strong>and</strong> telephone/FAX-based communication into a gateway system to<br />
interface with their own internal systems <strong>and</strong> databases. The centrepiece of this transformation<br />
would be an Internet-based electronic mall, specifically designed to encourage e-commerce<br />
amongst customers. Direct customers would be able to check product information <strong>and</strong> availability,<br />
make their purchases, <strong>and</strong> track their orders. The proposed EC system is shown in Figure 2.<br />
Figure 2: Proposed information infrastructure. Type of document is shown in a bold font; transmission media is<br />
shown in italics.<br />
Customers<br />
with<br />
Internet<br />
Access<br />
Customers<br />
with<br />
Internet<br />
Access<br />
Customers<br />
without<br />
Internet<br />
Access<br />
Web Forms<br />
Internet<br />
Internet<br />
Fax/Phone<br />
Telephone<br />
Distributors<br />
with<br />
Internet<br />
Access<br />
Web Forms<br />
Internet<br />
Universal<br />
Translator<br />
of Web<br />
Documents,<br />
<strong>and</strong> EDI<br />
Documents<br />
Manufacturer<br />
Files<br />
Database<br />
The new system would be operated in parallel with existing manual systems, which involves<br />
manual input of the orders received by FAX, though the company do envision the eventual<br />
replacement of all manual transactions with ones conducted electronically. The advantages of the<br />
Internet EDI compared to traditional EDI are that it is cheaper to adopt, more widely used <strong>and</strong><br />
compatible with other companies’ systems, <strong>and</strong> more flexible with regards to the kinds of<br />
information that may be shared. However, as the initiator of the technological change, it is essential<br />
that the manufacturer set up processes to effectively manage the customer <strong>and</strong> distributor adoption<br />
of EC. The company needs to ensure that the system also meets the needs of their customers, who<br />
also find it useful <strong>and</strong> share the benefits. It appears that the manufacturer is well aware of these<br />
8
needs: carrying out customer readiness surveys, publicising <strong>and</strong> putting forward EC to their<br />
distributors, <strong>and</strong> having a dedicated e-business team.<br />
Initial discussions with the stakeholders established that it would be appropriate to address issues<br />
within the Customer Services (CS) department the area that was estimated to be the most affected<br />
in the short to medium term by the introduction of the electronic mall there exists some degree of<br />
uncertainty over policy-making options in this area, thus it comprises a good test of the value of the<br />
modelling approach as a tool to aid managers in underst<strong>and</strong>ing some of the possible outcomes, <strong>and</strong><br />
their implications for policy makers. Secondly, focussing on issues within CS would be appropriate<br />
because it would allow us to study the interactions between the manufacturer <strong>and</strong> its many<br />
customers <strong>and</strong> distributors. This leads naturally to a model design with many agents, i.e. a Multi-<br />
<strong>Agent</strong> System (MAS), with a decentralised architecture composed of autonomously acting parts.<br />
Relevant information was introduced by the managers: a general background on the company<br />
including an overview of the present organisation of the Customer Services department, the<br />
information technologies which currently were being used by the organisation itself <strong>and</strong> by its<br />
business partners <strong>and</strong> customers, the roadmap for the introduction of new e-commerce<br />
technologies, <strong>and</strong> the goals of the management team in this regard. We interviewed company<br />
employees about how they anticipated the impacts of Internet-based EC on the function of the<br />
department <strong>and</strong> the likely benefits <strong>and</strong> problems associated with this transformation. The interview<br />
respondents were selected by our contacts: they included the people responsible for promoting e-<br />
commerce systems to business partners, <strong>and</strong> those using the EDI <strong>and</strong> Internet systems on a daily<br />
basis. The research questions <strong>and</strong> hence the research design were jointly defined by the author <strong>and</strong><br />
the stakeholders, over a series of meetings. The objective was to address the following issues:<br />
?? How will business processes be affected by the introduction of EC?<br />
?? What is the likely impact of EC on efficiency gains <strong>and</strong> productivity?<br />
?? How will EC impact the role of intermediaries?<br />
?? What are the important factors that determine customer take-up of EC?<br />
9
The research questions therefore centred on the impact of Internet-based e-commerce upon<br />
intermediaries role <strong>and</strong> market share, upon the internal processes, efficiency improvements <strong>and</strong><br />
resource savings that could be realised, <strong>and</strong> the identification of inhibitors <strong>and</strong> incentives for<br />
customer adoption of the electronic mall. Section 1 identified a number of research propositions<br />
<strong>and</strong> hypotheses from the literature in this area: other questions were raised by stakeholders at the<br />
inception of the project, <strong>and</strong> emerged during the evaluation phase. For example, they were<br />
interested in underst<strong>and</strong>ing better the impact of e-commerce upon internal productivity <strong>and</strong> upon<br />
the company’s reputation amongst customers. Some of these issues would be addressed with<br />
fieldwork interpretation <strong>and</strong> some by means of the ABSS modelling, as described in the following<br />
section.<br />
3. Methodology<br />
The research methodology outlined in this section incorporates agent-based social simulation<br />
(ABSS) with qualitative fieldwork <strong>and</strong> stakeholder participation in the design <strong>and</strong> evaluation<br />
phases. The research therefore draws upon several different paradigms <strong>and</strong> combines individual<br />
methods, in particular integrating the qualitative with the quantitative. We emphasize here that the<br />
qualitative nature of this research allows a perspective that is fundamentally inclusive because it<br />
permits collection of a wide spectrum of different data types. The approach is justified by the<br />
argument that flexibility in choice of research methods allows a richer underst<strong>and</strong>ing to develop of<br />
complex issues such as the impact of technological change. This is what Mingers (2001) terms<br />
strong pluralism where "all research situations are seen as inherently complex <strong>and</strong><br />
multidimensional, <strong>and</strong> would thus benefit from a range of methods." It is argued that the research<br />
presented herein exemplifies this multi-methodology approach.<br />
The methods outlined in Table 1 below each contribute significantly to the research design, <strong>and</strong> as<br />
we shall argue, complement each other well in developing a richer underst<strong>and</strong>ing <strong>and</strong> meeting our<br />
research aims. By the definition of Mingers, this design is multi-method. The methods are listed<br />
with the corresponding research approach (underlying philosophical perspective of the research)<br />
<strong>and</strong> the type of data which we are at each stage working with:<br />
10
Table 1: Summary of the research methods<br />
Method Data Type Approach<br />
1. In-depth Interviews &<br />
Analysis<br />
2. Formal <strong>Modelling</strong> &<br />
Statistical Analysis of<br />
Simulation Results<br />
<strong>Qualitative</strong><br />
<strong>Qualitative</strong><br />
& <strong>Quantitative</strong><br />
Interpretive<br />
(emergent findings)<br />
3. Stakeholder Evaluation <strong>Qualitative</strong> Interpretive<br />
4. Mall Statistics & Analysis <strong>Quantitative</strong> Positivist<br />
Grounded<br />
(interplay between data collection<br />
& analysis)<br />
The originality of the work presented here was to combine the qualitative with the quantitative in<br />
the development of an agent-based model which closely represents the system described in the case<br />
study. The qualitative aspect is encapsulated by the data provided by the case study fieldwork, <strong>and</strong><br />
the quantitative by sales <strong>and</strong> other data. The key problem is to relate the quantitative to the<br />
qualitative, <strong>and</strong> vice versa, i.e. to translate the qualitative data into a form suitable to apply the<br />
numerical methods of computer modelling, <strong>and</strong> to interpret numerical outputs of simulation<br />
experiments in terms of qualitative descriptions of modelled social phenomena.<br />
This methodology involves a large qualitative element which is based upon the principles set out by<br />
Yin (1994) on the case study method, <strong>and</strong> by Easterby-Smith, Thorpe et al. (2001) on management<br />
research. However, the ABSS modelling <strong>and</strong> stakeholder involvement in this project dem<strong>and</strong><br />
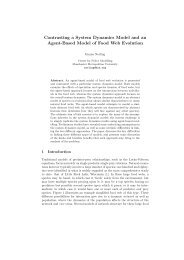
further clarification. Figure 3 (below) maps the stages of the project, <strong>and</strong> helps us to underst<strong>and</strong> the<br />
interplay between data collection <strong>and</strong> analysis.<br />
11
Figure 3: Methodology flow diagram<br />
Literature Review<br />
Identifying RQs<br />
Case Study Outline<br />
Problem Definition<br />
Fieldwork Data<br />
Interviews<br />
Mall Statistics<br />
1<br />
ABSS Model<br />
Assumptions<br />
Hypotheses<br />
Exploration<br />
Developing RQs<br />
Trial Simulations<br />
Redevelopment Of Model<br />
Specification<br />
Experimentation<br />
Testing RQs<br />
Replication<br />
Results<br />
2<br />
COMPARISON<br />
Empirical<br />
Measurement<br />
Mall Statistics<br />
Stakeholder Evaluation<br />
Plausibility Of Model<br />
Assumptions And <strong>Agent</strong><br />
Behaviour<br />
3<br />
Conclusions<br />
Generalise CS Findings<br />
Further Research<br />
12
As described in the figure, the first stage entailed a review of the existing literature on e-commerce,<br />
concentrating upon qualitative studies but considering also the broader view of technological<br />
change (see Section 1), the objective being to identify research propositions that are pertinent to the<br />
current work. Following this, we sketched an outline of the case study <strong>and</strong> discussed it with the<br />
stakeholders. Their input was instructive in defining the problem, identifying research questions,<br />
<strong>and</strong> evaluating plausibility <strong>and</strong> practicality of the methodological approach (see Section 2). This<br />
was followed by the actual data collection: semi-structured interviews took place with nine<br />
employees in a variety of positions at the company, including members of the e-commerce team,<br />
order management <strong>and</strong> internal sales. Data were collected using a tape recorder, <strong>and</strong> transcripts<br />
were made which were imported into ATLAS.ti (2002) for analysis.<br />
ATLAS is widely used by researchers in the social <strong>and</strong> management sciences to organise their<br />
primary data <strong>and</strong> to facilitate the qualitative analysis. The first task using ATLAS involves<br />
identifying ‘quotations’ in passages of text. These are tagged with ‘codes’ that are mnemonic aids<br />
which link together sets of quotations discussing the same concept. Codes therefore act as very<br />
useful aids to navigation of the primary data, because they allow user to click backwards <strong>and</strong><br />
forwards among sets of quotations. ATLAS also uses the idea of networks that the user can<br />
construct by linking codes together. Different windows open on network views (or on parts of the<br />
network), providing a means to visualise the semantic relationships between these codes <strong>and</strong><br />
quotations. The main benefits of using ATLAS were in making explicit the validation of model<br />
assumptions with primary data, <strong>and</strong> the st<strong>and</strong>ard organisational benefit in navigating <strong>and</strong> comparing<br />
passages of text, documenting, <strong>and</strong> writing up the emergent findings of the case study. However, in<br />
terms of producing the model design <strong>and</strong> experimental design, the ATLAS.ti package but was not<br />
found to be very useful because this aspect of a case study relies too heavily upon judgement <strong>and</strong><br />
interpretation of the researcher.<br />
Our analysis was carried out in accordance with the principles of the grounded theory methodology,<br />
where the collection <strong>and</strong> analysis of data are difficult to regard as separate stages. Fundamentally,<br />
this is because the research propositions were very loosely defined in this project. The agent-based<br />
model was informed by the qualitative fieldwork <strong>and</strong> quantitative data supplied by the stakeholders.<br />
13
However, in order to improve the relevance <strong>and</strong> accuracy of the model, we needed to take<br />
simulation results back into the field <strong>and</strong> involve the stakeholders in the evaluation process. We<br />
therefore have a continuous interplay between data collection <strong>and</strong> analysis, <strong>and</strong> the evaluation of the<br />
technique of ABSS modelling with stakeholder participation depends upon successfully developing<br />
them in synergy.<br />
The model was programmed using the SDML (Wallis <strong>and</strong> Moss 1994) platform. SDML is based on<br />
Smalltalk, which is a declarative, object oriented, programming language. SDML was specifically<br />
designed for developing agent-based models of social <strong>and</strong> economic scenarios, <strong>and</strong> has a large<br />
range of functionality that makes it highly suited to this task.<br />
The model consists of a set of assumptions regarding the nature <strong>and</strong> behaviour of the modelled<br />
system, <strong>and</strong> we have a number of hypotheses that we wish to explore <strong>and</strong> test with the model.<br />
Exploration aims to develop theory <strong>and</strong> allow the modeller to underst<strong>and</strong> better the range of<br />
behaviour possible via trial simulations. Experimentation on the other h<strong>and</strong>, is carried out to<br />
address particular hypotheses that we have in mind. In this research we defined our simulation<br />
experiments through model scenarios, as described in the next section. After initial simulations<br />
have been carried out, the model specification, experiments, <strong>and</strong> results are explained to the<br />
stakeholders. This involves examining both the assumptions on which the model is based <strong>and</strong> the<br />
micro behaviour of the agents to assess whether or not these are plausible. The critical evaluation of<br />
the stakeholders is very important since they are the domain experts. Evaluation links our findings<br />
back to the model specification in a cycle that can be repeated as necessary, a process which aims to<br />
improve the model design <strong>and</strong> strengthen the validity of results.<br />
The research design provided several ways to validate the model, proving to be a good<br />
demonstration of the cross-validation (Moss <strong>and</strong> Edmonds 2003) approach. It was centred upon<br />
three main areas where the model could be compared with the e-commerce system: these are the<br />
numbers marked on Figure 3. Number (1) marks where the model assumptions were informed by<br />
interview data: this was an integral part of producing the model design, <strong>and</strong> in the following section<br />
we show how concepts were taken from the fieldwork. Number (2) marks the comparison between<br />
14
simulation results <strong>and</strong> statistical logs from the mall: we aim to assess the macro-behaviour of the<br />
model in terms of that of the empirical system (see part five). Number (3) relies upon the<br />
participation of the stakeholders in an iterative evaluation <strong>and</strong> redevelopment process. This<br />
involves assessing both the assumptions upon which the model is based, <strong>and</strong> the micro-behaviour<br />
of simulated agents, in terms of their plausibility, as out lined in (Moss, Downing et al. 2000).<br />
We suggest that this model is well-validated in terms of the nature of the value chain <strong>and</strong> of the<br />
issues facing the manufacturer, though less in terms of the behaviour, attitudes, <strong>and</strong> expectations of<br />
customers <strong>and</strong> distributors. Of the different methods of validation, stakeholder evaluation should be<br />
the most reliable because stakeholders are sensitive to results that ‘do not look right’, i.e. are not<br />
like anything they have observed. However, potential problems with qualitative data are that<br />
respondents may be misinformed in their assertions, or we may misinterpret their degree of<br />
certainty in them. <strong>Quantitative</strong> data is more reliable but is limited to those concepts we can measure<br />
easily, which is quite restrictive in this type of model. This is why qualitative methods are also<br />
used: a model involving qualitative data requires qualitative methods of validation.<br />
There were two methodological issues encountered during the course of the research which may be<br />
considered unique to the approach taken. Firstly, significant collaboration was required between the<br />
researcher <strong>and</strong> the stakeholders via frequent e-mail, telephone <strong>and</strong> face-to-face discussions,<br />
presentations, etc. Consultation was important to develop the partnership, to ensure the stakeholders<br />
fully understood the nature of the project, <strong>and</strong> were able to contribute to it <strong>and</strong> benefit from it. It<br />
was necessary that stakeholders were aware of key modelling concepts in order that they could<br />
underst<strong>and</strong> the significance of the simulation experiments <strong>and</strong>, very importantly, contribute ideas of<br />
their own to the research design. Secondly, qualitative data were used to inform a quantitative<br />
model amenable to the techniques of numerical simulation. Descriptions provided by the fieldwork<br />
respondents needed to be translated into a suitably formal <strong>and</strong> precise language. However, it was<br />
important to preserve much of the semantic content in order that explanations for behaviour of the<br />
model could be generated to which the stakeholders could relate <strong>and</strong> therefore more easily identify.<br />
15
4. Model Description<br />
In this section, we show how the qualitative fieldwork informed the model assumptions by making<br />
explicit the links between data <strong>and</strong> model, identifying quotations <strong>and</strong> showing how these were built<br />
into the model specification.<br />
We developed an agent-based model of the supply chain described in the case study in which direct<br />
customers are supplied by the manufacturer, <strong>and</strong> other customers are supplied by independent<br />
intermediaries. Therefore we have very different sets of rules governing the behaviour of direct<br />
customers <strong>and</strong> intermediated customers.<br />
Customer <strong>and</strong> intermediary agents are located on a grid where the concept of 'neighbourhood' is<br />
important in defining how interactions take place: a neighbourhood is defined as the area including<br />
eight squares in each of the cardinal directions (North, South, East, <strong>and</strong> West), <strong>and</strong> neighbours are<br />
all the agents lying within these squares. The geographical aspect is important because<br />
communication takes place exclusively amongst neighbouring agents, <strong>and</strong> because the provision of<br />
local customer service factors is a benefit when choosing from amongst alternative intermediary<br />
suppliers. Intermediaries are also distinguished by their selling price (which may offer customers a<br />
small discount on the manufacturer's list price) <strong>and</strong> by technological competence which, as reported<br />
by interview respondents, varies greatly:<br />
“Some of our distributors are much better than others: some are more technically competent. They<br />
employ the right people with the right backgrounds <strong>and</strong> training. At this moment in time I have<br />
some reservations about the ability of some of our distributors to serve our customers in the way<br />
we would like.” (P4)<br />
In other words, intermediary agents are heterogeneous in terms of technological competence (their<br />
knowledge of the products, <strong>and</strong> the product areas in which they operate) as well as the price at<br />
which they sell the product. We model low, medium, <strong>and</strong> high levels of technical competence by<br />
coding with the integer values 1, 2, <strong>and</strong> 3 respectively. Selling price is an integer value drawn from<br />
16
the interval [71, 100] (list – discount, list). Intermediaries make a profit on their sales because they<br />
buy at a discounted price <strong>and</strong> sell on to customers at a higher ‘selling price’. Each cycle,<br />
intermediaries buy back from the manufacturer only the equivalent number of units to what has<br />
been sold. Moreover, it is assumed that they have an infinite amount of stock to supply their<br />
customers. Intermediaries that are not profitable, having zero profits over the trading cycle, (i.e.<br />
they do not achieve any sales) are removed from the simulation in subsequent cycles.<br />
Customer agents also differ in their dem<strong>and</strong>s: we modelled dem<strong>and</strong> with an exponential function<br />
that, according to one of the respondents, was a good approximation of the company’s markets. We<br />
used the function:<br />
bx<br />
D ? ae<br />
with a = 1, b = 4.605, <strong>and</strong> 1<br />
0 ? x ?<br />
The quantity x is drawn at r<strong>and</strong>om from a uniform distribution over the interval [0,1], giving a<br />
dem<strong>and</strong>, D, ranging from 1 to 100 units. The largest 20% of the customer population, i.e. those with<br />
x ? 0.8 , purchase directly from the manufacturer, <strong>and</strong> the remainder have a small probability to<br />
purchase directly commensurate with their size. We define two kinds of customer dem<strong>and</strong>: nonurgent<br />
stock to be held as inventory at the production site, <strong>and</strong> stock required urgently onsite as<br />
replacement. Orders for urgent products can only be fulfilled by suppliers local to the customer.<br />
Aside from this requirement, customers buy from the highest ‘endorsed’ supplier they can locate.<br />
The model is simulated through discrete time-steps, called trading cycles, in which agents interact<br />
via market transactions, <strong>and</strong> through various communication interactions. In simulation<br />
experiments we used: a large model with grid size of 50 x 50 cells <strong>and</strong> a cardinal range of visibility<br />
of 8 cells, <strong>and</strong> a small model with grid size of 35 x 35 cells <strong>and</strong> a cardinal range of 6 cells. In reality<br />
the company has very many more customers than captured by these figures: we found these<br />
parameters presented a reasonable balance between system scale <strong>and</strong> computational performance.<br />
Communication processes include referrals communication, where the customer receives<br />
information about the existence of alternate potential suppliers, <strong>and</strong> ‘endorsements’ communication<br />
or persuasion processes. We define ‘customer referrals’ as the process where, each trading cycle,<br />
17
the customer has a ‘word of mouth’ communication interaction with one of its neighbours, chosen<br />
at r<strong>and</strong>om. The customer receives information about the existence of alternate suppliers through<br />
this interaction: the neighbour communicates the identity of the supplier it used in the previous<br />
trading cycle. On the other h<strong>and</strong>, ‘manufacturer referrals’ describes the case where a customer<br />
contacts the manufacturer directly <strong>and</strong> requests a referral to an alternate supplier. Then the<br />
manufacturer informs the customer of the location another potential supplier, which the customer<br />
may subsequently contact <strong>and</strong> order from. The Fermi function:<br />
f ( z)<br />
?<br />
1/( e<br />
? ( z?z*)<br />
?<br />
1)<br />
with z* = 2 <strong>and</strong> ? = 1 1<br />
where z is the number of suppliers known to the customer, is used to calculate the probability, f(z),<br />
that a customer will request a referral from the manufacturer. The parameter z* is a transition value<br />
defineing a cut-off point where the probability of new relationships forming begins to decline, <strong>and</strong><br />
? is the parameter that controls the shape of the fall off at z*. Use of the Fermi function is based on<br />
the assumption that a customer is less likely to contact the manufacturer, the larger the number of<br />
alternative suppliers known, justified on the grounds that there is a cost to maintaining such<br />
connections amongst agents in terms of time <strong>and</strong> effort.<br />
In addition, we may also have interactions taking place in which information is passed about the<br />
characteristics of the supplier <strong>and</strong> about the nature of the electronic mall. The stakeholders<br />
described face-to-face type interactions between the company <strong>and</strong> their direct customers, <strong>and</strong><br />
between the company <strong>and</strong> their distributors, relating to the issue of e-commerce. We model these<br />
interactions as social influence interactions, where beliefs are communicated in the form of<br />
‘statements’. Social influence interactions may take place amongst neighbouring customers, as well<br />
as through persuasion processes initiated by the manufacturer. In our model, two beliefs selected at<br />
r<strong>and</strong>om are communicated from the source customer to the target customer; three beliefs selected at<br />
r<strong>and</strong>om from the manufacturer’s list are communicated to a subset of fifty direct customers /<br />
intermediaries in each cycle.<br />
18
In our analysis, we identified several hypotheses about e-commerce (HEC) <strong>and</strong> about distributors<br />
(HINT) that were considered by the interview respondents to be influential in shaping customer<br />
attitudes (see Table 2). These qualitative data were then incorporated into the model specification.<br />
Table 2: The HEC <strong>and</strong> the HINT<br />
HEC: Belief Qual.<br />
It is extra work for us to use the mall compared to a manual system Subj. False<br />
Almost everybody will soon be using Internet-EC: we should be doing it too. Ver. True<br />
Instantaneous <strong>and</strong> quick access to information (compared to traditional channels) is a benefit to us. Ver. True<br />
The 24-hour availability of access provided by the mall is of benefit to my company. Ver. True<br />
The provision of up-to-date <strong>and</strong> accurate information on the mall is of benefit to us. Ver. True<br />
The digitisation of product data sheets <strong>and</strong> the availability of software updates is a benefit. Ver. True<br />
The reduced possibility of errors occurring in orders going through the mall is a benefit. Ver. True<br />
The provision of more user-friendly ways of accessing account information on the mall is a benefit. Ver. True<br />
It is expensive for us to set up <strong>and</strong> maintain Internet-based systems compared to manual ones. Subj. False<br />
I am concerned about security issues with Internet-based systems compared to manual systems. Ver. False<br />
I am receptive to Internet-based EC because I expect we shall receive extra discounts if we adopt. Subj. True<br />
I am concerned about the lack of technical support <strong>and</strong> experience within the company of using EC. Subj. False<br />
I am receptive to EC because I expect we will receive more customer referrals if we adopt. 2 Subj. True<br />
HINT 3 :<br />
The supplier offers a good discount on the selling price of the product. Ver. True<br />
I am concerned that the distributor may lack technical competence. Ver. False<br />
The location (ability to offer a local service) of the supplier is a benefit. Subj. True<br />
We define a belief as a simple expression of agreement or disagreement with particular hypothesis,<br />
held by an agent. We then characterise as verifiable beliefs those hypotheses which are objectively<br />
true or false: characteristics of a technology upon which people generally agree, for example, that<br />
the 24-hour availability of the Internet is a benefit). Subjective beliefs are those that are wholly<br />
1 Simulations were run with different integer values for parameters z* <strong>and</strong> ? in order to find the best match with the<br />
shape of the curve for the customer referrals simulations.<br />
2 This hypothesis is relevant to distributors only.<br />
3 This set of hypotheses is relevant to intermediated customers only.<br />
19
dependent upon the circumstances of the agent (for example, the lack of technical support available<br />
within the company). Whereas verifiable beliefs may be communicated amongst agents, it is less<br />
meaningful to communicate subjective beliefs since individual situations are different: the latter are<br />
simply inferred to be true or false depending on the individual case. Each hypothesis also has an<br />
associated qualification, which in our model is a Boolean that takes the value ‘True’ or ‘False’, <strong>and</strong><br />
denotes whether it is a hypothesis that is supportive (True) or dismissive (False) of the decision to<br />
adopt / choice of supplier. The second <strong>and</strong> third columns in Table 2 identify the type of belief, <strong>and</strong><br />
its associated qualification. If the qualification is ‘True’ <strong>and</strong> the agent believes the hypothesis to be<br />
true, then this belief will have a positive impact upon the attitude of the agent. Similarly, if the<br />
qualification is ‘False’ <strong>and</strong> the agent believes the hypothesis to be true, then the belief will have a<br />
negative impact upon the attitude of the agent. If, however, the hypothesis is not believed to be true,<br />
then it will not contribute towards the attitude of the agent. This formulation is intended to capture<br />
the idea that customers are risk-averse. In other words, what this means is that a hypothesis can<br />
have either a positive or a negative impact, but not both.<br />
Central to the model is the 'endorsements scheme' based on the work of Cohen (1985) in which<br />
qualitative data structures (called endorsements) determine agent cognitive processes.<br />
Endorsements can be viewed as reasons to believe or disbelieve a hypothesis. In our model, agents<br />
collate data relating to hypotheses about intermediary performance, <strong>and</strong> about the benefits <strong>and</strong><br />
disadvantages of using Internet-EC. Information is gathered through interactions with neighbouring<br />
agents, with the manufacturer, <strong>and</strong> through experience of using the Internet-EC system. The<br />
endorsements scheme uses a lexicographical ranking system whereby different beliefs are assigned<br />
a different level of importance: those regarded as more important take precedence over lesser ones.<br />
The advantage of the endorsements model is that it allows the use of qualitative data to initialise the<br />
model, <strong>and</strong> preserves the structure of that data throughout the course of the simulation.<br />
In the model, we defined four different types of endorsements: inferences, which are specific to the<br />
situation of the agent <strong>and</strong> not subject to external influence, observations, which are the first-h<strong>and</strong><br />
experiences of the agent, statements, information received through social interaction with other<br />
agents, <strong>and</strong> initial perceptions, which are based on the assumption that all agents know about the<br />
20
existence of the mall from the initial cycle, <strong>and</strong> have some beliefs about its qualities (which may be<br />
misperceptions). However, as more evidence is gathered 4 , initial perceptions will tend to play a<br />
lesser role. The following algorithm defines how endorsements are used to determine beliefs:<br />
If there are either<br />
One observation that negates the hypothesis or<br />
Three statements that negate the hypothesis<br />
Then the belief is asserted as the negation of the qualification.<br />
Otherwise, if there are either<br />
Three observations that support the hypothesis or<br />
Three statements that support the hypothesis<br />
Then the belief is asserted as the confirmation of the qualification.<br />
(If the agent has fewer than three statements or observations as evidence to support the hypothesis, then it is not<br />
regarded as adequate to believe or disbelieve it.)<br />
Otherwise,<br />
If there is an initial perception that supports the hypothesis,<br />
Then the belief is asserted as ‘True’<br />
<strong>Agent</strong>s are endowed either with a manual/card-based internal, or IT/computer-based system. Two<br />
IOS also exist for placing orders - FAX/telephone or EDI. They can subsequently adopt the Internet<br />
mall system for ordering (direct customers) or for collecting information (intermediated customers).<br />
Each trading cycle, a user of the Internet-EC system will experience two aspects of the system <strong>and</strong><br />
the simulation will generate two new observation endorsements. These will be positive or negative<br />
experiences depending on the outcome of a probabilistic trial, which is governed by a system<br />
performance parameter. We model system performance failures by varying these parameters over<br />
time, allowing us to measure the effect of such problems on the number of users <strong>and</strong> their attitudes.<br />
4 We model a form of agent memory decay, where agents retain only the three most recent of each type of endorsements<br />
relating to each hypothesis.<br />
21
E-commerce is regarded as strategically highly important for future development of the company.<br />
The aim is to increase market share of sales by 10%: this is a very important context for the<br />
development of the mall because management hope that it will provide them with competitive<br />
advantage to carry out the expansion. The company also aims to reorganise CS by switching some<br />
direct sales through their distributors (the policy of channel alignment), as it is a more cost effective<br />
solution. With regard to e-commerce, their main policy is to take responsibility for informing<br />
customers <strong>and</strong> distributors of new possibilities for doing business electronically, to encourage <strong>and</strong><br />
provide incentives to use their systems. These incentives would include offering financial support<br />
(funding <strong>and</strong> equipment) to help with setting up EC, technical support <strong>and</strong> training for use of EC<br />
systems, <strong>and</strong> a discount incentive, as became clear through the fieldwork:<br />
“We are starting to incentivise them by giving them an extra percent [of discount] if they can trade<br />
with us electronically.” (P8)<br />
“Maybe it's a case of [us] having to invest in those distributors <strong>and</strong> give them the tools they need to<br />
be able to trade with us electronically <strong>and</strong> get on board with the email, conferencing training<br />
things that we are going to do.” (P8)<br />
“It may be a case of getting somebody to get in his car <strong>and</strong> go round <strong>and</strong> see everybody <strong>and</strong><br />
promote it <strong>and</strong> say "this is how to do it" <strong>and</strong> get people in there <strong>and</strong> help customers set it up<br />
because they haven't always got the resources to put time into setting it up at their end.” (P7)<br />
As we can see, the appropriate role of the company in supporting the adoption of the EC system<br />
was an issue discussed at length by the interview respondents. In our model we defined EC Set-Up,<br />
EC Technical, <strong>and</strong> EC Discount support strategies, providing arguments for the amount of support<br />
<strong>and</strong> trading cycle when the offer is made. This permits flexibility <strong>and</strong> allows us to explore the role<br />
of manufacturer interventions in shaping customer attitudes towards the Internet.<br />
Another respondent reported that the company had a certain amount of influence through<br />
manufacturer referrals, the process where customers are passed on to an intermediary supplier:<br />
22
‘It is quite important in encouraging our distributors that we provide referred business.’(P6)<br />
This is an important finding because it suggests that the company can indirectly influence the<br />
customer’s choice of supplier, hence providing leverage over distributors that are not adding value<br />
by, for example, having a proactive sales force, providing technical expertise, or using e-commerce.<br />
The difficulty with the above statement is that it could have several different interpretations, these<br />
would be formalised into very different rules, <strong>and</strong> could have a significant impact upon the result.<br />
For example, we can suppose a strong preference for any Internet – enabled distributor, or a weak<br />
preference, all other things being equal, when there is a choice of two local suppliers. Alternatively,<br />
we might hypothesise that some referrals are linked to a specifically adoption decision. We can<br />
overcome this vagueness or uncertainty with the involvement of stakeholders to clarify such issues.<br />
5. Simulation Experiments <strong>and</strong> Results<br />
Simulation experiments were designed to address the research questions by exploring the behaviour<br />
of the model in terms of the role of intermediaries <strong>and</strong> distribution of market share, <strong>and</strong> the rate of<br />
customer adoption of the mall, under different market scenarios. These scenarios include different<br />
specifications of agent interaction <strong>and</strong> communication protocols, manufacturer strategies for the<br />
support of EC adoption, <strong>and</strong> system performance failures. We also include a sensitivity analysis of<br />
model outcomes to initial conditions <strong>and</strong> different parameterisations of the model. This section<br />
concludes with a comparative analysis of simulation results with statistical data collected from the<br />
first fourteen months of operation of the mall provided by the stakeholders.<br />
In the first two scenarios, S1 <strong>and</strong> S2, we compare the effect on model behaviour of the specification<br />
of different communication scenarios. We specify two different ways in which customers can locate<br />
suppliers, following the construction of ‘neighbourhoods’ during the initialisation cycle. One way is<br />
through customer referrals via ‘word of mouth’ communication in S1, <strong>and</strong> the other is through<br />
manufacturer ‘referrals’ in S2. The customer, over the course of many cycles, gets an increased<br />
23
choice of suppliers <strong>and</strong> can select according more to his individual preference. This can be<br />
interpreted as a trend of increasing competition where suppliers compete more for customers.<br />
Figures 4 <strong>and</strong> 5 illustrate simulation results from a single run with the large model under S1.<br />
Examining intermediaries, market share, the first noticeable outcome is the large variation in the<br />
first few cycles of the simulation. When the graph gradually settles, we observe a group of four<br />
distributors clearly separating from the rest from around TC40, each having a large volume of sales.<br />
Whereas the largest distributor, intermediary-14 reaches 1687 units at TC100, <strong>and</strong> the second, third<br />
<strong>and</strong> fourth largest all manage sales of 900+ units, there is a clear cut-off point between these four<br />
<strong>and</strong> the rest of the distributors, all of which manage sales of under 500 units per cycle, from TC 20<br />
onwards. In fact, in the later stages of the simulation, the four larger distributors receive orders for<br />
more than twice as many units than the next largest distributor. Profits are more evenly distributed,<br />
however, with five large distributors sharing a similar amount of profits, at around 10-15,000 each,<br />
but also with a group of six medium-sized distributors making profits of 5-10,000, <strong>and</strong> the rest<br />
making between 1-5000 profits. In this simulation, all of the intermediaries survive until TC100,<br />
<strong>and</strong> seventeen of them are consistent users of Internet-EC.<br />
The number of users of EC is high for direct customers, reaching a maximum of 236 at TC64. As<br />
illustrated in Figure 6, the number of users gradually drops after TC70: this can be explained by the<br />
fact that the number of new adopters is lower than the number of direct customers getting referred<br />
to distributors each cycle. This also explains why the number of intermediated customers continues<br />
to increase slowly. The graph also illustrates a notable gap between the number of adopters <strong>and</strong> the<br />
number of users via distribution. This reveals that some customers after having adopted the mall<br />
subsequently stop using it.<br />
In contrast to the first scenario, in S2 we specify customer referrals rather than manufacturer<br />
referrals. Figures 7 <strong>and</strong> 8 were obtained from the same simulation run with the large model,<br />
specifying customer referrals but no communication of endorsements. The results in Figure 7 show<br />
the domination of the intermediation function by a single intermediary, intermediary-14, obtaining<br />
more than twice the volume of sales than the second largest intermediary (2685 units compared to<br />
24
1319 units). Although five intermediaries manage sales volumes of greater than 500 units, there is<br />
markedly greater inequality in this distribution: the majority have sales of less than 200. This<br />
inequality is also reflected in the result that there is one intermediary casualty: intermediary-2<br />
survives only up until TC19. The largest intermediary also makes a profit of more than 18,795 in<br />
TC100, compared to 15,190 (an increase of 24%) in the first scenario. In fact, Figure 8 shows a<br />
sharp decline in profits for many distributors, whereas other distributors grow quickly in terms of<br />
profitability. Intermediary-18 is the most visible example of this: starting with a very low<br />
profitability in the early part of the simulation, int-18 overtakes many other distributors that are<br />
experiencing declining profits, rapidly increases to a profitability of more than 15,000 by cycle 20,<br />
<strong>and</strong> becomes the most profitable intermediary in TC27. This demonstrates an interesting dynamic<br />
resulting from the customer referrals process – intermediaries experience highly changeable<br />
fortunes in the early part of the simulation, which eventually result in a very different state from the<br />
initial one. In comparison with S1, this suggests greater short to medium-term variation.<br />
The path of adoption of Internet-EC is virtually identical to that of the first scenario: high adoption<br />
amongst direct customers but low adoption amongst customers supplied via distribution. The extent<br />
of the market domination by few large distributors in these simulations clearly gives us an<br />
important result: it suggests that customer referrals leads to more distributor inequality compared to<br />
manufacturer referrals (i.e. scenario one). As all other parameters were exactly the same, this result<br />
must be attributed to the specification of communication processes: customer-to-customer ‘word of<br />
mouth’ communication results in large majorities of customers choosing the same (few) suppliers.<br />
In the simulation results shown in Figure 9 below, where we do specify endorsements, we find that<br />
the number of customers via distribution reaches a maximum of 260 agents in TC100. This is<br />
approximately three times as many as in the case without endorsements (83) or in S1 (109), whilst<br />
the number of direct adopters is approximately the same. This suggests the increase in<br />
intermediated customers adopting must be attributed to the communication of endorsements during<br />
those interactions. Our conclusion is that the specification of communication of endorsements<br />
information drives the high level of adoption: through customer-to-customer persuasion<br />
25
interactions, intermediated customers can collect information relating to the benefits (<strong>and</strong><br />
disadvantages) of e-commerce, <strong>and</strong> in this case, many of them are persuaded to adopt.<br />
Finally, Figure 10 shows the results of a test for the existence of the Pareto Power Law distribution,<br />
which states that there is a logarithmic relationship between the cumulative frequency of events (in<br />
this case, number of units sold) <strong>and</strong> the smallest to largest ordering of objects to which those events<br />
are ascribed (in this case, intermediaries). The figure shows five plots for the small simulations with<br />
customer referrals without endorsements communication 5 . If we discount the first two or three data<br />
points, there appears to be a linear relationship. However, suppliers with sales of fewer than ten<br />
units per cycle may only be viable if they can supply a range of products from many different<br />
manufacturers.<br />
In the following simulation experiments, we consider manufacturer support strategies for Internetbased<br />
EC: support with EC set-up, with technical knowledge, <strong>and</strong> extra discounts. All of these<br />
simulations are carried out with customer referrals <strong>and</strong> endorsements communication, without<br />
preferential referrals. The results of the four simulations with the small model are shown in Figure<br />
11, where number of users is plotted against time cycle on a single graph. It is clear that in the<br />
simulation runs where no support is offered to direct customers usage is the lowest (43 customers in<br />
TC 100) whereas offering some kind of support always results in a higher level of usage. This is<br />
hardly a surprising result, since in the model specification we assume that the customers always<br />
view these support interventions positively. In the ‘Set-Up Support Only’ simulation there is a<br />
small increase to 56 customers, <strong>and</strong> in ‘Technical Support Only’ there is an increase to 62<br />
customers. The ‘Extra Discounts’ incentive resulted in the largest increase in level of usage to 69<br />
customers (a 60% increase over ‘No Support’). In simulations with the large model we found<br />
‘Tech. Support Only’ <strong>and</strong> ‘Set-Up Only’, to produce similar patterns of a small increase in whilst<br />
‘Extra Discounts Only’ again resulted in much larger usage, although this had dropped off in the<br />
larger simulation by TC100. Figure 11 also demonstrates s-shaped adoption/usage curves,<br />
indicating a slow initial take-up, moving into a period of faster adoption, <strong>and</strong> gradually slowing to a<br />
5 We only show the one graph, but the model did exhibit similar outcomes both for manufacturer referrals as well as for<br />
the non-endorsement case. This was observed also in the large simulations.<br />
26
saturation point after about thirty cycles. This is an important result because it shows that the model<br />
exhibits an outcome resembling a pattern identified in empirical studies of technology diffusion.<br />
We carried out a sensitivity analysis to test the robustness of the model to changes in program<br />
implementation: in the poorly validated model assumptions, <strong>and</strong> in the parametric values used. The<br />
first test examined various grid sizes, <strong>and</strong> hence different densities, for the small model. The grid<br />
was varied in size from 35 square cells to 55 cells, in steps of five. In all cases we found the market<br />
share for intermediaries to be very similar to that illustrated in Figure 7. The main difference was in<br />
the lower number of known suppliers, with the sparseness the grid reducing social cohesion in the<br />
value chain. Secondly, we looked at the effect of changing the distribution of initial perceptions.<br />
Whilst many important perceptions have been identified, far less is known about the distribution of<br />
those attitudes. We changed the parameter governing the probability an agent has initial perceptions<br />
about EC, <strong>and</strong> found little notable difference, except that the speed of adoption was a little slower.<br />
These results demonstrate robustness to small changes of this type. We can therefore conclude that<br />
such details are not critical to the model: sensitivity does not appear to be problematic.<br />
We examined the simulation results concerning intermediary success (market share, profitability<br />
<strong>and</strong> survival rate) with respect to their characteristics of pricing <strong>and</strong> technical competence. It should<br />
be noted here that intermediaries do not have dynamic strategies for adjusting these characteristics<br />
during simulation runs. We found that profitability is strongly correlated to intermediaries’<br />
technical competence, but it is not correlated to intermediaries’ selling price. As the six most<br />
profitable intermediaries are all those with high technical competence, it is clear that this<br />
characteristic is a decisive factor in the success of intermediaries. Eight out of the next ten highest<br />
(i.e. the 7 th to the 16 th in the ordering) had a medium level of competence. In contrast, the price<br />
characteristic shows no clear pattern of correlation with profitability. Market share is closely related<br />
to price, but due to variability in intermediary mark-up, agents with large sales are not necessarily<br />
the most profitable. Very low price (below 80 units or 20% discount) intermediaries are ordered as<br />
2 nd , 7 th , 8 th <strong>and</strong> 14 th most profitable, which is only slightly better than average success rate. In<br />
addition, the two agents that did not survive in this simulation both had tech. competence level of 1<br />
(low). This reinforces the conclusion that intermediary success correlates with competence.<br />
27
Finally, we compared the macro behaviour of the simulation model with the mall statistics provided<br />
by the stakeholders. Figure 12 6 shows the number of mall orders <strong>and</strong> the total number of order lines<br />
included in those orders. Each order consists of a number of order lines specifying the type of<br />
product <strong>and</strong> the number of units required. Orders therefore range from the very large (many units of<br />
many different types of product) to the very small (a single line requesting one unit) so the mall<br />
statistics therefore only give us an estimation of the value of Internet sales. The chart illustrates an<br />
increasing number of orders <strong>and</strong> order lines over the period October 2001 to July 2002 that varies<br />
considerably from month to month.<br />
In addition, the mall statistics in Figure 13 show an increasing number of customers (i.e. number of<br />
registered users on the web site). It is evident that over the same time period, customers use the<br />
mall for an increasing number of transactions, i.e. 35 customers submitting a total of 36 orders<br />
during the month of October 2001 (1.029 orders per customer) compared with 201 customers<br />
submitting 258 orders during July 2002 (1.284 orders per customer) which represents an increase of<br />
25% orders per customer. They submit an increasing number of order lines: from 306 lines in 36<br />
orders (average 8.5 lines per order) to 2882 lines in 258 orders (average 11.17 lines per order), an<br />
increase of 31%. This analysis reveals a significant increase both in number of orders per customer,<br />
<strong>and</strong> in number of order lines per order that not only illustrates an increase in the total value of<br />
transactions through the mall, but also that customers may be increasingly feeling at ease in<br />
participating in the new system.<br />
When we compare on the same chart (Figure 13) the mall statistics <strong>and</strong> the results from one of our<br />
simulations (from S2), we see similarities in the shape of the curve in the first part of the<br />
simulation. We plotted the mall statistic ‘number of customers’ against the first 14 data points of<br />
the simulation results ‘number of direct customer-adopters’ <strong>and</strong> found very close correlation in the<br />
shape, when adjusted for scale on a 2-axis combination chart. This demonstrates that the model<br />
exhibits similar characteristic behaviour to that evidenced in the mall statistics.<br />
6 This chart was produced by one of the stakeholders.<br />
28
Figure 4: Chart of intermediary sales. Large simulation: manufacturer referrals.<br />
m_Ref: Intermediary Sales<br />
1800<br />
1600<br />
1400<br />
1200<br />
1000<br />
800<br />
600<br />
400<br />
200<br />
0<br />
1<br />
6<br />
11<br />
16<br />
21<br />
26<br />
31<br />
36<br />
41<br />
46<br />
51<br />
56<br />
61<br />
66<br />
71<br />
76<br />
81<br />
86<br />
91<br />
96<br />
101<br />
Trading Cycle<br />
Figure 5: Chart of intermediary profits. Large simulation: manufacturer referrals.<br />
M_Ref: Intermediary Profits<br />
25000<br />
20000<br />
15000<br />
10000<br />
5000<br />
0<br />
1<br />
6<br />
11<br />
16<br />
21<br />
26<br />
31<br />
36<br />
41<br />
46<br />
51<br />
56<br />
61<br />
66<br />
71<br />
76<br />
81<br />
86<br />
91<br />
96<br />
101<br />
29
Figure 6: Chart showing number of adopters. Large simulation: Manufacturer referrals.<br />
m_Ref: Number of Adopters/Users of Internet-EC<br />
250<br />
200<br />
150<br />
100<br />
50<br />
0<br />
1<br />
6<br />
11<br />
16<br />
21<br />
26<br />
31<br />
36<br />
41<br />
46<br />
51<br />
56<br />
61<br />
66<br />
71<br />
76<br />
81<br />
86<br />
91<br />
96<br />
101<br />
direct_users direct_adopters via_distribution_users via_distribution_adopters<br />
Figure 7: Chart showing intermediary sales. Large simulation: customer referrals.<br />
c_Ref: Intermediary Sales<br />
3000<br />
2500<br />
2000<br />
1500<br />
1000<br />
500<br />
0<br />
1<br />
6<br />
11<br />
16<br />
21<br />
26<br />
31<br />
36<br />
41<br />
46<br />
51<br />
56<br />
61<br />
66<br />
71<br />
76<br />
81<br />
86<br />
91<br />
96<br />
101<br />
30
Figure 8: Chart showing intermediary profits. Large simulation: customer referrals.<br />
c_Ref: Intermediary Profits<br />
30000<br />
25000<br />
20000<br />
15000<br />
10000<br />
5000<br />
0<br />
0<br />
5<br />
10<br />
15<br />
20<br />
25<br />
30<br />
35<br />
40<br />
45<br />
50<br />
55<br />
60<br />
65<br />
70<br />
75<br />
80<br />
85<br />
90<br />
95<br />
100<br />
Figure 9: Chart showing number of adopters <strong>and</strong> users of Internet channel. Large simulation: customer<br />
referrals with endorsements.<br />
c_Ref_End: Number of Adopters/Users of Internet<br />
300<br />
250<br />
200<br />
150<br />
100<br />
50<br />
0<br />
0<br />
5<br />
10<br />
15<br />
20<br />
25<br />
30<br />
35<br />
40<br />
45<br />
50<br />
55<br />
60<br />
65<br />
70<br />
75<br />
80<br />
85<br />
90<br />
95<br />
direct_users<br />
via_distribution_users<br />
direct_adopters<br />
via_distribution_adopters<br />
100<br />
31
Figure 10: Log of cumulative sales test for power law distribution. Small simulations: customer referrals with<br />
communication of endorsements.<br />
c_Ref_End: Cummulative Sales, Logarithmic Y<br />
10000<br />
1000<br />
100<br />
10<br />
Sim1<br />
Sim2<br />
Sim3<br />
Sim4<br />
Sim5<br />
1<br />
1 2 3 4 5 6 7 8 9 10 11 12 13 14 15 16 17 18 19 20<br />
Figure 11: Comparison of number of direct customer users under various manufacturer strategies. Small model:<br />
customer referrals with endorsements communication.<br />
Comparison of Number of Direct Customer Users Under<br />
Various Manufacturer Strategies (Small)<br />
90<br />
80<br />
70<br />
60<br />
50<br />
40<br />
30<br />
20<br />
10<br />
Tech. Support Only<br />
EC Set-Up Only<br />
Extra Discounts Only<br />
No Support<br />
0<br />
1<br />
6<br />
11<br />
16<br />
21<br />
26<br />
31<br />
36<br />
41<br />
46<br />
51<br />
56<br />
61<br />
66<br />
71<br />
76<br />
81<br />
86<br />
91<br />
96<br />
101<br />
32
Figure 12: Chart showing mall statistics between Oct 2001 <strong>and</strong> Jul 2002: number of mall orders <strong>and</strong> total<br />
number of order lines received.<br />
Mall Statistics: Mall Orders vs. Order Lines<br />
300<br />
250<br />
Number of Mall Orders<br />
Number of Mall Order Lines<br />
3500<br />
3000<br />
Number of Mall Orders<br />
200<br />
150<br />
100<br />
50<br />
2500<br />
2000<br />
1500<br />
1000<br />
500<br />
Number of Mall Order<br />
Lines<br />
0<br />
Oct 01 Nov 01 Dec 01 Jan 02 Feb 02 Mar 02 Apr 02 May 02 Jun 02 Jul 02<br />
Date<br />
0<br />
Figure 13. Chart comparing mall statistics with simulation results: the adoption curve. Large model, customer<br />
referrals with endorsements communication.<br />
Mall Statistics:<br />
Number of Adopters<br />
Comparison of Number of Adopters: Mall Statistics vs.<br />
Simulation Results<br />
250<br />
160<br />
200<br />
150<br />
100<br />
50<br />
0<br />
Jun<br />
01<br />
Jul<br />
01<br />
Aug<br />
01<br />
Mall<br />
Statistics<br />
Simulation<br />
Data<br />
Sep<br />
01<br />
Oct<br />
01<br />
Nov<br />
01<br />
Dec Jan<br />
01 02<br />
Date<br />
Feb<br />
02<br />
Mar<br />
02<br />
Apr<br />
02<br />
May<br />
02<br />
Jun<br />
02<br />
Jul<br />
02<br />
140<br />
120<br />
100<br />
80<br />
60<br />
40<br />
20<br />
0<br />
c_Ref_End: Number of<br />
Adopters<br />
33
6. Discussion<br />
We can argue, with reasonable confidence, that the model corresponds well with the supply chain<br />
described in the case study. Firstly, because it was based on information provided by the<br />
stakeholders identifying the main units of agency <strong>and</strong> processes involved, <strong>and</strong> secondly because of<br />
the extensive linking <strong>and</strong> validation procedures that were carried out. Finally, the model also<br />
exhibited statistical features such as power law distributions <strong>and</strong> s-shaped adoption curves, <strong>and</strong><br />
these properties were robust over many simulation experiments <strong>and</strong> different scenarios. These<br />
factors lead us to conclude that the model should not be ruled out on the basis of implausibility as a<br />
model of the value chain described in part 2. Furthermore, when used to explore research questions<br />
about the impact of Internet-EC on the supply chain, it produced some reasonable results.<br />
In terms of contribution to knowledge about value chain issues, we have the emergent findings of<br />
the fieldwork as well as interpretation of simulation results of section five. We explored research<br />
questions centring upon diffusion of e-commerce systems, drivers <strong>and</strong> inhibitors of adoption, the<br />
impact of e-commerce upon the role of intermediaries, their market share <strong>and</strong> profitability,<br />
disintermediation <strong>and</strong> reorganisation of the value system, manufacturer <strong>and</strong> intermediary strategies,<br />
<strong>and</strong> the importance of social influence processes. Case study findings were supportive of a weak<br />
disintermediation hypothesis - that some limited disintermediation could be expected, <strong>and</strong> that this<br />
could form part of a manufacturer strategy to improve information flow throughout the value chain.<br />
We were also able to identify the main inhibitors <strong>and</strong> drivers to adoption of e-commerce, <strong>and</strong> these<br />
factors were prominent aspects of our simulation model. The model was also based on the<br />
assumption that social influence plays an important role in the attitude formation of potential users<br />
of the system. Scenario analysis suggested that interaction amongst customers would lead to greater<br />
inequality in market share for intermediaries <strong>and</strong> changes in levels of adoption <strong>and</strong> use.<br />
The methodological approach was evidently appropriate because it allowed us develop a model of a<br />
complicated e-commerce business system (<strong>and</strong> we doubt that other modelling approaches could do<br />
the same). However, we found that the complexity of such a case study presented its share of<br />
34
difficulties: much work needs to be done to find appropriate techniques <strong>and</strong> methods. Some have<br />
been suggested in this paper, for example, the problem of incorporating qualitative data into formal<br />
models, <strong>and</strong> maintaining close contact with domain experts to clarify modelling issues. Whilst we<br />
do not propose that the technology is sufficiently advanced to use as replacement for multiple case<br />
studies in qualitative research, we strongly believe that there is much to be gained from using agentbased<br />
modelling in parallel. In essence, this is the argument for multimethodology – a debate which<br />
is attracting much attention in the area of management of information systems. In this paper we<br />
advocate ABSS modelling as one such alternative.<br />
In the process of carrying out the case study, there were also some unforeseen difficulties which<br />
appeared. One issue was the changing circumstances within the company itself, which resulted in<br />
difficulties with the case study. For example, the model development cycle was hindered by the<br />
imminent arrival of a new director <strong>and</strong> by the approaching retirement of one of the key<br />
stakeholders, which would, it was anticipated, provoke changes both in the way the department was<br />
run <strong>and</strong> in the focus of development for the e-commerce team. After the initial high level of<br />
enthusiasm for the project, these factors led to a lessening of involvement in the project in the face<br />
of changing circumstance <strong>and</strong> more pressing commitments. For the case study research, the<br />
consequences of this reduced involvement were: lack of access to data, difficulties in completing<br />
the model evaluation process, <strong>and</strong> eventually an abrupt ending to the project. A secondary problem<br />
we encountered was that the stakeholders did not deliver the data <strong>and</strong> access they had agreed to in<br />
the case study design, despite repeated requests. This is a typical pitfall of doing management<br />
research: contacts are very busy <strong>and</strong> can afford little time to be involved in research projects.<br />
Unfortunately, these data were useful information that would have benefited the case study greatly.<br />
Specifically, we were not able to obtain data on intermediary characteristics, or to gain access to<br />
customers for the quantitative survey. These were both very important aspects of the case study.<br />
A main criticism of the paper would be that there was a lack of information about the nature <strong>and</strong><br />
characteristics of intermediaries <strong>and</strong> customers <strong>and</strong> the perceptions that drive their behaviour. Since<br />
we did not speak to any intermediaries to get their views <strong>and</strong> their underst<strong>and</strong>ings of the<br />
perspectives of intermediated customers, this probably led to a one-sided view of e-commerce<br />
35
development. It also meant that we explored the strategic options for the manufacturer only, <strong>and</strong> we<br />
have very little conception of customer <strong>and</strong> distributor alternatives, i.e. their responses to<br />
manufacturer actions. In general, the lack of information was problematic because it left us with a<br />
number of model assumptions that were less well validated than they might have been.<br />
References<br />
(2001). The new B2B: Collaboration is key. The McKinsey Quarterly (CNET News.com).<br />
(2002). ATLAS.ti, Scientific Software Development.<br />
Bakos, Y., Lucas, H. C. Jr., Oh, W., Simon, G., Viswanathan, S. <strong>and</strong> Weber, B. (2000). The Impact<br />
of Electronic Commerce on the Retail Brokerage Industry. New York, Stern School of Business,<br />
New York University.<br />
Benjamin, R. <strong>and</strong> R. Wig<strong>and</strong> (1995). "Electronic Markets <strong>and</strong> Virtual Value Chains on the<br />
Information Superhighway." Sloan Management Review(Winter): 62-71.<br />
Berryman, K., L. F. Harrington, et al. (2000). "Electronic commerce: Three emerging strategies."<br />
The McKinsey Quarterly 2000(3): 129-136.<br />
Ch<strong>and</strong>ler, A. D. (1977). The visible h<strong>and</strong> : the managerial revolution in American business.<br />
Cambridge, Mass. ; London, Harvard University Press 1977.<br />
Chircu, A. M. <strong>and</strong> R. Kauffman (2000). "Reintermediation Strategies in Business-to-Business<br />
Electronic Commerce." International Journal of Electronic Commerce 4(4): 7-42.<br />
Cohen, P. R. (1985). Heuristic reasoning about uncertainty : an artificial intelligence approach.<br />
London, Pitman 1985.<br />
Easterby-Smith, M., R. Thorpe, et al. (2001). Management research : an introduction. London, Sage<br />
2001.<br />
Fabris, P. (1997). EC Riders. CIO Magazine.<br />
Fioretti, G. (2001). "Information Structure <strong>and</strong> Behaviour of a Textile Industrial District." Journal<br />
of Artificial Societies <strong>and</strong> Social Simulation (JASSS) 4(4).<br />
Jin, L. <strong>and</strong> D. Robey (1999). "Explaining Cybermediation: An Organizational Analysis of<br />
Electronic Retailing." 3(4).<br />
36
Malone, T. W., J. Yates, et al. (1987). "Electronic Markets <strong>and</strong> Electronic Hierarchies."<br />
Communications of the ACM 30(6): 484-497.<br />
Marshall, P., R. Sor, et al. (2000). "An industry case study of the impacts of electronic commerce<br />
on car dealership in Western Australia." Journal of Electronic Commerce Research 1(1): 1-16.<br />
McCubbrey, D. J. (1999). "Disintermediation <strong>and</strong> Reintermediation in the U.S. Air Travel<br />
Distribution Industry: A Delphi Study." Communications of the Association for Information<br />
Systems 1.<br />
Mingers, J. (2001). "Combining IS Research Methods: Towards a Pluralist Methodology."<br />
Information Systems Research 12(3): 240-259.<br />
Moss, S., T. Downing, et al. (2000). Demonstrating the Role of Stakeholder Participation: An<br />
<strong>Agent</strong> <strong>Based</strong> Social Simulation Model of Water Dem<strong>and</strong> Policy <strong>and</strong> Response, Centre for Policy<br />
<strong>Modelling</strong>.<br />
Moss, S. <strong>and</strong> B. Edmonds (2003). Sociology <strong>and</strong> Simulation: - Statistical <strong>and</strong> <strong>Qualitative</strong> Cross-<br />
Validation, MMU.<br />
Moss, S., B. Edmonds, et al. (2000). The Power Law <strong>and</strong> Critical Density in Large Multi <strong>Agent</strong><br />
Systems. Manchester, MMU.<br />
Parunak, V. <strong>and</strong> R. V<strong>and</strong>erbok (1998). Modeling the Extended Supply Network. ISA Tech'98,<br />
Houston, Texas.<br />
Porter, G. <strong>and</strong> H. C. Livesay (1971). Merchants <strong>and</strong> Manufacturers, John Hopkins Press.<br />
Porter, M. E. (1985). Competitive advantage : creating <strong>and</strong> sustaining superior performance. New<br />
York, Free Press.<br />
Rayport, J. F. <strong>and</strong> J. J. Sviokla (1996). "Exploiting the virtual value chain." The McKinsey<br />
Quarterly 1996(1).<br />
Swaminathan, J. M., S. F. Smith, et al. (1998). "Modeling Supply Chain Dynamics: A Multiagent<br />
Approach." Decision Sciences Journal 29(3): 607 - 632.<br />
Tapscott, D. (1996). The digital economy : promise <strong>and</strong> peril in the age of networked intelligence.<br />
New York ; London, McGraw-Hill.<br />
Timmers, P. (1999). Electronic commerce : strategies <strong>and</strong> models for business-to-business trading.<br />
New York, Wiley 1999.<br />
Turban, E., J. Lee, et al. (1999). Electronic Commerce: A Managerial Perspective, Prentice Hall.<br />
37
Wallis, S. <strong>and</strong> S. Moss (1994). Efficient Forward Chaining for Declarative Rules in a Multi-<strong>Agent</strong><br />
<strong>Modelling</strong> Language, Centre for Policy <strong>Modelling</strong>, MMU.<br />
Watson, R. T. <strong>and</strong> P. G. McKeown (1999). "Manheim Auctions: Transforming Interorganizational<br />
Relationships with an Extranet." International Journal of Electronic Commerce 3(4): 29-46.<br />
Yin, R. K. (1994). Case Study Research : Design <strong>and</strong> Methods.<br />
38