1 Agent-Based Modelling Incorporating Qualitative and Quantitative ...
1 Agent-Based Modelling Incorporating Qualitative and Quantitative ...
1 Agent-Based Modelling Incorporating Qualitative and Quantitative ...
You also want an ePaper? Increase the reach of your titles
YUMPU automatically turns print PDFs into web optimized ePapers that Google loves.
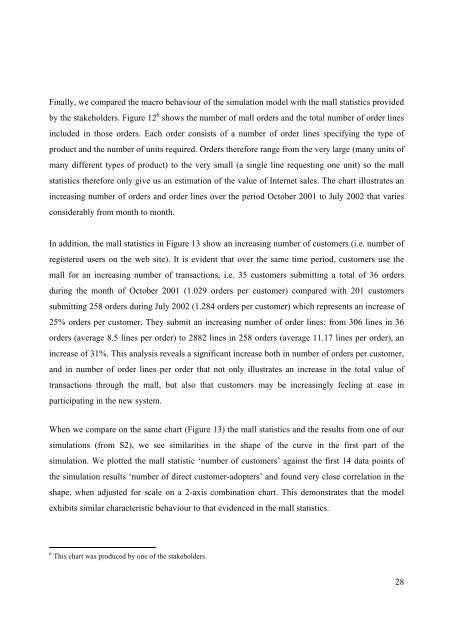
Finally, we compared the macro behaviour of the simulation model with the mall statistics provided<br />
by the stakeholders. Figure 12 6 shows the number of mall orders <strong>and</strong> the total number of order lines<br />
included in those orders. Each order consists of a number of order lines specifying the type of<br />
product <strong>and</strong> the number of units required. Orders therefore range from the very large (many units of<br />
many different types of product) to the very small (a single line requesting one unit) so the mall<br />
statistics therefore only give us an estimation of the value of Internet sales. The chart illustrates an<br />
increasing number of orders <strong>and</strong> order lines over the period October 2001 to July 2002 that varies<br />
considerably from month to month.<br />
In addition, the mall statistics in Figure 13 show an increasing number of customers (i.e. number of<br />
registered users on the web site). It is evident that over the same time period, customers use the<br />
mall for an increasing number of transactions, i.e. 35 customers submitting a total of 36 orders<br />
during the month of October 2001 (1.029 orders per customer) compared with 201 customers<br />
submitting 258 orders during July 2002 (1.284 orders per customer) which represents an increase of<br />
25% orders per customer. They submit an increasing number of order lines: from 306 lines in 36<br />
orders (average 8.5 lines per order) to 2882 lines in 258 orders (average 11.17 lines per order), an<br />
increase of 31%. This analysis reveals a significant increase both in number of orders per customer,<br />
<strong>and</strong> in number of order lines per order that not only illustrates an increase in the total value of<br />
transactions through the mall, but also that customers may be increasingly feeling at ease in<br />
participating in the new system.<br />
When we compare on the same chart (Figure 13) the mall statistics <strong>and</strong> the results from one of our<br />
simulations (from S2), we see similarities in the shape of the curve in the first part of the<br />
simulation. We plotted the mall statistic ‘number of customers’ against the first 14 data points of<br />
the simulation results ‘number of direct customer-adopters’ <strong>and</strong> found very close correlation in the<br />
shape, when adjusted for scale on a 2-axis combination chart. This demonstrates that the model<br />
exhibits similar characteristic behaviour to that evidenced in the mall statistics.<br />
6 This chart was produced by one of the stakeholders.<br />
28


