1 Agent-Based Modelling Incorporating Qualitative and Quantitative ...
1 Agent-Based Modelling Incorporating Qualitative and Quantitative ...
1 Agent-Based Modelling Incorporating Qualitative and Quantitative ...

You also want an ePaper? Increase the reach of your titles
YUMPU automatically turns print PDFs into web optimized ePapers that Google loves.
choice of suppliers <strong>and</strong> can select according more to his individual preference. This can be<br />
interpreted as a trend of increasing competition where suppliers compete more for customers.<br />
Figures 4 <strong>and</strong> 5 illustrate simulation results from a single run with the large model under S1.<br />
Examining intermediaries, market share, the first noticeable outcome is the large variation in the<br />
first few cycles of the simulation. When the graph gradually settles, we observe a group of four<br />
distributors clearly separating from the rest from around TC40, each having a large volume of sales.<br />
Whereas the largest distributor, intermediary-14 reaches 1687 units at TC100, <strong>and</strong> the second, third<br />
<strong>and</strong> fourth largest all manage sales of 900+ units, there is a clear cut-off point between these four<br />
<strong>and</strong> the rest of the distributors, all of which manage sales of under 500 units per cycle, from TC 20<br />
onwards. In fact, in the later stages of the simulation, the four larger distributors receive orders for<br />
more than twice as many units than the next largest distributor. Profits are more evenly distributed,<br />
however, with five large distributors sharing a similar amount of profits, at around 10-15,000 each,<br />
but also with a group of six medium-sized distributors making profits of 5-10,000, <strong>and</strong> the rest<br />
making between 1-5000 profits. In this simulation, all of the intermediaries survive until TC100,<br />
<strong>and</strong> seventeen of them are consistent users of Internet-EC.<br />
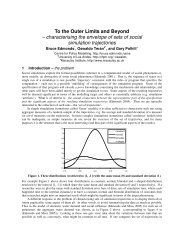
The number of users of EC is high for direct customers, reaching a maximum of 236 at TC64. As<br />
illustrated in Figure 6, the number of users gradually drops after TC70: this can be explained by the<br />
fact that the number of new adopters is lower than the number of direct customers getting referred<br />
to distributors each cycle. This also explains why the number of intermediated customers continues<br />
to increase slowly. The graph also illustrates a notable gap between the number of adopters <strong>and</strong> the<br />
number of users via distribution. This reveals that some customers after having adopted the mall<br />
subsequently stop using it.<br />
In contrast to the first scenario, in S2 we specify customer referrals rather than manufacturer<br />
referrals. Figures 7 <strong>and</strong> 8 were obtained from the same simulation run with the large model,<br />
specifying customer referrals but no communication of endorsements. The results in Figure 7 show<br />
the domination of the intermediation function by a single intermediary, intermediary-14, obtaining<br />
more than twice the volume of sales than the second largest intermediary (2685 units compared to<br />
24