Modelling the Socio-Economic Impact of HIV/AIDS in South Africa
Modelling the Socio-Economic Impact of HIV/AIDS in South Africa
Modelling the Socio-Economic Impact of HIV/AIDS in South Africa
Create successful ePaper yourself
Turn your PDF publications into a flip-book with our unique Google optimized e-Paper software.
In a different sett<strong>in</strong>g, as represented <strong>in</strong> Figure 2, availability <strong>of</strong> <strong>the</strong> child and orphan grants (see<br />
table 1) was not restricted. The households were able to persist much longer than <strong>in</strong> <strong>the</strong> experiment<br />
shown <strong>in</strong> Figure 1. Moreover, as <strong>the</strong> top-right chart <strong>in</strong> Figure 2 shows, <strong>the</strong> <strong>in</strong>crease <strong>in</strong> <strong>the</strong> overall<br />
memberships <strong>of</strong> <strong>the</strong> funeral clubs reached its maximum much later than <strong>in</strong> <strong>the</strong> previous case.<br />
The anecdotal evidence shows that <strong>the</strong> extended family networks are very strong. Often children<br />
stay <strong>in</strong> <strong>the</strong>ir parents’ households even when <strong>the</strong>y are married and have children <strong>the</strong>mselves. Household<br />
members with no adult to look after <strong>the</strong>m are <strong>of</strong>ten taken care <strong>of</strong> by ano<strong>the</strong>r household <strong>in</strong> <strong>the</strong> extended<br />
family. To <strong>in</strong>vestigate <strong>the</strong>se effects we used a fur<strong>the</strong>r two scenarios. In <strong>the</strong> first one, each household<br />
was randomly assigned highly clustered family l<strong>in</strong>ks. Fur<strong>the</strong>r l<strong>in</strong>ks are <strong>the</strong>n established over <strong>the</strong><br />
simulation run as a result <strong>of</strong> marriages <strong>in</strong> <strong>the</strong> community. In <strong>the</strong> second scenario, used as a lower<br />
bound to possible network structures, extended family ties are solely established via marriage. In both<br />
scenarios marriages are constra<strong>in</strong>ed by <strong>the</strong> availability <strong>of</strong> partners from <strong>the</strong> eligible age range <strong>in</strong> <strong>the</strong><br />
community and <strong>the</strong> money (lebola), which <strong>the</strong> groom has to pay <strong>the</strong> bride’s family.<br />
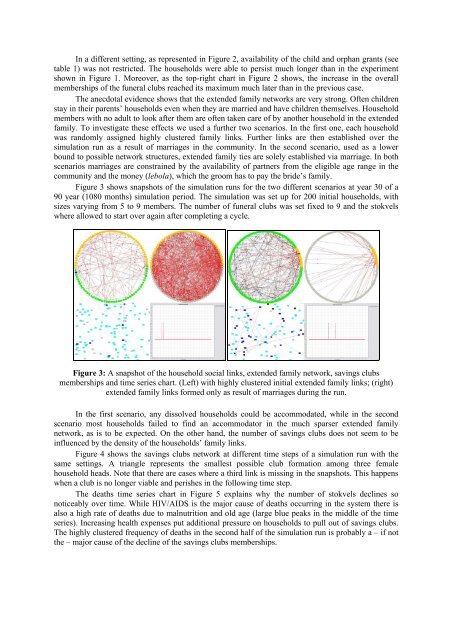
Figure 3 shows snapshots <strong>of</strong> <strong>the</strong> simulation runs for <strong>the</strong> two different scenarios at year 30 <strong>of</strong> a<br />
90 year (1080 months) simulation period. The simulation was set up for 200 <strong>in</strong>itial households, with<br />
sizes vary<strong>in</strong>g from 5 to 9 members. The number <strong>of</strong> funeral clubs was set fixed to 9 and <strong>the</strong> stokvels<br />
where allowed to start over aga<strong>in</strong> after complet<strong>in</strong>g a cycle.<br />
Figure 3: A snapshot <strong>of</strong> <strong>the</strong> household social l<strong>in</strong>ks, extended family network, sav<strong>in</strong>gs clubs<br />
memberships and time series chart. (Left) with highly clustered <strong>in</strong>itial extended family l<strong>in</strong>ks; (right)<br />
extended family l<strong>in</strong>ks formed only as result <strong>of</strong> marriages dur<strong>in</strong>g <strong>the</strong> run.<br />
In <strong>the</strong> first scenario, any dissolved households could be accommodated, while <strong>in</strong> <strong>the</strong> second<br />
scenario most households failed to f<strong>in</strong>d an accommodator <strong>in</strong> <strong>the</strong> much sparser extended family<br />
network, as is to be expected. On <strong>the</strong> o<strong>the</strong>r hand, <strong>the</strong> number <strong>of</strong> sav<strong>in</strong>gs clubs does not seem to be<br />
<strong>in</strong>fluenced by <strong>the</strong> density <strong>of</strong> <strong>the</strong> households’ family l<strong>in</strong>ks.<br />
Figure 4 shows <strong>the</strong> sav<strong>in</strong>gs clubs network at different time steps <strong>of</strong> a simulation run with <strong>the</strong><br />
same sett<strong>in</strong>gs. A triangle represents <strong>the</strong> smallest possible club formation among three female<br />
household heads. Note that <strong>the</strong>re are cases where a third l<strong>in</strong>k is miss<strong>in</strong>g <strong>in</strong> <strong>the</strong> snapshots. This happens<br />
when a club is no longer viable and perishes <strong>in</strong> <strong>the</strong> follow<strong>in</strong>g time step.<br />
The deaths time series chart <strong>in</strong> Figure 5 expla<strong>in</strong>s why <strong>the</strong> number <strong>of</strong> stokvels decl<strong>in</strong>es so<br />
noticeably over time. While <strong>HIV</strong>/<strong>AIDS</strong> is <strong>the</strong> major cause <strong>of</strong> deaths occurr<strong>in</strong>g <strong>in</strong> <strong>the</strong> system <strong>the</strong>re is<br />
also a high rate <strong>of</strong> deaths due to malnutrition and old age (large blue peaks <strong>in</strong> <strong>the</strong> middle <strong>of</strong> <strong>the</strong> time<br />
series). Increas<strong>in</strong>g health expenses put additional pressure on households to pull out <strong>of</strong> sav<strong>in</strong>gs clubs.<br />
The highly clustered frequency <strong>of</strong> deaths <strong>in</strong> <strong>the</strong> second half <strong>of</strong> <strong>the</strong> simulation run is probably a – if not<br />
<strong>the</strong> – major cause <strong>of</strong> <strong>the</strong> decl<strong>in</strong>e <strong>of</strong> <strong>the</strong> sav<strong>in</strong>gs clubs memberships.


