Peripheral vision and pattern recognition: a review - strasburger - main
Peripheral vision and pattern recognition: a review - strasburger - main
Peripheral vision and pattern recognition: a review - strasburger - main

You also want an ePaper? Increase the reach of your titles
YUMPU automatically turns print PDFs into web optimized ePapers that Google loves.
<strong>Peripheral</strong>_Vision.doc<br />
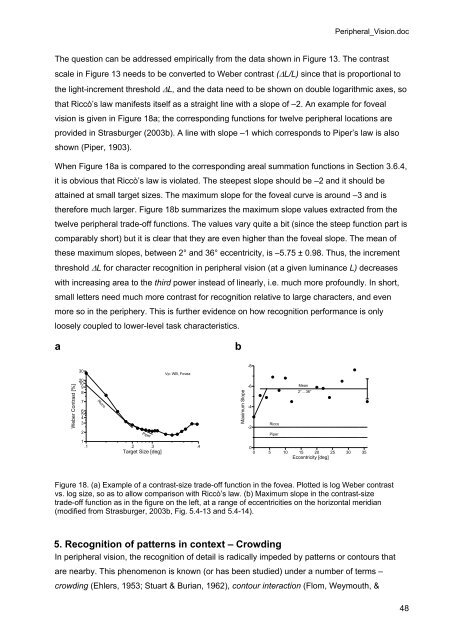
The question can be addressed empirically from the data shown in Figure 13. The contrast<br />
scale in Figure 13 needs to be converted to Weber contrast (ΔL/L) since that is proportional to<br />
the light-increment threshold ΔL, <strong>and</strong> the data need to be shown on double logarithmic axes, so<br />
that Riccò’s law manifests itself as a straight line with a slope of –2. An example for foveal<br />
<strong>vision</strong> is given in Figure 18a; the corresponding functions for twelve peripheral locations are<br />
provided in Strasburger (2003b). A line with slope –1 which corresponds to Piper’s law is also<br />
shown (Piper, 1903).<br />
When Figure 18a is compared to the corresponding areal summation functions in Section 3.6.4,<br />
it is obvious that Riccò’s law is violated. The steepest slope should be –2 <strong>and</strong> it should be<br />
attained at small target sizes. The maximum slope for the foveal curve is around –3 <strong>and</strong> is<br />
therefore much larger. Figure 18b summarizes the maximum slope values extracted from the<br />
twelve peripheral trade-off functions. The values vary quite a bit (since the steep function part is<br />
comparably short) but it is clear that they are even higher than the foveal slope. The mean of<br />
these maximum slopes, between 2° <strong>and</strong> 36° eccentricity, is –5.75 ± 0.98. Thus, the increment<br />
threshold ΔL for character <strong>recognition</strong> in peripheral <strong>vision</strong> (at a given luminance L) decreases<br />
with increasing area to the third power instead of linearly, i.e. much more profoundly. In short,<br />
small letters need much more contrast for <strong>recognition</strong> relative to large characters, <strong>and</strong> even<br />
more so in the periphery. This is further evidence on how <strong>recognition</strong> performance is only<br />
loosely coupled to lower-level task characteristics.<br />
a<br />
b<br />
Weber Contrast [%]<br />
30<br />
20<br />
10<br />
9<br />
8<br />
7<br />
6<br />
5<br />
4<br />
3<br />
2<br />
1<br />
Ricco<br />
Piper<br />
Vp: WB, Fovea<br />
.1 .2 .3 .4<br />
Target Size [deg]<br />
Maximum Slope<br />
-8<br />
-6<br />
-4<br />
-2<br />
0<br />
Ricco<br />
Piper<br />
Mean<br />
2°... 36°<br />
0 5 10 15 20 25 30 35<br />
Eccentricity [deg]<br />
Figure 18. (a) Example of a contrast-size trade-off function in the fovea. Plotted is log Weber contrast<br />
vs. log size, so as to allow comparison with Riccò’s law. (b) Maximum slope in the contrast-size<br />
trade-off function as in the figure on the left, at a range of eccentricities on the horizontal meridian<br />
(modified from Strasburger, 2003b, Fig. 5.4-13 <strong>and</strong> 5.4-14).<br />
5. Recognition of <strong>pattern</strong>s in context – Crowding<br />
In peripheral <strong>vision</strong>, the <strong>recognition</strong> of detail is radically impeded by <strong>pattern</strong>s or contours that<br />
are nearby. This phenomenon is known (or has been studied) under a number of terms –<br />
crowding (Ehlers, 1953; Stuart & Burian, 1962), contour interaction (Flom, Weymouth, &<br />
48