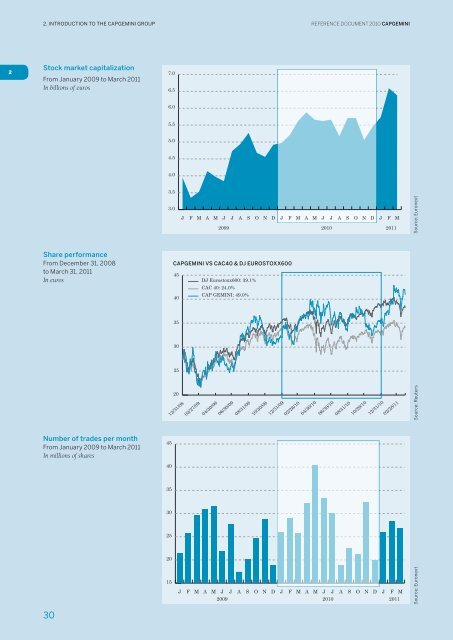
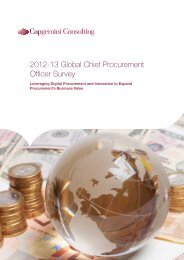
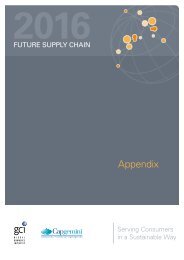
2 2. <strong>INTRODUCTION</strong> <strong>TO</strong> <strong>THE</strong> <strong>CAPGEMINI</strong> <strong>GROUP</strong> Stock market capitalization From January 2009 to March 2011 In billions of euros Share performance From December 31, 2008 to March 31, 2011 In euros Number of trades per month From January 2009 to March 2011 In millions of shares 30 *"# )"' )"# '"' '"# ("' ("# !"' !"# &" &$ %" %$ #" #$ !" - , + 2 + - - 2 1 0 / . - , + 2 REFERENCE DOCUMENT 2010 <strong>CAPGEMINI</strong> $##% $#&# $#&& <strong>CAPGEMINI</strong> VS CAC40 & DJ EUROS<strong>TO</strong>XX600 %# %" $# $" !# !" 4!=$4="> ) "!=!?="2 ( ' &'()*+,-.,//0""1($2345 676(%"1(!%3"5 678(9):;=44 ' Source: Euronext Source: Euronext Source: Reuters
<strong>CAPGEMINI</strong> REFERENCE DOCUMENT 2010 Share price and trading volume The following table presents an analysis of trading in the Company’s shares over the last 24 months: Month Number of trading days 2. <strong>INTRODUCTION</strong> <strong>TO</strong> <strong>THE</strong> <strong>CAPGEMINI</strong> <strong>GROUP</strong> Share price Trading volume (in euros) Number of shares Value high average* low total average (daily) (millions of euros) April 09 20 28.64 26.35 23.44 30,956,544 1,547,827 844.9 May 09 20 29.1 1 27.28 25.60 31,513,880 1,575,694 889.1 June 09 22 28.14 26.04 24.45 21,781,565 990,071 581.0 July 09 23 32.50 27.74 24.79 27,669,580 1,203,025 789.1 August 09 21 35.00 32.76 30.92 17,425,893 829,804 576.6 September 09 22 36.68 35.05 32.59 20,023,567 910,162 717.1 October 09 22 36.99 34.68 31.61 24,712,766 1,123,308 883.6 November 09 21 32.69 31.25 29.94 28,840,416 1,373,353 915.7 December 09 22 32.49 31.44 30.06 18,876,303 858,014 592.5 January 10 20 35.60 33.77 31.50 26,043,209 1,302,160 897.0 February 10 20 34.42 32.30 30.21 28,993,315 1,449,666 965.4 March 10 23 37.26 36.02 34.00 25,692,743 1,117,076 934.0 April 10 20 40.30 38.03 35.68 32,236,386 1,611,819 1,254.0 May 10 21 40.27 37.59 34.88 40,489,850 1,928,088 1,567.1 June 10 22 39.79 38.13 36.13 33,249,672 1,511,349 1,307.0 July 10 22 37.75 35.71 33.87 29,954,505 1,361,568 1,129.2 August 10 22 37.93 35.41 32.98 18,720,169 850,917 674.8 September 10 22 37.42 36.18 33.17 22,588,390 1,026,745 834.5 October 10 21 38.65 37.44 36.37 21,131,876 1,006,280 803.9 November 10 22 37.75 34.39 32.26 32,487,917 1,476,724 1,116.6 December 10 23 35.91 34.56 32.32 19,834,456 862,368 679.5 January 11 21 38.00 36.29 34.02 25,910,260 1,233,822 936.3 February 11 20 43.39 40.21 36.69 28,241,416 1,412,071 1,143.7 March 11 23 43.29 40.80 37.65 26,701,250 1,160,924 1,084.4 *Average price weighted for trading volume. Source: Bloomberg Dividends paid by Cap Gemini Year ended December 31 Distribution of dividends Number of shares Dividend per share In millions In % of net income 2005 €66 47% 131,581,978 €0.50 2006 €101 34% 144,081,809 €0.70 2007 €145 33% 145,425,510 €1.00 2008 €146 33% 145,844,938 €1.00 2009 €123 69% 154,177,396 €0.80 2010 €156 56% 155,770,362 €1.00* * Recommended dividend submitted to the Annual Shareholders’ Meeting of May 26, 2011 31 2