- Page 1:
I s s u e N o . 5 2 , D e c e m b e
- Page 4 and 5:
This publication has been produced
- Page 6 and 7:
section 4. case studies in Africa 4
- Page 8 and 9:
vi ETFRN NEws 52: DEcEmbER 2010
- Page 10 and 11:
ETFRN NEws 52: DEcEmbER 2010 This s
- Page 12 and 13:
ETFRN NEws 52: DEcEmbER 2010 (lao p
- Page 14 and 15:
ETFRN NEws 52: DEcEmbER 2010 lumber
- Page 16 and 17:
Table 1. Estimated csM employment i
- Page 18 and 19:
ETFRN NEws 52: DEcEmbER 2010 Confli
- Page 20 and 21:
ETFRN NEws 52: DEcEmbER 2010 an alt
- Page 22 and 23:
ETFRN NEws 52: DEcEmbER 2010 This i
- Page 24 and 25:
ETFRN NEws 52: DEcEmbER 2010 that t
- Page 26 and 27:
Photo credits p.1 Processing sawn t
- Page 28 and 29:
ETFRN NEws 52: DEcEmbER 2010 This a
- Page 30 and 31:
Table 1. chainsaw mill and accessor
- Page 32 and 33:
ETFRN NEws 52: DEcEmbER 2010 chains
- Page 34 and 35:
10 ETFRN NEws 52: DEcEmbER 2010 usa
- Page 36 and 37:
12 ETFRN NEws 52: DEcEmbER 2010 wer
- Page 38 and 39:
Photo credits p.13 Remaining log an
- Page 40 and 41:
16 ETFRN NEws 52: DEcEmbER 2010 by
- Page 42 and 43:
18 ETFRN NEws 52: DEcEmbER 2010 som
- Page 44 and 45:
20 ETFRN NEws 52: DEcEmbER 2010 Tab
- Page 46 and 47:
22 ETFRN NEws 52: DEcEmbER 2010 End
- Page 48 and 49:
24 ETFRN NEws 52: DEcEmbER 2010 bef
- Page 50 and 51:
26 ETFRN NEws 52: DEcEmbER 2010 The
- Page 52 and 53:
28 ETFRN NEws 52: DEcEmbER 2010 how
- Page 54 and 55:
30 ETFRN NEws 52: DEcEmbER 2010 Ref
- Page 56 and 57:
32 ETFRN NEws 52: DEcEmbER 2010 The
- Page 58 and 59:
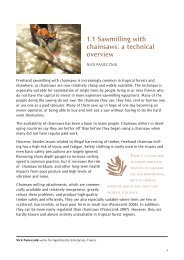
Chainsaw milling is a diversificati
- Page 60 and 61:
36 ETFRN NEws 52: DEcEmbER 2010 in
- Page 62 and 63:
38 ETFRN NEws 52: DEcEmbER 2010 2.4
- Page 64 and 65:
40 ETFRN NEws 52: DEcEmbER 2010 if
- Page 66 and 67:
42 ETFRN NEws 52: DEcEmbER 2010 2.5
- Page 68 and 69:
44 ETFRN NEws 52: DEcEmbER 2010 pro
- Page 70 and 71:
Table 1. inputs to financial model
- Page 72 and 73:
48 ETFRN NEws 52: DEcEmbER 2010 non
- Page 74 and 75:
50 ETFRN NEws 52: DEcEmbER 2010 2.6
- Page 76 and 77:
52 ETFRN NEws 52: DEcEmbER 2010 rem
- Page 78 and 79:
54 ETFRN NEws 52: DEcEmbER 2010 par
- Page 80 and 81:
56 ETFRN NEws 52: DEcEmbER 2010 con
- Page 82 and 83:
Photo credits p.57 Work on a CSM ag
- Page 84 and 85:
60 ETFRN NEws 52: DEcEmbER 2010 ind
- Page 86 and 87:
62 ETFRN NEws 52: DEcEmbER 2010 men
- Page 88 and 89:
64 ETFRN NEws 52: DEcEmbER 2010 low
- Page 90 and 91:
66 ETFRN NEws 52: DEcEmbER 2010 3.2
- Page 92 and 93:
68 ETFRN NEws 52: DEcEmbER 2010 in
- Page 94 and 95:
70 ETFRN NEws 52: DEcEmbER 2010 The
- Page 96 and 97:
72 ETFRN NEws 52: DEcEmbER 2010 3.3
- Page 98 and 99:
74 ETFRN NEws 52: DEcEmbER 2010 •
- Page 100 and 101:
76 ETFRN NEws 52: DEcEmbER 2010 •
- Page 102 and 103:
78 ETFRN NEws 52: DEcEmbER 2010 3.4
- Page 104 and 105:
80 ETFRN NEws 52: DEcEmbER 2010 nas
- Page 106 and 107:
82 ETFRN NEws 52: DEcEmbER 2010 tim
- Page 108 and 109:
84 ETFRN NEws 52: DEcEmbER 2010 Dif
- Page 110 and 111:
86 ETFRN NEws 52: DEcEmbER 2010 3.5
- Page 112 and 113:
88 ETFRN NEws 52: DEcEmbER 2010 Guy
- Page 114 and 115:
90 ETFRN NEws 52: DEcEmbER 2010 the
- Page 116 and 117:
Table 1. key facts about forestry i
- Page 118 and 119:
94 ETFRN NEws 52: DEcEmbER 2010 log
- Page 120 and 121:
96 ETFRN NEws 52: DEcEmbER 2010 pri
- Page 122 and 123:
98 ETFRN NEws 52: DEcEmbER 2010 3.7
- Page 124 and 125:
100 ETFRN NEws 52: DEcEmbER 2010 Ch
- Page 126 and 127:
102 ETFRN NEws 52: DEcEmbER 2010 mo
- Page 128 and 129:
104 ETFRN NEws 52: DEcEmbER 2010 co
- Page 130 and 131:
106 ETFRN NEws 52: DEcEmbER 2010 st
- Page 132 and 133:
108 ETFRN NEws 52: DEcEmbER 2010 in
- Page 134 and 135:
110 ETFRN NEws 52: DEcEmbER 2010 im
- Page 136 and 137:
112 ETFRN NEws 52: DEcEmbER 2010 Cs
- Page 138 and 139: 114 ETFRN NEws 52: DEcEmbER 2010 3.
- Page 140 and 141: 116 ETFRN NEws 52: DEcEmbER 2010 ar
- Page 142 and 143: 118 ETFRN NEws 52: DEcEmbER 2010 fr
- Page 144 and 145: 120 ETFRN NEws 52: DEcEmbER 2010 Ph
- Page 146 and 147: 122 ETFRN NEws 52: DEcEmbER 2010 ro
- Page 148 and 149: 124 ETFRN NEws 52: DEcEmbER 2010 Cs
- Page 150 and 151: 126 ETFRN NEws 52: DEcEmbER 2010 in
- Page 152 and 153: 128 ETFRN NEws 52: DEcEmbER 2010 an
- Page 154 and 155: 130 ETFRN NEws 52: DEcEmbER 2010 Th
- Page 156 and 157: Table 1. seasonality of the sawn ti
- Page 158 and 159: 134 ETFRN NEws 52: DEcEmbER 2010 pu
- Page 160 and 161: 136 ETFRN NEws 52: DEcEmbER 2010 st
- Page 162 and 163: 138 ETFRN NEws 52: DEcEmbER 2010 4.
- Page 164 and 165: 140 ETFRN NEws 52: DEcEmbER 2010 in
- Page 166 and 167: 142 ETFRN NEws 52: DEcEmbER 2010 co
- Page 168 and 169: 144 ETFRN NEws 52: DEcEmbER 2010 4.
- Page 170 and 171: 146 ETFRN NEws 52: DEcEmbER 2010 ch
- Page 172 and 173: 148 ETFRN NEws 52: DEcEmbER 2010 in
- Page 174 and 175: 150 ETFRN NEws 52: DEcEmbER 2010 4.
- Page 176 and 177: 152 ETFRN NEws 52: DEcEmbER 2010 in
- Page 178 and 179: 154 ETFRN NEws 52: DEcEmbER 2010 im
- Page 180 and 181: 156 ETFRN NEws 52: DEcEmbER 2010 th
- Page 182 and 183: 158 ETFRN NEws 52: DEcEmbER 2010 Re
- Page 184 and 185: 160 ETFRN NEws 52: DEcEmbER 2010 ha
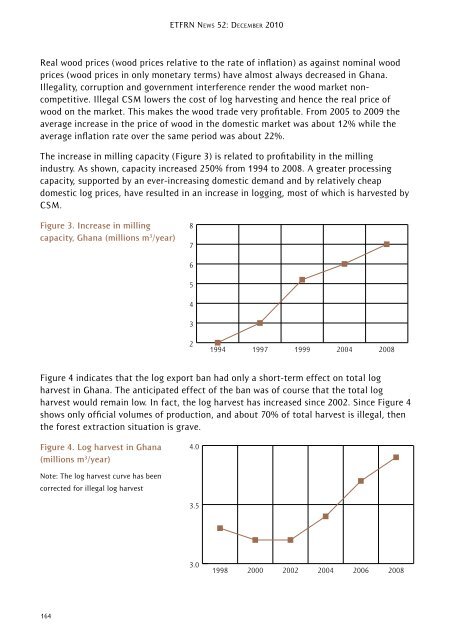
- Page 186 and 187: 162 ETFRN NEws 52: DEcEmbER 2010 Th
- Page 190 and 191: 166 ETFRN NEws 52: DEcEmbER 2010 4.
- Page 192 and 193: 168 ETFRN NEws 52: DEcEmbER 2010 Th
- Page 194 and 195: 170 ETFRN NEws 52: DEcEmbER 2010 To
- Page 196 and 197: 172 ETFRN NEws 52: DEcEmbER 2010
- Page 198 and 199: 174 ETFRN NEws 52: DEcEmbER 2010 4.
- Page 200 and 201: 176 ETFRN NEws 52: DEcEmbER 2010 Ra
- Page 202 and 203: 178 ETFRN NEws 52: DEcEmbER 2010
- Page 204 and 205: 180 ETFRN NEws 52: DEcEmbER 2010 of
- Page 206 and 207: 182 ETFRN NEws 52: DEcEmbER 2010 Th
- Page 208 and 209: 184 ETFRN NEws 52: DEcEmbER 2010 Fo
- Page 210 and 211: 186 ETFRN NEws 52: DEcEmbER 2010 sk
- Page 212 and 213: 188 ETFRN NEws 52: DEcEmbER 2010 4.
- Page 214 and 215: 190 ETFRN NEws 52: DEcEmbER 2010 ea
- Page 216 and 217: 192 ETFRN NEws 52: DEcEmbER 2010 co
- Page 218 and 219: 194 ETFRN NEws 52: DEcEmbER 2010 4.
- Page 220 and 221: 196 ETFRN NEws 52: DEcEmbER 2010 Fi
- Page 222 and 223: 198 ETFRN NEws 52: DEcEmbER 2010 pr
- Page 224 and 225: 200 ETFRN NEws 52: DEcEmbER 2010 sp
- Page 226 and 227: 202 ETFRN NEws 52: DEcEmbER 2010 En
- Page 228 and 229: Photo credits p.203 Chainsawn lumbe
- Page 230 and 231: ETFRN NEws 52: DEcEmbER 2010 forest
- Page 232 and 233: ETFRN NEws 52: DEcEmbER 2010 These
- Page 234 and 235: The main characteristics of each of
- Page 236 and 237: References 212 ETFRN NEws 52: DEcEm
- Page 238 and 239:
section 2. country studies from asi
- Page 240 and 241:
216 ETFRN NEws 52: DEcEmbER 2010 3.
- Page 242 and 243:
218 ETFRN NEws 52: DEcEmbER 2010 4.
- Page 244 and 245:
4.10 Ekeoba matthew isikhuemen 4.11
- Page 246 and 247:
country est. lumber production for
- Page 248 and 249:
country est. lumber production for
- Page 252:
Established in 1991, the European T