windsat retrieval of ocean surface wind speeds in tropical cyclones
windsat retrieval of ocean surface wind speeds in tropical cyclones
windsat retrieval of ocean surface wind speeds in tropical cyclones

Create successful ePaper yourself
Turn your PDF publications into a flip-book with our unique Google optimized e-Paper software.
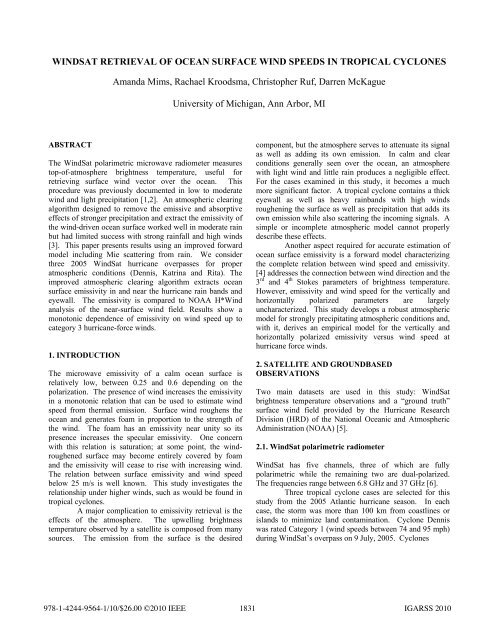
WINDSAT RETRIEVAL OF OCEAN SURFACE WIND SPEEDS IN TROPICAL CYCLONES<br />
Amanda Mims, Rachael Kroodsma, Christopher Ruf, Darren McKague<br />
University <strong>of</strong> Michigan, Ann Arbor, MI<br />
ABSTRACT<br />
The W<strong>in</strong>dSat polarimetric microwave radiometer measures<br />
top-<strong>of</strong>-atmosphere brightness temperature, useful for<br />
retriev<strong>in</strong>g <strong>surface</strong> <strong>w<strong>in</strong>d</strong> vector over the <strong>ocean</strong>. This<br />
procedure was previously documented <strong>in</strong> low to moderate<br />
<strong>w<strong>in</strong>d</strong> and light precipitation [1,2]. An atmospheric clear<strong>in</strong>g<br />
algorithm designed to remove the emissive and absorptive<br />
effects <strong>of</strong> stronger precipitation and extract the emissivity <strong>of</strong><br />
the <strong>w<strong>in</strong>d</strong>-driven <strong>ocean</strong> <strong>surface</strong> worked well <strong>in</strong> moderate ra<strong>in</strong><br />
but had limited success with strong ra<strong>in</strong>fall and high <strong>w<strong>in</strong>d</strong>s<br />
[3]. This paper presents results us<strong>in</strong>g an improved forward<br />
model <strong>in</strong>clud<strong>in</strong>g Mie scatter<strong>in</strong>g from ra<strong>in</strong>. We consider<br />
three 2005 W<strong>in</strong>dSat hurricane overpasses for proper<br />
atmospheric conditions (Dennis, Katr<strong>in</strong>a and Rita). The<br />
improved atmospheric clear<strong>in</strong>g algorithm extracts <strong>ocean</strong><br />
<strong>surface</strong> emissivity <strong>in</strong> and near the hurricane ra<strong>in</strong> bands and<br />
eyewall. The emissivity is compared to NOAA H*W<strong>in</strong>d<br />
analysis <strong>of</strong> the near-<strong>surface</strong> <strong>w<strong>in</strong>d</strong> field. Results show a<br />
monotonic dependence <strong>of</strong> emissivity on <strong>w<strong>in</strong>d</strong> speed up to<br />
category 3 hurricane-force <strong>w<strong>in</strong>d</strong>s.<br />
1. INTRODUCTION<br />
The microwave emissivity <strong>of</strong> a calm <strong>ocean</strong> <strong>surface</strong> is<br />
relatively low, between 0.25 and 0.6 depend<strong>in</strong>g on the<br />
polarization. The presence <strong>of</strong> <strong>w<strong>in</strong>d</strong> <strong>in</strong>creases the emissivity<br />
<strong>in</strong> a monotonic relation that can be used to estimate <strong>w<strong>in</strong>d</strong><br />
speed from thermal emission. Surface <strong>w<strong>in</strong>d</strong> roughens the<br />
<strong>ocean</strong> and generates foam <strong>in</strong> proportion to the strength <strong>of</strong><br />
the <strong>w<strong>in</strong>d</strong>. The foam has an emissivity near unity so its<br />
presence <strong>in</strong>creases the specular emissivity. One concern<br />
with this relation is saturation; at some po<strong>in</strong>t, the <strong>w<strong>in</strong>d</strong>roughened<br />
<strong>surface</strong> may become entirely covered by foam<br />
and the emissivity will cease to rise with <strong>in</strong>creas<strong>in</strong>g <strong>w<strong>in</strong>d</strong>.<br />
The relation between <strong>surface</strong> emissivity and <strong>w<strong>in</strong>d</strong> speed<br />
below 25 m/s is well known. This study <strong>in</strong>vestigates the<br />
relationship under higher <strong>w<strong>in</strong>d</strong>s, such as would be found <strong>in</strong><br />
<strong>tropical</strong> <strong>cyclones</strong>.<br />
A major complication to emissivity <strong>retrieval</strong> is the<br />
effects <strong>of</strong> the atmosphere. The upwell<strong>in</strong>g brightness<br />
temperature observed by a satellite is composed from many<br />
sources. The emission from the <strong>surface</strong> is the desired<br />
component, but the atmosphere serves to attenuate its signal<br />
as well as add<strong>in</strong>g its own emission. In calm and clear<br />
conditions generally seen over the <strong>ocean</strong>, an atmosphere<br />
with light <strong>w<strong>in</strong>d</strong> and little ra<strong>in</strong> produces a negligible effect.<br />
For the cases exam<strong>in</strong>ed <strong>in</strong> this study, it becomes a much<br />
more significant factor. A <strong>tropical</strong> cyclone conta<strong>in</strong>s a thick<br />
eyewall as well as heavy ra<strong>in</strong>bands with high <strong>w<strong>in</strong>d</strong>s<br />
roughen<strong>in</strong>g the <strong>surface</strong> as well as precipitation that adds its<br />
own emission while also scatter<strong>in</strong>g the <strong>in</strong>com<strong>in</strong>g signals. A<br />
simple or <strong>in</strong>complete atmospheric model cannot properly<br />
describe these effects.<br />
Another aspect required for accurate estimation <strong>of</strong><br />
<strong>ocean</strong> <strong>surface</strong> emissivity is a forward model characteriz<strong>in</strong>g<br />
the complete relation between <strong>w<strong>in</strong>d</strong> speed and emissivity.<br />
[4] addresses the connection between <strong>w<strong>in</strong>d</strong> direction and the<br />
3 rd and 4 th Stokes parameters <strong>of</strong> brightness temperature.<br />
However, emissivity and <strong>w<strong>in</strong>d</strong> speed for the vertically and<br />
horizontally polarized parameters are largely<br />
uncharacterized. This study develops a robust atmospheric<br />
model for strongly precipitat<strong>in</strong>g atmospheric conditions and,<br />
with it, derives an empirical model for the vertically and<br />
horizontally polarized emissivity versus <strong>w<strong>in</strong>d</strong> speed at<br />
hurricane force <strong>w<strong>in</strong>d</strong>s.<br />
2. SATELLITE AND GROUNDBASED<br />
OBSERVATIONS<br />
Two ma<strong>in</strong> datasets are used <strong>in</strong> this study: W<strong>in</strong>dSat<br />
brightness temperature observations and a “ground truth”<br />
<strong>surface</strong> <strong>w<strong>in</strong>d</strong> field provided by the Hurricane Research<br />
Division (HRD) <strong>of</strong> the National Oceanic and Atmospheric<br />
Adm<strong>in</strong>istration (NOAA) [5].<br />
2.1. W<strong>in</strong>dSat polarimetric radiometer<br />
W<strong>in</strong>dSat has five channels, three <strong>of</strong> which are fully<br />
polarimetric while the rema<strong>in</strong><strong>in</strong>g two are dual-polarized.<br />
The frequencies range between 6.8 GHz and 37 GHz [6].<br />
Three <strong>tropical</strong> cyclone cases are selected for this<br />
study from the 2005 Atlantic hurricane season. In each<br />
case, the storm was more than 100 km from coastl<strong>in</strong>es or<br />
islands to m<strong>in</strong>imize land contam<strong>in</strong>ation. Cyclone Dennis<br />
was rated Category 1 (<strong>w<strong>in</strong>d</strong> <strong>speeds</strong> between 74 and 95 mph)<br />
dur<strong>in</strong>g W<strong>in</strong>dSat’s overpass on 9 July, 2005. Cyclones<br />
978-1-4244-9564-1/10/$26.00 ©2010 IEEE 1831<br />
IGARSS 2010
Figure 1. W<strong>in</strong>dSat observations <strong>of</strong> Hurricane Katr<strong>in</strong>a <strong>in</strong><br />
Category 3 stage immediately before landfall. Data from 37<br />
GHz V-pol channel for optimal visualization.<br />
Katr<strong>in</strong>a and Rita were both Category 3 storms (<strong>w<strong>in</strong>d</strong>s<br />
between 111 and 130 mph) when observed on 28 August<br />
and 21 September, respectively. Figure 1 illustrates<br />
W<strong>in</strong>dSat’s 37 GHz v-pol observation <strong>of</strong> Katr<strong>in</strong>a dur<strong>in</strong>g the<br />
overpass.<br />
2.2. H*W<strong>in</strong>d analysis<br />
The NOAA-HRD <strong>w<strong>in</strong>d</strong> field analysis is used as “ground<br />
truth” for the <strong>surface</strong> <strong>w<strong>in</strong>d</strong>s. The analysis uses <strong>surface</strong> <strong>w<strong>in</strong>d</strong><br />
data collected with<strong>in</strong> a three to six hour <strong>w<strong>in</strong>d</strong>ow <strong>of</strong> the<br />
satellite overpass from various sources such as buoys, GPS<br />
dropsondes, ship observations and the plane-based Stepped<br />
Frequency Microwave Radiometer (SFMR), among others.<br />
The data are projected to a near <strong>surface</strong> level <strong>of</strong> 10 meters<br />
and then <strong>in</strong>terpolated l<strong>in</strong>early through the H*W<strong>in</strong>d<br />
algorithms to complete a <strong>w<strong>in</strong>d</strong> field representative <strong>of</strong> the<br />
entire cyclone. This approach allows for external quality<br />
control dur<strong>in</strong>g the analysis.<br />
The <strong>w<strong>in</strong>d</strong> field is not a perfect description <strong>of</strong> a<br />
cyclone’s <strong>surface</strong> <strong>w<strong>in</strong>d</strong> <strong>speeds</strong>. The observations are<br />
collected over a large time frame, which does not capture<br />
the quick variability <strong>in</strong> a storm’s <strong>w<strong>in</strong>d</strong> structure. Also, the<br />
averag<strong>in</strong>g necessary to complete the <strong>w<strong>in</strong>d</strong> field can decrease<br />
the result<strong>in</strong>g maximum <strong>w<strong>in</strong>d</strong>s from the true value, and can<br />
<strong>in</strong>troduce errors between 10% and 20% [7]. The analysis<br />
generated for the three cases used <strong>in</strong> this study were<br />
carefully constructed with abundant data samples to best<br />
reduce any errors.<br />
3. EMISSIVITY RETRIEVAL<br />
The <strong>surface</strong> emissivity <strong>retrieval</strong> process is based on the<br />
radiative transfer equation, <strong>of</strong> the form<br />
Figure 2. Integrated liquid water (mm) retrieved from<br />
Hurricane Katr<strong>in</strong>a for atmospheric absorption model.<br />
T B (f,p,) = (f,p,)T surf e -(f)sec + T up (f,)<br />
+ (T down (f,) + T cosmic e -(f)sec ) e -(f)sec (1)<br />
where f is the channel frequency <strong>in</strong> GHz, p is polarization<br />
and is the <strong>in</strong>cidence angle. represents the <strong>surface</strong><br />
emissivity, and is a functional comb<strong>in</strong>ation <strong>of</strong> the<br />
appropriate specular and rough <strong>surface</strong> values depend<strong>in</strong>g on<br />
the <strong>w<strong>in</strong>d</strong>. T surf is the temperature <strong>of</strong> the sea <strong>surface</strong> <strong>in</strong><br />
Kelv<strong>in</strong>. is the optical depth, and is the l<strong>in</strong>k to the<br />
atmospheric clear<strong>in</strong>g model. T up and T down are the upwell<strong>in</strong>g<br />
and downwell<strong>in</strong>g atmospheric brightness temperatures, both<br />
<strong>of</strong> which are latitude dependent and are <strong>in</strong> Kelv<strong>in</strong>. T cosmic is<br />
the background brightness temperature, aga<strong>in</strong> <strong>in</strong> Kelv<strong>in</strong>. <br />
is the <strong>surface</strong> reflectivity. This model was designed by [1],<br />
where<strong>in</strong> details for each parameter are given.<br />
The first atmospheric clear<strong>in</strong>g algorithm was<br />
developed by [3], and retrieves optical depth from the<br />
atmosphere-sensitive high frequency W<strong>in</strong>dSat observations<br />
us<strong>in</strong>g a absorption-based parameterization. The optical<br />
depth is directly related to column <strong>in</strong>tegrated water vapor<br />
(V, cm) and <strong>in</strong>tegrated ra<strong>in</strong> and cloud liquid water (L, mm)<br />
through the form<br />
(f) = c 0 (f) + c 1 (f)V + c 2 (f)L (2)<br />
whose coefficients are given <strong>in</strong> [3]. For this <strong>retrieval</strong>,<br />
<strong>surface</strong> emissivity must also be estimated and is considered<br />
dependent on <strong>w<strong>in</strong>d</strong> speed (W, m/s) alone through the<br />
function<br />
(W) = 0 + a 0 (1-exp[-a 1 W-a 2 W 2 ]) (3)<br />
as described <strong>in</strong> full by [3] and which is based on [8]. The<br />
three parameters (V and L as primary, W as secondary) are<br />
retrieved for the atmosphere by iterat<strong>in</strong>g Equation (1) until<br />
the modeled brightness temperatures have a root-meansquared<br />
(RMS) difference from the W<strong>in</strong>dSat brightness<br />
1832
Figure 3. Ra<strong>in</strong> rate (mm/hr) retrieved from Hurricane<br />
Katr<strong>in</strong>a for atmospheric model <strong>in</strong>clud<strong>in</strong>g absorption and<br />
scatter<strong>in</strong>g.<br />
temperatures at or below 3 K. The V and L estimations that<br />
satisfy this condition are then used to compute the optical<br />
depth that describes the atmospheric contribution <strong>in</strong> the<br />
<strong>surface</strong>-sensitive low frequency emissivity extraction.<br />
Us<strong>in</strong>g this scatter<strong>in</strong>g-free model, atmospheric<br />
clear<strong>in</strong>g was successful <strong>in</strong> most regions <strong>of</strong> the storm when<br />
the precipitation was not heavy enough to produce<br />
significant scatter<strong>in</strong>g. Figure 2 is an image <strong>of</strong> the retrieved<br />
liquid water for Hurricane Katr<strong>in</strong>a over the same grid as<br />
Figure 1. The ra<strong>in</strong>bands are correctly retrieved around the<br />
edges. The white gaps <strong>in</strong> the <strong>retrieval</strong> <strong>in</strong>dicate po<strong>in</strong>ts at<br />
which the RMS difference exceeded the 3 Kelv<strong>in</strong> threshold.<br />
Most <strong>of</strong> the dropouts are concentrated <strong>in</strong> the upper right<br />
portion <strong>of</strong> the figure, <strong>in</strong> the region <strong>of</strong> the storm’s eye. The<br />
eyewall is where both the heaviest precipitation and <strong>surface</strong><br />
<strong>w<strong>in</strong>d</strong>s exist.<br />
The addition <strong>of</strong> scatter<strong>in</strong>g to the forward model is<br />
implemented us<strong>in</strong>g Edd<strong>in</strong>gton’s second approximation with<br />
full Mie scatter<strong>in</strong>g from spherical hydrometers. The<br />
scatter<strong>in</strong>g signal is assumed to be dom<strong>in</strong>ated by liquid<br />
water, not ice, at W<strong>in</strong>dSat’s relatively low frequencies. A<br />
Sekhon and Srivastava [9] liquid drop size distribution is<br />
assumed. The atmospheric parameters retrieved is this case<br />
are ra<strong>in</strong> rate (RR, mm/hr) and <strong>in</strong>tegrated water vapor (V,<br />
cm), with <strong>w<strong>in</strong>d</strong> speed (W, m/s) as a secondary parameter<br />
from the <strong>surface</strong> emissivity forward model. Figure 3<br />
displays the retrieved ra<strong>in</strong> rate for the Katr<strong>in</strong>a overpass, with<br />
the data gaps (<strong>in</strong> white) represent<strong>in</strong>g the same RMS<br />
threshold as before. The scatter<strong>in</strong>g model provides<br />
significantly more data <strong>in</strong> the eyewall region with the most<br />
precipitation, but performs worse than the absorption-only<br />
model <strong>in</strong> areas where little or no scatter<strong>in</strong>g is present.<br />
The next step <strong>in</strong> the process is the <strong>surface</strong><br />
emissivity extraction. The <strong>surface</strong>-sensitive low frequency<br />
brightness temperatures are applied to Equation (1), which<br />
is rearranged to solve for emissivity. The optical depth<br />
Figure 4. Emissivity versus <strong>w<strong>in</strong>d</strong> speed for all three cyclone<br />
overpasses. The blue data is for Katr<strong>in</strong>a, the red for Rita<br />
and the green for Dennis. The plot only <strong>in</strong>cludes data with<br />
RMS residual error below 3 K, and where the model with<br />
the lowest RMS was selected for each po<strong>in</strong>t over the storms.<br />
calculated from the higher frequency observations removes<br />
the atmospheric attenuation. The emissivity is then<br />
collocated to the H*W<strong>in</strong>d analysis for comparison.<br />
4. SURFACE EMISSIVITY DEPENDENCE ON WIND<br />
SPEED<br />
Figure 4 compares <strong>w<strong>in</strong>d</strong> speed with <strong>surface</strong> emissivity at 6.8<br />
GHz for each <strong>of</strong> the three cyclone cases considered. The<br />
high <strong>w<strong>in</strong>d</strong> behavior <strong>of</strong> the emissivity appears to beg<strong>in</strong><br />
level<strong>in</strong>g out at the extreme end <strong>of</strong> the available data. This<br />
<strong>in</strong>dicates that the foam fraction may start to saturate above<br />
50 m/s (111 mph, Category 3 storm), but none <strong>of</strong> the test<br />
cases provided <strong>w<strong>in</strong>d</strong>s above that range.<br />
5. SUMMARY<br />
W<strong>in</strong>dSat overpasses <strong>of</strong> three Atlantic storms are chosen<br />
from the 2005 hurricane season (Dennis, Katr<strong>in</strong>a and Rita).<br />
They represent <strong>surface</strong> <strong>w<strong>in</strong>d</strong> <strong>speeds</strong> up to 70 m/s. Estimates<br />
<strong>of</strong> the microwave <strong>surface</strong> emissivity, derived from W<strong>in</strong>dSat<br />
TOA brightness temperatures, require a careful account<strong>in</strong>g<br />
for the effects <strong>of</strong> the <strong>in</strong>terven<strong>in</strong>g precipitat<strong>in</strong>g atmosphere.<br />
Previous attempts assumed a scatter<strong>in</strong>g-free atmosphere and<br />
were not successful <strong>in</strong> the high precipitation conditions near<br />
the hurricane core. An improved radiative transfer forward<br />
model that <strong>in</strong>cludes scatter<strong>in</strong>g by the hydrometeors has been<br />
presented. It markedly improved the ability to estimate the<br />
<strong>surface</strong> emissivity under heavy precipitation. Comparison<br />
<strong>of</strong> the W<strong>in</strong>dSat-derived emissivity with the ground truth<br />
<strong>w<strong>in</strong>d</strong> field provided by NOAA-HRD’s H*W<strong>in</strong>d algorithm<br />
results <strong>in</strong> a clear monotonic relationship that can be<br />
exploited by a <strong>surface</strong> <strong>w<strong>in</strong>d</strong> speed <strong>retrieval</strong> algorithm.<br />
1833
6. REFERENCES<br />
[1] S.T. Brown, C.S. Ruf, and D.R. Lyzenga, “An<br />
Emissivity-Based W<strong>in</strong>d Vector Retrieval Algorithm for the<br />
W<strong>in</strong>dSat Polarimetric Radiometer,” IEEE Trans. Geosci.<br />
Remote Sens, vol. 44, no. 3, pp. 611-621, Mar. 2006.<br />
[2] F.M. Monaldo, “Evaluation <strong>of</strong> W<strong>in</strong>dSat W<strong>in</strong>d Vector<br />
Performance With Respect to QuikScat Estimates,” IEEE<br />
Trans. Geosci. Remote Sens., vol. 44, no. 3, pp. 638-644,<br />
Mar. 2006.<br />
[3] C.S. Ruf, A.M. Mims, and C. Hennon, “The Dependence<br />
<strong>of</strong> the Microwave Emissivity <strong>of</strong> the Ocean on Hurricane<br />
Force W<strong>in</strong>d Speed,” Proc. 28th Conf. on Hurricanes and<br />
Tropical Meteo., Orlando, FL, 28 Apr-2 May 2008.<br />
[4] S. Yueh, “Polarimetric Microwave Remote Sens<strong>in</strong>g <strong>of</strong><br />
Hurricane Ocean W<strong>in</strong>ds,” Proc. IGARSS 2006, Denver, CO,<br />
Jul. 2006.<br />
[5] M.D. Powell, S.H. Houston, L.R. Amat, and N.<br />
Morisseau-Leroy, “The HRD Real-time Hurricane W<strong>in</strong>d<br />
Analysis System,” Journal <strong>of</strong> W<strong>in</strong>d Eng<strong>in</strong>eer<strong>in</strong>g and<br />
Industrial Aerodynamics, vol. 77-78, pp. 53-64, Sept. 1998.<br />
[6] P.W. Gaiser, K.M. St. Germa<strong>in</strong>, E.M. Twarog, G.A. Poe,<br />
W. Purdy, D. Richardson, W. Grossman, W.L. Jones, D.<br />
Spencer, G. Golba, J. Cleveland, L. Choy, R.M. Bevilacqua,<br />
and P.S. Change, “The W<strong>in</strong>dSat Polarimetric Spaceborne<br />
Microwave Radiometer: Sensor Description and Early Orbit<br />
Performance,” IEEE Trans. Geosci. Remote Sens., vol. 42,<br />
no. 11, pp. 2347-2361, Nov. 2004.<br />
[7] S.H. Houston, W.A. Shaffer, M.D. Powell, and J. Chen,<br />
“Comparisons <strong>of</strong> HRD and SLOSH Surface W<strong>in</strong>d Fields <strong>in</strong><br />
Hurricanes: Implications for Storm Surge Model<strong>in</strong>g,”<br />
Weather and Forecast<strong>in</strong>g, vol. 14, no. 5, pp. 671-686, Oct.<br />
1999.<br />
[8] T.T. Wilheit, “A Model for the Microwave Emissivity <strong>of</strong><br />
the Ocean’s Surface as a Function <strong>of</strong> W<strong>in</strong>d Speed,” IEEE<br />
Trans. Geosci. Remote Sens., vol. GE-17, no. 4, pp. 244-<br />
249, Oct. 1979.<br />
[9] R.S. Sekhon and R.C. Srivastava, “Doppler Radar<br />
Observations <strong>of</strong> Drop-Size Distributions <strong>in</strong> a<br />
Thunderstorm,” Journal <strong>of</strong> the Atmospheric Sciences, vol.<br />
28, no. 6, pp. 983-994, Sept. 1971.<br />
1834