Department of Heavy Industry Ministry of Heavy Industries & Public ...
Department of Heavy Industry Ministry of Heavy Industries & Public ...
Department of Heavy Industry Ministry of Heavy Industries & Public ...

Create successful ePaper yourself
Turn your PDF publications into a flip-book with our unique Google optimized e-Paper software.
Recommendations for 12 th Five Year Plan for Capital Goods & Engineering Sector 19<br />
2. Overall Assessment <strong>of</strong> Capital Goods & Engineering Sector<br />
Industrial, Investment, Foreign Collaboration and Trade Policy in respect <strong>of</strong><br />
Capital Goods & Engineering Sector<br />
As the capital goods & engineering sector falls under delicensed category; no<br />
industrial license is required. Industrial Entrepreneur Memoranda (IEM) is<br />
required to be filed to undertake the manufacturing activity.<br />
FDI up to 100% permitted on automatic route (through RBI).<br />
Quantum <strong>of</strong> payment for technology transfer, design & drawing, royalty etc.<br />
to the foreign collaborator has no limit<br />
Import and export <strong>of</strong> capital goods & engineering items including import <strong>of</strong><br />
second hand capital goods is allowed freely.<br />
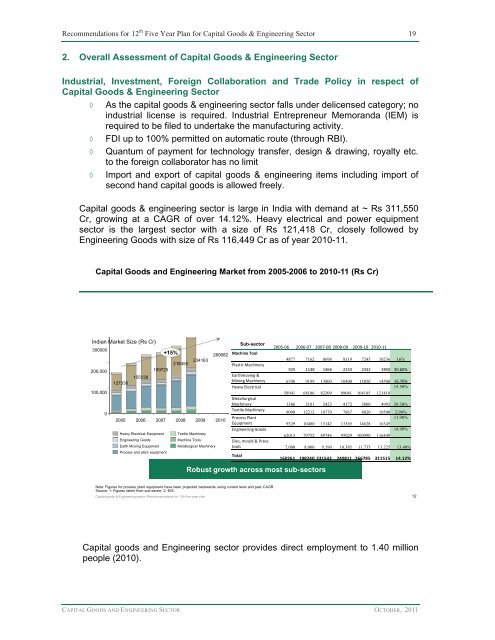
Capital goods & engineering sector is large in India with demand at ~ Rs 311,550<br />
Cr, growing at a CAGR <strong>of</strong> over 14.12%. <strong>Heavy</strong> electrical and power equipment<br />
sector is the largest sector with a size <strong>of</strong> Rs 121,418 Cr, closely followed by<br />
Engineering Goods with size <strong>of</strong> Rs 116,449 Cr as <strong>of</strong> year 2010-11.<br />
Capital Goods and Engineering Market from 2005-2006 to 2010-11 (Rs Cr)<br />
Indian Market Size (Rs Cr)<br />
Sub-sector<br />
300000<br />
+15%<br />
260682 Machine Tool<br />
2005-06 2006-07 2007-08 2008-09 2009-10 2010-11<br />
234163<br />
4877 7162 8698 8319 7245 10236 16%<br />
218450<br />
Plastic Machinery<br />
200,000<br />
189725<br />
925 1148 1466 2233 2332 3850 30.60%<br />
155138<br />
Earthmoving &<br />
127330<br />
Mining Machinery 6700 9199 13800 10400 13850 14500 16.70%<br />
<strong>Heavy</strong> Electrical<br />
15.50%<br />
100,000<br />
58941 68106 82309 89041 104185 121418<br />
Metallurgical<br />
Machinery 1386 2181 2423 4172 3800 4992 29.30%<br />
Textile Machinery<br />
0<br />
9090 12212 10770 7867 8020 10500 2.90%<br />
Process Plant<br />
11.90%<br />
2005 2006 2007 2008 2009 2010<br />
Equipment 9329 10480 13142 13365 14628 16345<br />
Engineering Goods<br />
14.90%<br />
<strong>Heavy</strong> Electrical Equipment Textile Machinery<br />
62013 79752 89744 95029 100990 116449<br />
Engineering Goods<br />
Machine Tools<br />
Dies, mould & Press<br />
Earth Moving Equipment<br />
Metallurgical Machinery tools 7,000 8,000 9,190 10,385 11,735 13,225 13.40%<br />
Process and plant equipment<br />
Total<br />
160261 198240 231542 240811 266785 311515 14.12%<br />
Robust growth across most sub-sectors<br />
Note: Figures for process plant equipment have been projected backwards using current level and past CAGR<br />
Source: 1: Figures taken from sub-sector; 2: EIS;<br />
Capital goods & Engineering sector- Recommendations for 12th five year plan 12<br />
Capital goods and Engineering sector provides direct employment to 1.40 million<br />
people (2010).<br />
CAPITAL GOODS AND ENGINEERING SECTOR OCTOBER, 2011