Department of Heavy Industry Ministry of Heavy Industries & Public ...
Department of Heavy Industry Ministry of Heavy Industries & Public ...
Department of Heavy Industry Ministry of Heavy Industries & Public ...

Create successful ePaper yourself
Turn your PDF publications into a flip-book with our unique Google optimized e-Paper software.
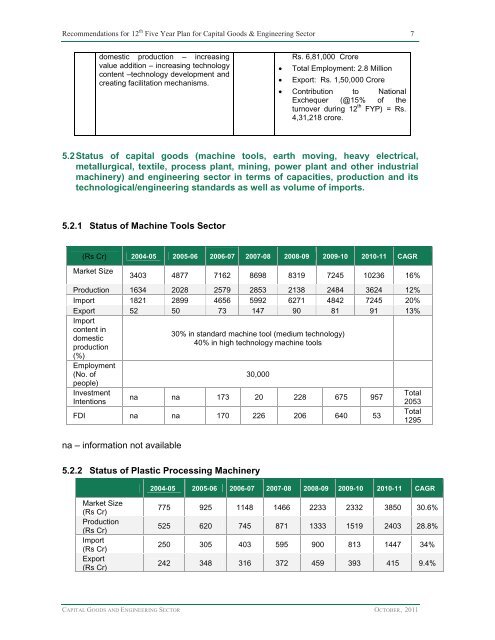
Recommendations for 12 th Five Year Plan for Capital Goods & Engineering Sector 7<br />
domestic production – increasing<br />
value addition – increasing technology<br />
content –technology development and<br />
creating facilitation mechanisms.<br />
Rs. 6,81,000 Crore<br />
Total Employment: 2.8 Million<br />
Export: Rs. 1,50,000 Crore<br />
Contribution to National<br />
Exchequer (@15% <strong>of</strong> the<br />
turnover during 12 th FYP) = Rs.<br />
4,31,218 crore.<br />
5.2Status <strong>of</strong> capital goods (machine tools, earth moving, heavy electrical,<br />
metallurgical, textile, process plant, mining, power plant and other industrial<br />
machinery) and engineering sector in terms <strong>of</strong> capacities, production and its<br />
technological/engineering standards as well as volume <strong>of</strong> imports.<br />
5.2.1 Status <strong>of</strong> Machine Tools Sector<br />
(Rs Cr) 2004-05 2005-06 2006-07 2007-08 2008-09 2009-10 2010-11 CAGR<br />
Market Size<br />
3403 4877 7162 8698 8319 7245 10236 16%<br />
Production 1634 2028 2579 2853 2138 2484 3624 12%<br />
Import 1821 2899 4656 5992 6271 4842 7245 20%<br />
Export 52 50 73 147 90 81 91 13%<br />
Import<br />
content in<br />
domestic<br />
production<br />
(%)<br />
Employment<br />
(No. <strong>of</strong><br />
people)<br />
Investment<br />
Intentions<br />
30% in standard machine tool (medium technology)<br />
40% in high technology machine tools<br />
30,000<br />
na na 173 20 228 675 957<br />
FDI na na 170 226 206 640 53<br />
Total<br />
2053<br />
Total<br />
1295<br />
na – information not available<br />
5.2.2 Status <strong>of</strong> Plastic Processing Machinery<br />
2004-05 2005-06 2006-07 2007-08 2008-09 2009-10 2010-11 CAGR<br />
Market Size<br />
(Rs Cr)<br />
Production<br />
(Rs Cr)<br />
Import<br />
(Rs Cr)<br />
Export<br />
(Rs Cr)<br />
775 925 1148 1466 2233 2332 3850 30.6%<br />
525 620 745 871 1333 1519 2403 28.8%<br />
250 305 403 595 900 813 1447 34%<br />
242 348 316 372 459 393 415 9.4%<br />
CAPITAL GOODS AND ENGINEERING SECTOR OCTOBER, 2011