Economic Development Data Analysis and Assessment
Economic Development Data Analysis and Assessment
Economic Development Data Analysis and Assessment

Create successful ePaper yourself
Turn your PDF publications into a flip-book with our unique Google optimized e-Paper software.
1.1.7 The <strong>Analysis</strong>: Diversity<br />
Diversity includes measures that relate to the overall<br />
economic, social <strong>and</strong> cultural diversity of a location.<br />
<strong>Economic</strong>, demographic <strong>and</strong> cultural diversity<br />
has strong associations with economic growth,<br />
performance <strong>and</strong> sustainability. Diversity in a<br />
population <strong>and</strong> economy helps to generate new<br />
ideas, perspectives, <strong>and</strong> innovation. Therefore,<br />
even though traditional business rankings pay little<br />
attention to diversity measures (as demonstrated<br />
by the fact that the CFED ranking is the only one<br />
we analyzed with any real diversity measures), it is<br />
nevertheless critical for states to consider. PolicyLink,<br />
a national research <strong>and</strong> action institute, was<br />
conducting a more detailed examination of diversity<br />
in Rhode Isl<strong>and</strong> as FEC was developing this business<br />
climate study, but we have also highlighted a few key<br />
diversity measures.<br />
What’s Holding Rhode Isl<strong>and</strong> Back?<br />
Rhode Isl<strong>and</strong> generally ranks low in key diversity<br />
measures, such as Four-Year Degrees by Race,<br />
Unemployment by Race, <strong>and</strong> Homeownership<br />
by Race, i.e. there is a greater disparity between<br />
non-Hispanic whites <strong>and</strong> people of color in rates<br />
of educational attainment, employment, <strong>and</strong><br />
homeownership. This is most likely a function of its<br />
overall demographic structure. Rhode Isl<strong>and</strong> has a<br />
higher percentage of non-Hispanic White residents<br />
(76 percent) as compared to the U.S. average (64<br />
percent). While low rankings in measures related to<br />
diversity are not a direct indicator of failing policies<br />
or a lack of a welcoming environment, they should<br />
be examined closely to determine if there are any<br />
conditions or policies creating unintentional barriers<br />
to the State performing higher in these areas. This<br />
is especially important given the shifting dynamic of<br />
Rhode Isl<strong>and</strong>’s demographics, according to research<br />
done by PolicyLink. Over the last 30 years, the<br />
percentage of Rhode Isl<strong>and</strong> residents of color has<br />
increased from seven to 24 percent. In just the last<br />
decade, Rhode Isl<strong>and</strong>’s Latino population grew 44<br />
percent, the Asian population grew 28 percent, <strong>and</strong><br />
the African American population grew 23 percent.<br />
Meanwhile, the non-Hispanic white population<br />
declined by six percent.<br />
The Upside<br />
Rhode Isl<strong>and</strong> scored in the mid quintile for Business<br />
Value by Gender <strong>and</strong> Business Ownership by Race.<br />
The Beacon Hill Institute (BHI) also ranked Rhode<br />
Isl<strong>and</strong> 21st for Openness, which it defines as “a<br />
measure of how connected the firms <strong>and</strong> people<br />
in the state are to the rest of world.” BHI based<br />
this measure on the level of exports as well as the<br />
percent of population born abroad. Each of these<br />
key diversity measures present Rhode Isl<strong>and</strong> with a<br />
solid core upon which to build.<br />
Furthermore, Rhode Isl<strong>and</strong> has experienced income<br />
gains for all levels of earners. Whereas nationally,<br />
the bottom half of earners have actually experienced<br />
wage decreases over the past three decades, Rhode<br />
Isl<strong>and</strong>ers’ wages have been increasing. This has<br />
contributed to Rhode Isl<strong>and</strong>’s lower than average<br />
income inequality <strong>and</strong> poverty rates.<br />
+<br />
“We need to pay particular attention to minority-owned businesses.<br />
Immigrant populations especially are often very entrepreneurial but<br />
have higher barriers to start-up to include language skills <strong>and</strong> business<br />
planning.”<br />
#<br />
Rank Resource Rank of Rhode Isl<strong>and</strong><br />
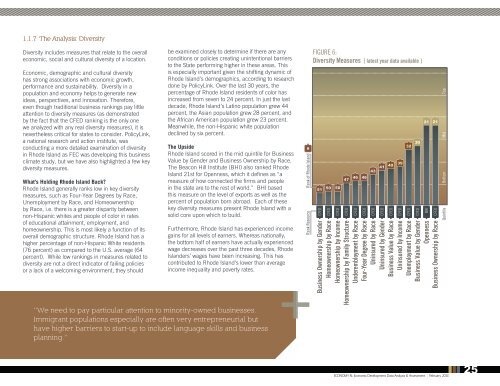
FIGURE 6:<br />
Diversity Measures [ latest year data available ]<br />
Diversity Measures [latest year data available]<br />
51<br />
50 50<br />
Business Ownership by Gender CFED<br />
47 46 46 43<br />
21 21<br />
32 30<br />
41 40 39<br />
Homeownership by Race CFED<br />
Homeownership by Income CFED<br />
Homeownership by Family Structure CFED<br />
Underembloyment by Race CFED<br />
Four-Year Degree by Race CFED<br />
Uninsured by Race CFED<br />
Uninsured by Gender CFED<br />
Business Value by Race CFED<br />
Uninsured by Income CFED<br />
Unemployment by Race CFED<br />
Business Value by Gender CFED<br />
Openness BHI<br />
Business Ownership by Race CFED BHI<br />
Bottom Mid Top<br />
Quintile<br />
ECONOMY RI: <strong>Economic</strong> <strong>Development</strong> <strong>Data</strong> <strong>Analysis</strong> & <strong>Assessment</strong> | February 2013<br />
25