Transportation 2035 - State of Rhode Island: Division of Planning
Transportation 2035 - State of Rhode Island: Division of Planning
Transportation 2035 - State of Rhode Island: Division of Planning

You also want an ePaper? Increase the reach of your titles
YUMPU automatically turns print PDFs into web optimized ePapers that Google loves.
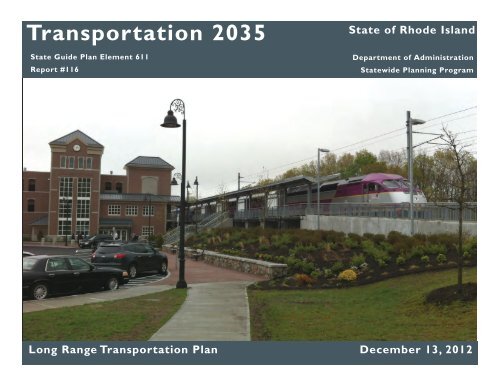
<strong>Transportation</strong> <strong>2035</strong><strong>State</strong> Guide Plan Element 611Report #116<strong>State</strong> <strong>of</strong> <strong>Rhode</strong> <strong>Island</strong>Department <strong>of</strong> Administration<strong>State</strong>wide <strong>Planning</strong> ProgramLong Range <strong>Transportation</strong> Plan December 13, 2012
December 2012TITLE VI – NONDISCRIMINATION POLICY & UNLAWFUL COMPLAINT PROCESSThe Office <strong>of</strong> <strong>State</strong>wide <strong>Planning</strong>, <strong>Division</strong> <strong>of</strong> <strong>Planning</strong>, <strong>Rhode</strong> <strong>Island</strong> Department <strong>of</strong> Administration hereby gives public notice that it is the policy <strong>of</strong> thedepartment to ensure full compliance with Title VI <strong>of</strong> the Civil Rights Act <strong>of</strong> 1964, the Civil Rights Restoration Act <strong>of</strong> 1987 Executive Order 12898 onEnvironmental Justice, and related statutes and regulations in all programs and activities. Title VI requires that no person in the United <strong>State</strong>s <strong>of</strong> America shall,on the grounds <strong>of</strong> race, color, sex, or national origin be excluded from the participation in, be denied the benefits <strong>of</strong>, or be otherwise subjected todiscrimination under any program or activity for which the Office <strong>of</strong> <strong>State</strong>wide <strong>Planning</strong> receives federal financial assistance.Any person who believes he or she has been aggrieved by an unlawful discriminatory practice under Title VI has a right to file a formal complaint with theOffice <strong>of</strong> <strong>State</strong>wide <strong>Planning</strong>. Any such complaint must be in writing and filed with the <strong>State</strong>wide <strong>Planning</strong> Title VI Coordinator within one hundred eighty (180)days following the date <strong>of</strong> the alleged discriminatory occurrence. Title VI Discrimination Complaint Forms may be obtained from RI <strong>State</strong>wide <strong>Planning</strong> at nocost to the complainant by calling Michael C. Moan, the Title VI Coordinator at (401) 222-1236 or at http://www.planning.ri.gov/statewideplanning/transportation/<strong>Transportation</strong> <strong>2035</strong> (2012 Update)<strong>State</strong> Guide Plan Element 611<strong>Rhode</strong> <strong>Island</strong> <strong>State</strong>wide <strong>Planning</strong> Programii
December 2012ABSTRACTTITLE: <strong>Transportation</strong> <strong>2035</strong>: <strong>State</strong> Guide Plan Element 611SUBJECT: <strong>State</strong>wide, long-range surface transportation planDATE: December 13, 2012AGENCY AND <strong>State</strong>wide <strong>Planning</strong> ProgramSOURCE OF <strong>Rhode</strong> <strong>Island</strong> Department <strong>of</strong> AdministrationCOPIES: One Capitol Hill, Providence, RI 02908REPORT NUMBER: 112ABSTRACT: This plan addresses <strong>Rhode</strong> <strong>Island</strong>’s transportation needs over the next twenty plus years. This limited plan update is based on public participation,as well as federal and state agency collaboration. The Plan has been prepared to ensure compliance with the Safe Accountable Flexible and Efficient<strong>Transportation</strong> Equity Act: A Legacy for Users (SAFETEA-LU) <strong>of</strong> 2005. The scope <strong>of</strong> the plan includes surface transportation for both passengers and freight, andconnections to other modes. Revisions from the 2008 Plan include 2010 MPO recertification recommendations, demographic and travel trends, transportationfinancing, air quality analysis, detailed mapping for environmental justice analysis, and an updated Congestion Management Process.<strong>Transportation</strong> <strong>2035</strong> (2012 Update)<strong>State</strong> Guide Plan Element 611<strong>Rhode</strong> <strong>Island</strong> <strong>State</strong>wide <strong>Planning</strong> Programiii
December 2012PREFACEThis plan, <strong>Transportation</strong> <strong>2035</strong> has two main purposes:• It is a key element <strong>of</strong> the <strong>State</strong> Guide Plan, setting direction for state transportation policy and action. It complements elements dealing with land use,economic development, greenspace and greenways, and other related topics. It provides a framework with which local comprehensive plans must beconsistent.• It fulfills federal transportation planning requirements for statewide and metropolitan planning by providing a forum for public input, providesdirection to the <strong>Transportation</strong> Improvement Program’s (TIP) list <strong>of</strong> funded projects, and provides a basis for measuring adherence to air qualitystandards.The Plan contains goals, policies, objectives and strategies for <strong>Rhode</strong> <strong>Island</strong>’s transportation system over the next twenty plus years.This Plan was prepared through the efforts <strong>of</strong> the <strong>Transportation</strong> Advisory Committee, Technical Committee, and <strong>State</strong> <strong>Planning</strong> Council whose members arelisted on the subsequent pages, and staff from the <strong>State</strong>wide <strong>Planning</strong> Program, Department <strong>of</strong> <strong>Transportation</strong>, and the <strong>Rhode</strong> <strong>Island</strong> Public Transit Authority.The air quality conformity analysis performed for <strong>Transportation</strong> <strong>2035</strong> was conducted by the consulting firm <strong>of</strong> Vanasse, Hangen, Brustlin, Inc., under contractto the <strong>State</strong>wide <strong>Planning</strong> Program. Federal funding support was provided by the Federal Highway Administration and Federal Transit Administration.<strong>Transportation</strong> <strong>2035</strong> (2012 Update)<strong>State</strong> Guide Plan Element 611<strong>Rhode</strong> <strong>Island</strong> <strong>State</strong>wide <strong>Planning</strong> Programiv
December 2012ACKNOWLEDGEMENTSTRANSPORTATION ADVISORY COMMITTEEFrances Shocket, Chair, Public Member, JamestownSue Barker, Greenways AllianceDaniel Baudouin, The Providence FoundationCorey Bobba, Federal Highway Administration (non-voting)Alan Brodd, Town <strong>of</strong> CumberlandMark Carruolo, City <strong>of</strong> WarwickMichael Cassidy, Public Member, PawtucketRussell Chateauneuf, RI Department <strong>of</strong> Environmental ManagementElaine Colarusso, Town <strong>of</strong> East GreenwichDr. Judith Drew, Governor’s Commission on DisabilitiesDavid Everett, City <strong>of</strong> ProvidenceGeorge Monaghan, RI Consulting EngineersPaul Romano, Public Member, BristolBarry Schiller, Sierra Club, RI ChapterRobert Shawver, RI Department <strong>of</strong> <strong>Transportation</strong>Henry Sherlock, Construction Industries <strong>of</strong> RIJane Sherman, Public Member, ProvidencePam Sherrill, American <strong>Planning</strong> Association, RI ChapterDinalyn Spears, Narragansett Indian TribeEverett Stuart, RI Association <strong>of</strong> Railroad PassengersMark Therrien, RI Public Transit AuthorityDr. Robert Vanderslice, RI Department <strong>of</strong> HealthMichael Walker, RI Economic Development CorporationMichael Wood, Town <strong>of</strong> BurrillvilleDaniel Porter, RI Airport Corporation<strong>Transportation</strong> <strong>2035</strong> (2012 Update)<strong>State</strong> Guide Plan Element 611<strong>Rhode</strong> <strong>Island</strong> <strong>State</strong>wide <strong>Planning</strong> Programv
December 2012TECHNICAL COMMITTEERobert Azar (Chair), City <strong>of</strong> ProvidenceEugenia Marks, Audubon Society <strong>of</strong> <strong>Rhode</strong> <strong>Island</strong>Michael DeLuca, (Vice Chair)Local Government, NarragansettJason Pezzullo, American <strong>Planning</strong> Association, RI ChapterJared <strong>Rhode</strong>s, (Secretary) <strong>State</strong>wide <strong>Planning</strong>Fred Presley, Local Government, West WarwickCorey Bobba, Federal Highway (Advisory)Jonathan Reiner, Local Government, North KingstownLisa Bourbannais, Local Government, East GreenwichChris Spencer, Local Government, TivertonDr. Ames Colt, RI Department <strong>of</strong> Environmental ManagementDr. Robert Vanderslice, RI Department <strong>of</strong> HealthStephen Devine, RI Department <strong>of</strong> <strong>Transportation</strong>Michael Walker, RI Economic Development CorporationTina Dolan, Aquidneck <strong>Island</strong> <strong>Planning</strong> CommissionJeffrey Willis, RI Coastal Resources Management CouncilThomas Kogut, RI Public Utilities CommissionRon Wolanski, Local Government, MiddletownDr. Patrick Malone, Brown University<strong>Transportation</strong> <strong>2035</strong> (2012 Update)<strong>State</strong> Guide Plan Element 611<strong>Rhode</strong> <strong>Island</strong> <strong>State</strong>wide <strong>Planning</strong> Programvi
December 2012STATE PLANNING COUNCILRichard Licht, (Chair) Director, Department <strong>of</strong> AdministrationMichael Lewis, Director, RI Department <strong>of</strong> <strong>Transportation</strong>Kelly Mahoney, (Vice Chair) Governor’s Policy OfficeThomas Mullaney, <strong>State</strong> Budget Officer, Department <strong>of</strong> AdministrationKevin Flynn, (Secretary) Associate Director, <strong>Division</strong> <strong>of</strong> <strong>Planning</strong>L. Vincent Murray, RI League <strong>of</strong> Cities and Towns, Local GovernmentRepresentativeRobert Azar, Acting Director, Providence Department <strong>of</strong> <strong>Planning</strong> andDevelopmentAnna Prager, Public MemberDaniel Beardsley, Executive Director, RI League <strong>of</strong> Cities and TownsJanet White Raymond, Public MemberJeanne Boyle, RI League <strong>of</strong> Cities and Towns, President’s DesigneeWilliam Sequino, Public MemberStephen Cardi, Esq., Public MemberSamuel J. Shamoon, Governor’s DesigneeJanet Coit, Director, RI Department <strong>of</strong> Environmental ManagementJohn Trevor, Environmental AdvocateJeanne Cola, Chair, Housing Resources CommissionSharon Conard Wells, Nonpr<strong>of</strong>it Community Development/HousingRepresentativeMichael Fine, Director, RI Department <strong>of</strong> HealthScott Wolf, Environmental Advocate, Grow Smart RIWilliam J. Parsons, Deputy Director, RI Economic DevelopmentCorporation<strong>Transportation</strong> <strong>2035</strong> (2012 Update)<strong>State</strong> Guide Plan Element 611<strong>Rhode</strong> <strong>Island</strong> <strong>State</strong>wide <strong>Planning</strong> Programvii
December 2012AIR QUALITY TRANSPORTATION SUBCOMMITTEEFrank Stevenson (Chair), RI Department <strong>of</strong> Environmental ManagementSteven Musen, RI Association <strong>of</strong> Railroad PassengersLinsey Callaghan, (Secretary) RI <strong>State</strong>wide <strong>Planning</strong> ProgramJacinda Russell, Federal Highway AdministrationMolly Clark, American Lung Association <strong>of</strong> RIRobert Shawver, RI Department <strong>of</strong> <strong>Transportation</strong>Abel Collins, <strong>Rhode</strong> <strong>Island</strong> Sierra ClubMary Shepard, Public MemberDonald Cooke, US Environmental Protection AgencyMark Therrien, RI Public Transit AuthorityStephen Devine, RI Department <strong>of</strong> <strong>Transportation</strong>Dr. Robert Vanderslice, RI Department <strong>of</strong> HealthWilliam Gordon, Federal Transit Administration<strong>Transportation</strong> <strong>2035</strong> (2012 Update)<strong>State</strong> Guide Plan Element 611<strong>Rhode</strong> <strong>Island</strong> <strong>State</strong>wide <strong>Planning</strong> Programviii
December 2012RI STATEWIDE PLANNING PROGRAMRichard Licht, Director, Department <strong>of</strong> AdministrationKevin Flynn, Associate Director, <strong>Division</strong> <strong>of</strong> <strong>Planning</strong>Jared <strong>Rhode</strong>s, Chief, <strong>State</strong>wide <strong>Planning</strong>Karen Scott, Assistant ChiefLinsey Callaghan, Supervising PlannerVincent Flood, Supervising PlannerAmanda Martin, Principal PlannerMichael Moan, Principal PlannerRonnie Sirota, Principal PlannerWalter Slocomb, Principal PlannerDawn Vittorioso, Executive AssistantRI DEPARTMENT OF TRANSPORTATIONMichael Lewis, DirectorRobert Shawver, Administrator, <strong>Planning</strong> and FinancePaul Annarummo, Administrator, Highway and Bridge MaintenanceDiane Badorek, Chief Civil EngineerMeredith Brady, Department Budget ManagerDavid Capalbo, Principal Civil EngineerSteve Church, <strong>State</strong> Bicycle/Pedestrian Program CoordinatorStephen Devine, Chief, Intermodal <strong>Planning</strong>David Fish, Managing EngineerHeidi Gudmundson, Programming Services Officer, CommunicationsVincent Palumbo, Managing EngineerThomas Queenan, Chief, Program DevelopmentRobert Rocchio, Managing EngineerRobert Smith, Deputy Chief EngineerAmy Thibeault, Supervising PlannerLambri Zerva, Supervising Engineer<strong>Transportation</strong> <strong>2035</strong> (2012 Update)<strong>State</strong> Guide Plan Element 611<strong>Rhode</strong> <strong>Island</strong> <strong>State</strong>wide <strong>Planning</strong> Programix
December 2012RI PUBLIC TRANSIT AUTHORITYCharles Odimgbe, CEOMark Therrien, Assistant General ManagerLillian Shuey Picchione, Director, Federal Programs & Capital DevelopmentAnne LeClerc, Principal PlannerRI DEPARTMENT OF ENVIRONMENTAL MANAGEMENTJanet Coit, DirectorDoug McVay, Acting Chief, Office <strong>of</strong> Air ResourcesFrank Stevenson, Supervising Air Quality SpecialistRonald Marcaccio, Principal Air Quality SpecialistFEDERAL HIGHWAY ADMINISTRATIONDaniel Berman, RI <strong>Division</strong> Administrator ActingBarbara Breslin, Program Development Team LeaderUS ENVIRONMENTAL PROTECTION AGENCYDonald Cooke, Environmental Scientist, Air Quality UnitAriel Garcia, Environmental Engineer, Air Quality UnitCorey Bobba, Program Development Team LeaderFEDERAL TRANSIT ADMINISTRATIONWilliam Gordon, Community Planner<strong>Transportation</strong> <strong>2035</strong> (2012 Update)<strong>State</strong> Guide Plan Element 611<strong>Rhode</strong> <strong>Island</strong> <strong>State</strong>wide <strong>Planning</strong> Programx
TABLE OF CONTENTSDecember 2012<strong>Rhode</strong> <strong>Island</strong> <strong>State</strong>wide <strong>Planning</strong> ProgramTitle VI – Nondiscrimination Policy & Unlawful Complain ProcessAbstractPrefaceAcknowledgementsTable <strong>of</strong> ContentsiiiiiiivvxiPart One: Introduction and Background 1-1Introduction 1-1Vision <strong>State</strong>ment 1-1Regional Context 1-1Organization for <strong>Transportation</strong> <strong>Planning</strong> 1-2Plan Approval Process 1-3Purposes <strong>of</strong> the Plan 1-3Scope <strong>of</strong> the Plan 1-3Surface <strong>Transportation</strong> Plan 1-32012 Update: <strong>Transportation</strong> <strong>2035</strong> Scope 1-4Background for the Plan Update 1-6Performance Assessment <strong>of</strong> 2004 Long Range Plan 1-6SAFETEA-LU <strong>Planning</strong> Requirements 1-102010 MPO Recertification Recommendations 1-12<strong>State</strong> <strong>Planning</strong> Activities 1-14USDOT Strategic Goals 1-17Demographic and Travel Trends 1-21Demographic Trends 1-24Travel Trends 1-24Part Two: <strong>Transportation</strong> System and Needs Assessment 2-1Inventory <strong>of</strong> Facilities 2-1<strong>Transportation</strong> <strong>2035</strong> (2012 Update)<strong>State</strong> Guide Plan Element 611<strong>Rhode</strong> <strong>Island</strong> <strong>State</strong>wide <strong>Planning</strong> Programxi
December 2012Highways 2-1Bridges 2-3Intelligent <strong>Transportation</strong> Systems 2-4Traffic / Safety Programs 2-5Public Transit (Bus, Rail, Ferry) 2-6Bicycle 2-10Pedestrian 2-11Freight 2-12Intermodal 2-14Aviation 2-14Needs Assessment and Funding Scenarios 2-16Part Three: Financing the <strong>Transportation</strong> System 3-1Financing 3-1Federal Highway Program Funding 3-2Federal Transit Program Funding 3-5<strong>State</strong> Funding Resources 3-8Fiscal Constraint Analysis 3-14Part Four: Environmental Analysis 4-1Natural Resources and Environmental Mitigation 4-1Air Quality 4-4Water Quality and Wetlands 4-4Wildlife 4-5Energy 4-5Community Impacts 4-6Scenic and Historic Resources 4-6Dam Safety 4-6Sea–Level Rise 4-7Land Use Scenario Analysis (Current Trend, Sprawl Scenario, Compact Scenario) 4-9Environmental Justice Analysis 4-11<strong>Transportation</strong> <strong>2035</strong> (2012 Update)<strong>State</strong> Guide Plan Element 611<strong>Rhode</strong> <strong>Island</strong> <strong>State</strong>wide <strong>Planning</strong> Programxii
December 2012Identifying Environmental Justice Populations 4-12Principles <strong>of</strong> Environmental Justice (Outreach, Burdens, and Benefits) 4-12How This Plan Advances Environmental Justice Goals 4-18Air Quality Analysis 4-20Part Five: Recommendations 5-1Framework for Recommendations 5-1Bicycle 5-2Design 5-2Economic Development 5-2Emergency Response 5-3Environment 5-3Equity 5-4Finance 5-4Highway 5-5Intermodal 5-5Land Use and Corridors 5-6Pedestrian 5-6<strong>Planning</strong> 5-6Safety 5-7Transit 5-7Recommendations 5-8Bicycle 5-8Design 5-10Economic Development 5-12Emergency Response 5-15Environment 5-17Equity 5-20Finance 5-21Highway 5-24Intermodal 5-28<strong>Transportation</strong> <strong>2035</strong> (2012 Update)<strong>State</strong> Guide Plan Element 611<strong>Rhode</strong> <strong>Island</strong> <strong>State</strong>wide <strong>Planning</strong> Programxiii
December 2012Land Use and Corridors 5-31Pedestrian 5-35<strong>Planning</strong> 5-38Safety 5-41Transit 5-45AppendixAppendix A - Congestion Management Process A-1Appendix B - Survey Results B-1Appendix C - <strong>Transportation</strong> Funding Scenarios C-1Appendix D - Glossary, Acronyms, and Links D-1Appendix E - Public Review <strong>of</strong> the Plan E-1MAPSRegional Map (New England and eastern New York with Interstate and Rail) MAP 1-1<strong>State</strong> Land Use Plan MAP 1-2Hurricane Evacuation Routes MAP 1-3Employment Shift by Place <strong>of</strong> Work 2000-2010 MAP 1-4Population Change 2000-2010 MAP 1-5Census Tract Mean Travel Time to Work 2010 MAP 1-6Congested Highways 2012 MAP 1-7Congested Highways <strong>2035</strong> MAP 1-8<strong>Transportation</strong> Facilities System Map 2012 MAP 2-1Southern New England Freight Rail Lines MAP 2-2Water Supply and Wellhead Protection Areas MAP 4-1Wetlands MAP 4-2Rare Species Habitats MAP 4-3Protected Conservation and Park Lands MAP 4-4<strong>Transportation</strong> <strong>2035</strong> (2012 Update)<strong>State</strong> Guide Plan Element 611<strong>Rhode</strong> <strong>Island</strong> <strong>State</strong>wide <strong>Planning</strong> Programxiv
December 2012Designated Scenic Areas MAP 4-5Historic Sites and Districts MAP 4-6Roads Threatened by Dam Failure MAP 4-7Sea Level Rise (1-3 Meters) MAP 4-8Minority Population Percentage 2010 MAP 4-9aHispanic Population 2010 MAP 4-9African American Population 2010 MAP 4-10Asian Population 2010 MAP 4-11American Indian Population 2010 MAP 4-12Low Income Population 2010 MAP 4-13Disabled Population 2000 MAP 4-14Environmental Justice Populations and Schools Within 250’ <strong>of</strong> Interstates and Highways, 2010 MAP 4-15Case Study: Minority Populations Within ¼ Mile <strong>of</strong> RIPTA Service Area, 2010 MAP 4-16Future <strong>Transportation</strong> System “Swim Scenario” MAP 5-1Future <strong>Transportation</strong> System “Win Scenario” MAP 5-2Emergency Response Network Map, 2000 MAP 5-3Intelligent <strong>Transportation</strong> Systems, 2012 MAP 5-4<strong>Transportation</strong> <strong>2035</strong> (2012 Update)<strong>State</strong> Guide Plan Element 611<strong>Rhode</strong> <strong>Island</strong> <strong>State</strong>wide <strong>Planning</strong> Programxv
Part I Introduction & Background
December 2012PART ONE – INTRODUCTION & BACKGROUNDINTRODUCTIONThe <strong>Rhode</strong> <strong>Island</strong> <strong>State</strong>wide <strong>Planning</strong> Program, in cooperation with other agencies, prepares a long-range (twenty plus years) transportation plan that is part <strong>of</strong>the <strong>State</strong> Guide Plan. The <strong>State</strong> Guide Plan is a collection <strong>of</strong> plans and policy documents adopted by the <strong>State</strong> <strong>Planning</strong> Council that addresses the social,economic, and physical development <strong>of</strong> the state. The last transportation plan <strong>Transportation</strong> 2030 was adopted in August 2008 and remained valid untilAugust 2012. Federal regulations for ozone non-attainment areas, such as <strong>Rhode</strong> <strong>Island</strong>, require an update to the long range plan every four years therebynecessitating the need to complete an update to the transportation plan in 2012. In addition, the United <strong>State</strong>s Department <strong>of</strong> <strong>Transportation</strong> (USDOT)requires a valid long range transportation plan in order to adopt a new <strong>Transportation</strong> Improvement Program (TIP) and to process TIP amendments.Amendments to the TIP can be common given the frequent changes in engineering practices, environmental issues, contracting issues, project readiness, andother factors that can require adjustments to project schedules and budgets. Therefore in order to maintain compliance with federal air quality regulationsand to have the ability to fully amend the TIP, a limited Plan update entitled <strong>Transportation</strong> <strong>2035</strong>, was completed in 2012, and the planning horizon wasextended to the year <strong>2035</strong>.VISION STATEMENTA vision is a future framework, a model that we can agree on and strive towards. It is at once a context for planning, the basis for program design, andreflective <strong>of</strong> the wishes <strong>of</strong> the state’s citizens.Our common vision recognizes transportation as a core function that threads through other elements <strong>of</strong> society. <strong>Transportation</strong>connects the state with the global and regional economies, the home with the workplace, the individual with the community, and all <strong>of</strong>us with one another. It must equitably benefit all communities, and must be reconciled with quality <strong>of</strong> life issues as vital as the air webreathe, the water we drink, and the preservation <strong>of</strong> our natural and historic heritage and beauty <strong>of</strong> the natural and built environments.It cannot exist independently <strong>of</strong> these concerns.THE REGIONAL CONTEXT<strong>Rhode</strong> <strong>Island</strong>’s location in the heavily populated region between Washington, DC, New York, and Boston has contributed to development <strong>of</strong> its marine, road,and rail transportation. Today, <strong>Rhode</strong> <strong>Island</strong>’s transportation system exists as part <strong>of</strong> a larger system serving New England and the northeastern United <strong>State</strong>sregion. <strong>Rhode</strong> <strong>Island</strong> is part <strong>of</strong> the Amtrak Northeast Corridor and the I-95 highway corridor. This transportation infrastructure and other routes serve as a<strong>Transportation</strong> <strong>2035</strong> (2012 Update)<strong>State</strong> Guide Plan Element 611<strong>Rhode</strong> <strong>Island</strong> <strong>State</strong>wide <strong>Planning</strong> ProgramPage 1-1
December 2012conduit for traffic between New York, Boston, and Cape Cod. A regional analysis conducted by the <strong>Rhode</strong> <strong>Island</strong> Economic Policy Council documented thecrucial importance <strong>of</strong> regional transportation linkages to <strong>Rhode</strong> <strong>Island</strong>’s future economic strength, identifying the state’s location along the major highway,high speed rail, and proximity to international shipping lanes as a strategic asset. As economic and transportation linkages have grown stronger within theregion, commuting patterns have also shifted. Many <strong>Rhode</strong> <strong>Island</strong>ers are commuting to jobs in the metropolitan Boston area, and in southeastern Connecticut.Projects such as extension <strong>of</strong> commuter rail service and development <strong>of</strong> the intermodal train station at T.F. Green Airport are designed to capitalize on thesestrategic strengths.ORGANIZATION FOR TRANSPORTATION PLANNING<strong>Rhode</strong> <strong>Island</strong>, because <strong>of</strong> its size, is unique and efficient in its organizational structure for transportation planning. <strong>Planning</strong> activities are carried out on aconsolidated statewide basis rather than at both the state and regional / metropolitan levels, as is the case in most other states. Federal regulations call forthe Governor to designate a Metropolitan <strong>Planning</strong> Organization (MPO) as being responsible, along with the state transportation agency, for meetingrequirements for highway and transit projects funded by the U.S. Department <strong>of</strong> <strong>Transportation</strong>. In <strong>Rhode</strong> <strong>Island</strong>, the MPO is the <strong>State</strong> <strong>Planning</strong> Council,whose staff is the <strong>State</strong>wide <strong>Planning</strong> Program which is within the <strong>Rhode</strong> <strong>Island</strong> Department <strong>of</strong> Administration. The <strong>State</strong> <strong>Planning</strong> Council includesmembership from state executive agencies, local government, and the general public. The <strong>State</strong> <strong>Planning</strong> Council coordinates planning and developmentactivities in the state through the intergovernmental review process and development <strong>of</strong> the <strong>State</strong> Guide Plan.The <strong>State</strong> <strong>Planning</strong> Council has two permanent advisory committees: the Technical Committee and the <strong>Transportation</strong> Advisory Committee (TAC). The<strong>Transportation</strong> Advisory Committee (TAC) is comprised <strong>of</strong> representatives <strong>of</strong> state agencies, local governments, regional organizations, transportation systemproviders and users, private organizations, and citizens that have an interest or expertise in transportation matters. This group meets monthly and is directlyinvolved in preparing the transportation plan, <strong>Transportation</strong> Improvement Program (TIP), and Unified <strong>Planning</strong> Work Program. The TAC advises the <strong>State</strong><strong>Planning</strong> Council on all surface transportation-related matters and also serves as the cornerstone for public involvement in the transportation planningprocess.The <strong>State</strong>wide <strong>Planning</strong> Program staff, as part <strong>of</strong> a state planning agency, integrates transportation with other planning issues, such as land use, housing,natural resources, and economic development through the review and approval <strong>of</strong> local comprehensive plans. Additionally, advanced planning tools arehoused within the <strong>State</strong>wide <strong>Planning</strong> Program, namely <strong>Rhode</strong> <strong>Island</strong> Geographic Information Systems (RIGIS) and the <strong>State</strong>wide Travel Demand Model. Thestaff works cooperatively with the <strong>Rhode</strong> <strong>Island</strong> Department <strong>of</strong> <strong>Transportation</strong> (RIDOT), the <strong>Rhode</strong> <strong>Island</strong> Public Transit Authority (RIPTA), other state agencies,<strong>of</strong>ficials in 39 cities and towns, one Indian tribe, neighboring states and MPO’s, multi-state and Canadian provincial groups, and federal agencies.In addition, transportation planning is closely tied to air quality objectives, and the Long Range <strong>Transportation</strong> Plan and TIP both undergo a rigorous air qualityconformity analyses. To ensure the <strong>State</strong>’s air quality objectives related to transportation are achieved <strong>State</strong>wide <strong>Planning</strong> works closely with the <strong>Rhode</strong> <strong>Island</strong>Department <strong>of</strong> Environmental Management (RIDEM) and the US Environmental Protection Agency (EPA).<strong>Transportation</strong> <strong>2035</strong> (2012 Update)<strong>State</strong> Guide Plan Element 611<strong>Rhode</strong> <strong>Island</strong> <strong>State</strong>wide <strong>Planning</strong> ProgramPage 1-2
December 2012PLAN APPROVAL PROCESSIn order to process TIP amendments and fully realize federal funds for transportation projects <strong>State</strong>wide <strong>Planning</strong> developed a balanced yet aggressivetimeframe and limited scope for the limited update for <strong>Transportation</strong> <strong>2035</strong>. The limited scope was reviewed and supported by the USDOT’s Federal HighwayAdministration (FHWA) and Federal Transit Administration (FTA), the TAC, Technical Committee, and <strong>State</strong> <strong>Planning</strong> Council in 2012. A full draft <strong>of</strong><strong>Transportation</strong> <strong>2035</strong> was presented to the TAC at their September 27, 2012 meeting. At the close <strong>of</strong> this meeting, the TAC voted to recommend that the <strong>State</strong><strong>Planning</strong> Council/MPO schedule a public hearing on the draft <strong>Transportation</strong> <strong>2035</strong>. The Technical Committee and the <strong>State</strong> <strong>Planning</strong> Council/MPOsubsequently reviewed the draft <strong>Transportation</strong> <strong>2035</strong> at their respective October 2012 meetings and approved it for the purpose <strong>of</strong> conducting a publichearing. Notice <strong>of</strong> the public hearing and opportunity to comment on the draft TIP was provided through advertisement in the Providence Journal, posting onthe <strong>State</strong>wide <strong>Planning</strong> website, and a direct mailing to the over 2,000 planning and transportation contacts in <strong>State</strong>wide <strong>Planning</strong>’s database.Two informational presentations and public hearings on the <strong>Transportation</strong> <strong>2035</strong> draft were held on November 14, 2012 at 9:00 a.m. and on November 15,2012 at 6:30 p.m. in front <strong>of</strong> the TAC. The <strong>Transportation</strong> <strong>2035</strong> draft was then revised by staff based on direction received from the TAC through the publichearing process and presented to the Technical Committee on December 7, 2012 and the <strong>State</strong> <strong>Planning</strong> Council December 13, 2012. The <strong>State</strong> <strong>Planning</strong>Council approved and adopted the final <strong>Transportation</strong> <strong>2035</strong> on December 13, 2012.PURPOSES OF THE PLANThe transportation plan serves many purposes:• It fulfills federal requirements for statewide and metropolitan planning under SAFETEA-LU.• It provides a long-range framework for coordination among various modes and advancing projects in the <strong>Transportation</strong> Improvement Program.• It sets state policy, to guide public and private decisions involving transportation toward the end <strong>of</strong> improving the economic, social, andenvironmental well-being <strong>of</strong> the state.• As a <strong>State</strong> Guide Plan element, it is a basis for determining consistency <strong>of</strong> local comprehensive plans and other plans, programs, and projects withstate policies.SCOPE OF THE PLANSURFACE TRANSPORTATION PLANThe <strong>State</strong> Guide Plan is mandated as a means for centralizing and integrating long-range goals, policies and plans <strong>of</strong> various branches <strong>of</strong> state government. Theguide plan is not a single document but a collection <strong>of</strong> elements that have been adopted since the 1960’s.<strong>Transportation</strong> <strong>2035</strong> (2012 Update)<strong>State</strong> Guide Plan Element 611<strong>Rhode</strong> <strong>Island</strong> <strong>State</strong>wide <strong>Planning</strong> ProgramPage 1-3
December 2012This Plan, which is one element <strong>of</strong> the <strong>State</strong> Guide Plan, considers surface transportation systems for both people and freight, and connections to air and watertravel. It encompasses all modes <strong>of</strong> surface transportation: highway, bus, rail, paratransit, bicycle, pedestrian, and intermodal facilities. It also coverspassenger ferry service receiving federal funding.The following <strong>State</strong> Guide Plan elements also address transportation topics:Element 155: Greenspace and GreenwaysElement 640: <strong>State</strong> Airport System PlanElement 651: Waterborne Passenger <strong>Transportation</strong> PlanElement 661: Freight Rail PlanElement 121: Land Use 20252012 UPDATE: TRANSPORTATION <strong>2035</strong> SCOPEFrom July 2011 to July 2012 staff engaged in a full comprehensive update to the state’s FY 2013 – 2016 <strong>Transportation</strong> Improvement Program (TIP). The<strong>Transportation</strong> Advisory Committee (TAC), Technical Committee, and <strong>State</strong> <strong>Planning</strong> Council worked together with staff, municipal <strong>of</strong>ficials and the generalpublic to focus the <strong>State</strong>’s limited funding resources on those projects with the largest local, statewide and regional impact. The FY 2013-2016 TIP wasadopted by the <strong>State</strong> <strong>Planning</strong> Council on July 12, 2012. Limited staff resources prevented a simultaneous update to the Long Range <strong>Transportation</strong> Plan. Afterconsultation with <strong>State</strong>’s FHWA and FTA delegation, it was agreed that this Long Range <strong>Transportation</strong> Plan update will be limited to the sections outlined inthe table on the subsequent page, Scope <strong>of</strong> <strong>Transportation</strong> <strong>2035</strong>, Limited Update 2012. The <strong>Rhode</strong> <strong>Island</strong> <strong>State</strong>wide <strong>Planning</strong> Program will complete acomprehensive and full update to the Long Range <strong>Transportation</strong> Plan after the U.S. Department <strong>of</strong> <strong>Transportation</strong> (USDOT) has issued formal guidance on thedevelopment <strong>of</strong> long range transportation plans under Moving Ahead for Progress in the 21 st Century (MAP-21). It is anticipated that the next update will becomprehensive and address all sections <strong>of</strong> the plan.<strong>Transportation</strong> <strong>2035</strong> (2012 Update)<strong>State</strong> Guide Plan Element 611<strong>Rhode</strong> <strong>Island</strong> <strong>State</strong>wide <strong>Planning</strong> ProgramPage 1-4
December 2012Scope <strong>of</strong> <strong>Transportation</strong> <strong>2035</strong>, Limited Update 2012Update Status 2012 Update 2012 Partial Update Future UpdatePart I - Introduction & BackgroundIntroductionVision <strong>State</strong>mentThe Regional ContextOrganization for <strong>Transportation</strong> <strong>Planning</strong>Purpose <strong>of</strong> the PlanScope <strong>of</strong> the PlanBackground for Plan UpdatePerformance Assessment <strong>of</strong> 2004 <strong>Transportation</strong> PlanSAFETEA-LU <strong>Planning</strong> Requirements2010 MPO Recertification Recommendations<strong>State</strong> <strong>Planning</strong> ActivitiesUS DOT Strategic GoalsDemographic and Travel TrendsDemographic TrendsTravel TrendsPart II - <strong>Transportation</strong> System & Needs AssessmentInventory <strong>of</strong> FacilitiesHighwaysBridgesIntelligent <strong>Transportation</strong> SystemsTraffic/Safety ProgramPublic TransitBicyclePedestrianFreightIntermodalAviationNeeds AssessmentPart III - <strong>Transportation</strong> FinancingFinancingFederal Highway Program FundingFederal Transit Program Funding<strong>State</strong> FundingFiscal Constraint AnalysisPart IV - Environmental AnalysisNatural Resources and Environmental MitigationAir QualityWater Quality and WetlandsWildlifeEnergyCommunity ImpactsScenic and Historic resourcesDam SafetySea-Level RiseLand Use Scenario AnalysisEnvironmental Justice AnalysisAir Quality AnalysisPart V - RecommendationsFramework for RecommendationsBicycleDesignEconomic DevelopmentEmergency ResponseEnvironmentEquityFinanceHighwayIntermodalLand Use and Travel CorridorsPedestrian<strong>Planning</strong>SafetyTransitAppendixAppendix A - Congestion Management ProcessAppendix B - Survey ResultsAppendix C - <strong>Transportation</strong> Funding ScenariosAppendix D - Glossary, Acronyms, and LinksAppendix E - Public Review <strong>of</strong> the Plan<strong>Transportation</strong> <strong>2035</strong> (2012 Update)<strong>State</strong> Guide Plan Element 611<strong>Rhode</strong> <strong>Island</strong> <strong>State</strong>wide <strong>Planning</strong> Program
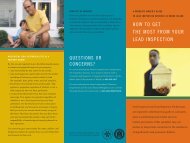
December 2012BACKGROUND FOR PLAN UPDATEThis section discusses how the planning environment has evolved since 2004. Several significant actions that have a bearing on this plan update include:performance review <strong>of</strong> the 2004 Plan, the 2010 recertification <strong>of</strong> <strong>State</strong>wide <strong>Planning</strong> (the MPO for the <strong>State</strong> <strong>of</strong> <strong>Rhode</strong> <strong>Island</strong>) by FTA and FHWA; recentlyadopted or ongoing planning activities at the state level; and new public participation activities. These are described below.PERFORMANCE ASSESSMENT OF 2004 TRANSPORTATION PLANPerformance MeasuresInadequateprogress23%Targetnot met10%Data notavailable30%<strong>Transportation</strong> 2025 completed in 2004, was the state’s first long rangetransportation plan that contained measurable objectives and performancemeasures. As a first step in updating <strong>Transportation</strong> 2030, a performanceevaluation <strong>of</strong> the 2004 Plan was undertaken. Performance measures, whichare generally quantitative, were reviewed. In some cases, data required toassess performance were not available. For instance, several performancemeasures rely on U.S. Census data that will not be available for several years.In other cases, operating agencies, such as RIDOT or RIPTA, were consulted fortheir most recent data. In several instances, data are collected differentlynow, and targets were reset based on new methods. The followingdesignations were used:Adequate• Data not yet available.Target metprogress21%• Target met or surpassed. This is used when annual data is available and16%current or future year targets have been met.• Adequate progress made toward target. This is used when the target isa future year, and annual data is available to track progress towardmeeting the objective.• Inadequate progress made toward target. This is also used when the target is a future year, and annual data is available to track progress towardmeeting the objective.• Target not met. This is used when the objective is for the current year, and annual data is available.The results showed a mixed bag <strong>of</strong> progress made toward goals. Performance measures for this Plan have been revised accordingly. This Plan continues toestablish performance measures which will be evaluated periodically.<strong>Transportation</strong> <strong>2035</strong> (2012 Update)<strong>State</strong> Guide Plan Element 611<strong>Rhode</strong> <strong>Island</strong> <strong>State</strong>wide <strong>Planning</strong> ProgramPage 1-6
December 2012BICYCLEThe state is accomplishing bike path construction at a pace that will meet targets. Bicycle mode share is not yet available.ECONOMIC DEVELOPMENTTwo <strong>of</strong> RIPTA’s three targets have been met – university recruiting for U-Pass Program (commuting indicator) and Providence-Newport Ferry ridership (tourismindicator).EMERGENCY RESPONSEHurricane evacuation routes and Highway Functional Classification amendments are complete. Data is not available to quantify incident clearance time orintersection level <strong>of</strong> service.ENVIRONMENTMode split (Census) data are not available. Water quality and emissions data also are not available. Gasoline consumption has increased, rather thandecreased, but the baseline data could not be verified. It is recommended that that a new baseline be set in the next update <strong>of</strong> the Plan, and the target resetto be consistent with a highway measure (H.4.h) to slow the rate <strong>of</strong> growth <strong>of</strong> Vehicle Miles Traveled (VMT), rather than reduce VMT which is not consideredto be realistic. The increase in greenhouse gas emissions has slowed. While that shows some improvement, it does not indicate adequate progress toward thegoal.EQUITY<strong>Transportation</strong> spending objectives in low-income and minority districts have been met, but data is not readily available to measure the percentage <strong>of</strong> FamilyIndependence Program families within ¼ mile <strong>of</strong> a transit route.FINANCESeveral steps have been taken in the last two (2) years to address the issue <strong>of</strong> bond borrowing as a match for federal funds and to smooth the shard peak thathad been anticipated in debt service over the next decade as a result <strong>of</strong> prior borrowing. These steps are detailed on Page 3-10 <strong>of</strong> this document. RIPTA’sfarebox recovery has increased and is moving in the direction <strong>of</strong> hitting the 35 percent target. <strong>Transportation</strong> spending (authorizations) has not kept pace withrising construction costs. RIDOT’s financial system is not yet capable <strong>of</strong> tracking project cost overruns.<strong>Transportation</strong> <strong>2035</strong> (2012 Update)<strong>State</strong> Guide Plan Element 611<strong>Rhode</strong> <strong>Island</strong> <strong>State</strong>wide <strong>Planning</strong> ProgramPage 1-7
December 2012HIGHWAYIn 2004, the Interstate pavement condition (93 percent at “good” or better) came close to meeting the target, but National Highway System roadways andstate system roadways did not fare as well, and did not come close to meeting targets. The percentage <strong>of</strong> bridges with structural deficiencies increased, ratherthan decreased, showing inadequate progress toward meeting targets. Again, mode split and incident clearance time data are not available. Congestionappears to have worsened, with interstate highways operating at posted speeds only 75 percent <strong>of</strong> the time, and hours <strong>of</strong> delay per person has also increased.The increase in VMT in 2002 and 2003 coincides with the previous two measures, although a slower rate <strong>of</strong> increase in 2004 is encouraging.INTERMODALRIPTA has met the objective <strong>of</strong> 100 percent <strong>of</strong> the bus fleet with bicycle racks. Park and Ride lot usage is not available.LAND USE AND TRAVEL CORRIDORSCensus data is not available to measure the urbanized area, although it should be noted that the <strong>Rhode</strong> <strong>Island</strong> <strong>State</strong> <strong>Planning</strong> Council adopted a state Land UsePlan in 2006, Land Use 2025, which establishes an Urban Service Area boundary. This boundary does not coincide exactly with the urban boundary, but thepolicies and strategies in the plan, if followed, should help in achieving this objective. Travel corridor studies have not been as numerous as hoped howevercorridor studies have been completed for Aquidneck <strong>Island</strong> and the Route 1 Corridor in South County.PEDESTRIANIn the years 2003 and 2004, sidewalk and ramp construction were not quite at the target level, but in 2005, the targets were exceeded. Mode split data arenot available.PLANNING<strong>State</strong>wide <strong>Planning</strong>’s transportation planning program was re-certified in February 2010, meeting theperformance target.<strong>Transportation</strong> <strong>2035</strong> (2012 Update)<strong>State</strong> Guide Plan Element 611<strong>Rhode</strong> <strong>Island</strong> <strong>State</strong>wide <strong>Planning</strong> ProgramPage 1-8
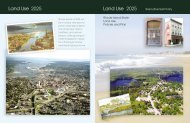
December 2012SAFETY<strong>Rhode</strong> <strong>Island</strong> is moving progressively towards reducing trafficfatalities and serious injuries and making the roadways safer for allusers. Between 2006 and 2010, traffic fatalities dropped 17 percent in<strong>Rhode</strong> <strong>Island</strong>. Since 2007, when <strong>Rhode</strong> <strong>Island</strong> changed the definition <strong>of</strong>a serious injury to an incapacitating injury, serious (incapacitating)injuries have dropped by 40 percent. The figure on the right depicts thetrend <strong>of</strong> fatalities and serious injuries in <strong>Rhode</strong> <strong>Island</strong> from 2001 to2010. The following is a brief synopsis <strong>of</strong> the five emphasis areas(alcohol-impaired driving, intersection and run-<strong>of</strong>f-the-road, occupantprotection, speeding, and young drivers) in the 2012 <strong>Rhode</strong> <strong>Island</strong>Strategic Highway Safety Plan and a summary <strong>of</strong> the extent <strong>of</strong> theproblem since 2006.<strong>Rhode</strong> <strong>Island</strong> Fatalities and Serious Injuries, 2001 – 2010Alcohol-impaired driving crashes resulted in 94 fatalities from 2006 to2010, which represents nearly 26 percent <strong>of</strong> all traffic fatalities in <strong>Rhode</strong><strong>Island</strong>.Between 2008 and 2010, 142 fatalities and 874 serious injuries occurred at intersection involved crashes. The numbers account for 67 percent <strong>of</strong> the totalroadway fatalities and serious injuries in the <strong>State</strong>. During the same period, 128 fatalities and 510 serious injuries involved run-<strong>of</strong>f-the-road crashes, whichrepresent 42 percent <strong>of</strong> the statewide numbers.In <strong>Rhode</strong> <strong>Island</strong>, there were 161 unbelted fatalities and 717 unbelted serious injuries between 2006 and 2010, which accounted for 44 percent <strong>of</strong> all trafficfatalities and 21 percent <strong>of</strong> serious injuries. There were 161 unbelted fatalities and 717 unbelted serious injuries between 2006 and 2010, which accounted for44 percent <strong>of</strong> all traffic fatalities and 21 percent <strong>of</strong> serious injuries throughout the <strong>State</strong>.Between 2006 and 2010, 141 speeding-related fatalities occurred on <strong>Rhode</strong> <strong>Island</strong>’s roadways, accounting for 38 percent <strong>of</strong> overall traffic fatalities in the <strong>State</strong>.Data is not available on speed-related serious injury crashes due, in part, to a lack <strong>of</strong> personnel resources which impedes law enforcement from conductingcrash reconstructions for speed-related serious injury crashes as they do for fatal crashes.Between 2006 and 2010, crashes involving young drivers resulted in 82 fatalities and 883 serious injuries. These events represent 26 percent <strong>of</strong> the totalfatalities and serious injuries in <strong>Rhode</strong> <strong>Island</strong>.<strong>Transportation</strong> <strong>2035</strong> (2012 Update)<strong>State</strong> Guide Plan Element 611<strong>Rhode</strong> <strong>Island</strong> <strong>State</strong>wide <strong>Planning</strong> ProgramPage 1-9
December 2012TRANSITThis is the category that has shown the greatest success in the achievement <strong>of</strong> objectives, especially with respect to RIPTA’s performance and ridershipincreases. While it is true that the hurricane devastation on the Gulf Coast in 2005 (along with other factors) caused a spike in gasoline prices, and a newincentive to use public transportation, RIPTA is also to be commended for bus maintenance and ADA fleet compliance. Mode split information will not beavailable until after the 2010 U.S. Census.SAFETEA-LU PLANNING REQUIREMENTSIn 2005, after numerous extensions <strong>of</strong> TEA-21, the federal reauthorization bill, known as SAFETEA-LU was passed by Congress and signed into law. This actcontains significant changes to the TEA-21 transportation planning provisions as outlined below. Plan update cycles have been extended from every 3 years toevery 4 years.• Metropolitan and <strong>State</strong>wide Plans - Environmental Mitigation: Metropolitan and statewide transportation plans must include a discussion <strong>of</strong> types <strong>of</strong>potential environmental mitigation activities, to be developed in consultation with Federal, <strong>State</strong> and Tribal wildlife, land management, and regulatoryagencies. [An environmental mitigation consultation was held in 2007 with appropriate agencies and stakeholders. Mitigation measures have beenestablished and are described in Part Four.]• New Consultations: MPOs and <strong>State</strong>s must consult "as appropriate" with "<strong>State</strong> and local agencies responsible for land use management, naturalresources, environmental protection, conservation, and historic preservation" in developing long-range transportation plans. Additionally for theLong-Range <strong>State</strong>wide <strong>Transportation</strong> Plan, <strong>State</strong>s must consult with Federally-recognized Tribal agencies responsible for land use management,natural resources, environmental protection, conservation, and historic preservation. [<strong>Rhode</strong> <strong>Island</strong>’s transportation planning process alreadyprovides for regular consultation and interaction with these agencies.]• Consistency <strong>of</strong> <strong>Transportation</strong> Plan with Planned Growth and Development Plans: Revises the previous planning factor related to environment toadd "promot[ing] consistency between transportation improvements and <strong>State</strong> and local planned growth and economic development patterns." [Thisplan uses the <strong>State</strong>’s Land Use Plan as a basis for scenario analysis.]• <strong>Transportation</strong> System Security: SAFETEA-LU calls for the security <strong>of</strong> the transportation system to be a stand-alone planning factor, signaling anincrease in importance from prior legislation, in which security was coupled with safety in the same planning factor. [This plan (as did the 2004 plan)addresses security in the Emergency Response section, separately from Safety, consistent with this provision.]<strong>Transportation</strong> <strong>2035</strong> (2012 Update)<strong>State</strong> Guide Plan Element 611<strong>Rhode</strong> <strong>Island</strong> <strong>State</strong>wide <strong>Planning</strong> ProgramPage 1-10
December 2012• Operational and Management Strategies: Metropolitan transportation plans shall include operational and management strategies to improve theperformance <strong>of</strong> the existing transportation facilities to relieve vehicular congestion and maximize the safety and mobility <strong>of</strong> people and goods. [Aproposal for a statewide Access Management Program has been included as an appendix to this Plan.]• Participation Plan: MPOs must develop and utilize a "Participation Plan" that provides reasonable opportunities for interested parties to comment onthe content <strong>of</strong> the metropolitan transportation plan and metropolitan TIP. Further, this "Participation Plan" must be developed "in consultation withall interested parties". This consultation requirement is intended to afford parties who participate in the metropolitan planning process a specificopportunity to comment on the plan prior to its approval. A participation plan must be in place prior to MPO adoption <strong>of</strong> transportation plans and TIPsaddressing SAFETEA-LU provisions. FTA/FHWA particularly expect this to encompass governmental and nonpr<strong>of</strong>it organizations that receive Federalassistance from a source other than the Department <strong>of</strong> <strong>Transportation</strong> to provide non-emergency transportation services and recipients <strong>of</strong> assistanceunder section 204 <strong>of</strong> title 23, U.S.C. [A Public Participation Guide was developed and approved in 2007. Additionally, a brochure was developed inboth English and Spanish and distributed widely throughout the <strong>State</strong>.]• Visualization Techniques in Plans and Metropolitan TIP Development: As part <strong>of</strong> transportation plan and TIP development, MPOs shall employvisualization techniques. <strong>State</strong>s shall also employ visualization techniques in the development <strong>of</strong> the Long-Range <strong>State</strong>wide <strong>Transportation</strong> Plan.[Photographs, charts, and greatly enhanced mapping are used extensively in this plan.]• Publication <strong>of</strong> Plans and TIP/STIP: MPOs shall publish or otherwise make available for public review transportation plans and TIPs including (to themaximum extent practicable) in electronically accessible formats and means, such as the World Wide Web. <strong>State</strong>s also shall use a similar approach forthe Long-Range <strong>State</strong>wide <strong>Transportation</strong> Plan. [<strong>State</strong>wide <strong>Planning</strong> has published plans and TIP’s on our website for many years and will continue todo so.]• Annual Listing <strong>of</strong> Obligated Projects: SAFETEA-LU specifies that the development <strong>of</strong> the annual listing "shall be a cooperative effort <strong>of</strong> the <strong>State</strong>,transit operator, and MPO" and also shall include two new project types, "investments in pedestrian walkways and bicycle transportation facilities" forwhich Federal funds have been obligated in the preceding year. [This list is available at www.planning.ri.gov/tip/7detail.pdf]• Congestion Management Processes in <strong>Transportation</strong> Management Areas (TMAs): Within a metropolitan planning area serving a TMA, there mustbe "a process that provides for effective management and operation" to address congestion management. Each TMA (with input from the FHWA<strong>Division</strong> Offices and FTA Regional Offices) should assess the extent that the TMA's existing CMS meets the new statutory requirements for acongestion management process and define a plan and schedule to implement this process. [A proposed Congestion Management Process is includedas an Appendix A to this Plan.]<strong>Transportation</strong> <strong>2035</strong> (2012 Update)<strong>State</strong> Guide Plan Element 611<strong>Rhode</strong> <strong>Island</strong> <strong>State</strong>wide <strong>Planning</strong> ProgramPage 1-11
December 2012CONGESTION MANAGEMENT PROCESSCommendation: The Congestion Management Task Force (CMTF) and the Congestion Management Process (CMP) provide a structured andcomprehensive means <strong>of</strong> evaluating causes <strong>of</strong> congestions and planning for access management.Recommendation: The CMTF develop and apply performance measures to expand the significance and utility <strong>of</strong> the CMP. Performance measures shouldthen be applied to examine alternatives and connect the CMP to long-term planning goals. [The CMTF has developed and continues to track congestionperformance measures including travel time reliability (average travel time, 95 th percentile travel time, planning index, and buffer index), incidentclearance time, crash rate, and Intelligent <strong>Transportation</strong> Systems (ITS).]FREIGHT PLANNINGCommendation: The Freight Advisory Committee was convened for the purpose <strong>of</strong> assessing and updating state freight planning goals, policies, andstrategies in 2009. Their guidance successfully raised the pr<strong>of</strong>ile <strong>of</strong> freight in <strong>Rhode</strong> <strong>Island</strong>.Recommendation: Maintain the Freight Advisory Committee as a standing committee to guide future freight planning efforts and maintain a high level <strong>of</strong>activity and attention in this area, including TIP development. [<strong>State</strong>wide <strong>Planning</strong> maintains the <strong>State</strong> Rail Plan Advisory Committee, which includes bothpassenger and freight issues related to rail. <strong>State</strong>wide <strong>Planning</strong> is also a core member <strong>of</strong> the newly created Freight Advisory Committee.]LAND USE & TRANSPORATION PLANNINGCommendation: For the superb coordination between transportation and land use planning with <strong>Transportation</strong> 2030, which is based onscenarios analyzed in Land Use 2025 and identifies strategies for focusing development in urban areas and preserving land in rural areas.Commendation: Administering the <strong>Planning</strong> Challenge Grant program as a means <strong>of</strong> implementing <strong>Transportation</strong> 2030 and Land Use 2025. The programallows <strong>State</strong>wide <strong>Planning</strong> staff to provide technical assistance strategically to communities to fund projects aligned with <strong>State</strong> priorities.FINANCIAL PLANNINGCommendation: The Governor’s Blue Ribbon Panel that examined funding for transportation, recognized the critical funding situation in <strong>Rhode</strong> <strong>Island</strong>,and worked proactively to identify new funding sources. The Federal team encouraged <strong>Rhode</strong> <strong>Island</strong> to make greater use <strong>of</strong> the Panel’s conclusions infuture transportation planning.<strong>Transportation</strong> <strong>2035</strong> (2012 Update)<strong>State</strong> Guide Plan Element 611<strong>Rhode</strong> <strong>Island</strong> <strong>State</strong>wide <strong>Planning</strong> ProgramPage 1-13
December 2012AIR QUALITYRecommendation: The SPP should continue to work with the <strong>Rhode</strong> <strong>Island</strong> Department <strong>of</strong> Environmental Management (DEM) to submit Rule VIII, whichoutlines the process and criteria for <strong>State</strong> agencies to determine air quality conformity for transportation plans and projects, to the EPA in a timely fashion andno later than September 2010. [Staff worked closely with RIDEM, RIDOT and RIPTA to update DEM’s Air Pollution Control Regulation No. 49. This updatedregulation has been approved by the <strong>State</strong> and the EPA. It will be incorporated into the <strong>State</strong> <strong>Planning</strong> Council’s Rules <strong>of</strong> Procedure as part <strong>of</strong> a larger updateexpected in 2013.]STATE PLANNING ACTIVITIESLAND USE PLANThe <strong>State</strong>’s land use plan was revised for the first time since 1989 and Land Use 2025 was adopted in 2006. The plan looked at several different alternativegrowth patterns, one <strong>of</strong> which was called “Centers and Corridors” and was based on the Travel Corridor <strong>Planning</strong> Initiative that was undertaken by <strong>State</strong>wide<strong>Planning</strong> in 2003. Other conceptual growth patterns were also analyzed. The preferred alternative is a composite <strong>of</strong> the alternatives and identifies an “urbanservice boundary” and potential growth centers outside <strong>of</strong> this urban area. The urban service area includes the metropolitan Providence region, otherdeveloped areas, and other areas that have public water and/or sewers. These are the same parts <strong>of</strong> the state that also have thebest transit service.The land use plan contains three key objectives that address transportation:• 4E. Promote intermodal centers and greater reliance on transit. [by maintaining stations, connections, and allowinggreater density <strong>of</strong> development along transit lines].See Map # 1-2RI <strong>State</strong> Land UsePlan• 4F. Provide pedestrian connections through all centers and urban districts. [through sidewalk investments and reconnected street grids]• 4G. Maintain the functional integrity <strong>of</strong> existing and planned roadways. [primarily through effective land use and corridor plans]In order to show consistency with land use and development plans, three growth scenarios have been developed in the Travel Demand Model based on theLand Use Plan. This scenario analysis is further described in Part Four.This transportation plan carries forward policies that are consistent with the urban services area and compact development principles. The same land usepolicies that strive to preserve open space and create vibrant (and more dense) urban centers and villages also are conducive to more effective and efficientuse <strong>of</strong> public transportation and non-motorized modes. This in turn eases congestion and is less harmful to the environment.<strong>Transportation</strong> <strong>2035</strong> (2012 Update)<strong>State</strong> Guide Plan Element 611<strong>Rhode</strong> <strong>Island</strong> <strong>State</strong>wide <strong>Planning</strong> ProgramPage 1-14
December 2012HOUSING PLANAs directed by the General Assembly, the cities and towns in <strong>Rhode</strong> <strong>Island</strong> have prepared plans to address the local shortages <strong>of</strong> affordable housing such thateach municipality achieves 10 percent. The state has also adopted a Five-Year Strategic Housing Plan and has recently completed a map that identifies suitablelocations for higher density development that are consistent with Land Use 2025. The Center for Neighborhood Technology has a website that identifieslocations in the Providence – Fall River Metropolitan Area where combined housing and transportation costs are affordable (45 percent or less <strong>of</strong> medianincome), and only a small portion <strong>of</strong> <strong>Rhode</strong> <strong>Island</strong> (mostly in inner city areas) is considered as such. 1HURRICANE EVACUATION ROUTESAs recommended by the 2004 plan, hurricane evacuation routes have been identified through a joint RIDOT/RIEMA effort and in coordination with cities andtowns. The routes have been mapped and posted on RIEMA’s website. As a next step in producing a complete evacuation plan,evacuation times on the identified routes have been estimated using the <strong>Rhode</strong> <strong>Island</strong> <strong>State</strong>wide Model (RISM). To date, therehave been no recommendations for specific roadway improvements as a result <strong>of</strong> the Evacuation Plan. The project evaluationcriteria used in the development <strong>of</strong> the <strong>Transportation</strong> Improvement Program allow extra points for projects on evacuationroutes.See Map # 1-3HurricaneEvacuation RoutesFREIGHT PLANNING NEEDS ASSESSMENTA Freight <strong>Planning</strong> Needs Assessment was completed by <strong>State</strong>wide <strong>Planning</strong> as a technical paper in 2006 that provided an overview <strong>of</strong> multi-modalfreight facilities in the state and a summary <strong>of</strong> local and regional planning efforts. The paper further identifies what additional steps that <strong>State</strong>wide<strong>Planning</strong> and RIDOT could be taking to improve freight planning. Key recommendations include the designation <strong>of</strong> state points <strong>of</strong> contact at bothagencies, and also exploring the possibility <strong>of</strong> folding <strong>Rhode</strong> <strong>Island</strong>’s Freight Rail Plan into the long range surface transportation plan.TRANSIT 2020 AND SPECIAL LEGISLATIVE COMMISSION ON TRANSITMuch attention has been paid in recent years to the future <strong>of</strong> transit in this state. A Special Legislative Commission was established in 2006 to investigatefunding issues. A group called Transit 2020, sponsored by the City <strong>of</strong> Providence, has been meeting to establish a new vision for transit in the Providence1 http://htaindex.cnt.org/map_tool<strong>Transportation</strong> <strong>2035</strong> (2012 Update)<strong>State</strong> Guide Plan Element 611<strong>Rhode</strong> <strong>Island</strong> <strong>State</strong>wide <strong>Planning</strong> ProgramPage 1-15
December 2012metro area. Both <strong>of</strong> these efforts included outreach efforts. In addition, a study was completed by the state Budget Office that surveyed people who do notuse transit to find out why they choose not to. Findings and recommendations from these efforts have been referenced and included in this plan.SAFE ROUTES TO SCHOOLThe Safe Routes to School (SRTS) program was established under SAFETEA-LU and provides the state with $1 million annually in funding for projects, bothinfrastructure (construction) and non-infrastructure activities (education, encouragement, law enforcement, and evaluation). RIDOT and <strong>State</strong>wide <strong>Planning</strong>share responsibility for this program, with the state coordinator position being a member <strong>of</strong> the <strong>State</strong>wide <strong>Planning</strong> Program staff. A multi-disciplinary steeringcommittee was established and two rounds <strong>of</strong> project solicitations and awards have been held. The first round <strong>of</strong> projects awarded ten (10) SRTS programs inseven (7) municipalities and involved 30 schools. These projects are in various stages <strong>of</strong> development ranging from in-process <strong>of</strong> being implemented tocompletion. The second round awarded 12 programs in 10 municipalities, involving 16 schools. These projects are in the process <strong>of</strong> being implemented or willbegin shortly.COORDINATED PUBLIC TRANSIT-HUMAN SERVICES TRANSPORTATION PLAN (SECTIONS 5310, 5316, AND 5317)RIPTA has been tasked with this planning effort (described below) as mandated by SAFETEA-LU. <strong>State</strong>wide <strong>Planning</strong>, as the MPO, has been and will be activelyinvolved, and recommendations from the Human Services Plan are included in this plan.As a condition for receiving formula funding under the following three FTA programs, proposed projects must be derived from a locally developedpublic transit-human services transportation plan: (1) Special Needs <strong>of</strong> Elderly Individuals and Individuals with Disabilities [49 U.S.C. 5310(d)(2)(B)(i)and (ii)]; (2) Job Access and Reverse Commute [49 U.S.C. 5316(g)(3)(A) and (B)]; and (3) New Freedom [49 U.S.C. 5317(f)(3)(A) and (B)]. The plan musthave been developed through a process that included representatives <strong>of</strong> public, private, and non-pr<strong>of</strong>it transportation and human services providers,as well as the public. This new requirement reinforces the broadened list <strong>of</strong> entities to be involved in the MPO's Participation Plan (23 U.S.C. 134(i)(5)(A) and 49 U.S.C. 5303 (i)(5)(A)), as described above. In preparing the local public transit-human service transportation plans, service providersseeking assistance under these programs should ensure full coordination with the applicable metropolitan and statewide planning processes.STRATEGIC HIGHWAY SAFETY PLAN<strong>Rhode</strong> <strong>Island</strong>’s 2012 Strategic Highway Safety Plan update was recently completed by RIDOT and will lead the <strong>State</strong> toward zero deaths. <strong>State</strong>wide <strong>Planning</strong>, asthe MPO, was an active participant in the development <strong>of</strong> both the 2007 and 2012 SHSPs. Recommendations from both the 2007 and 2012 SHSPs are includedin this Plan.<strong>Transportation</strong> <strong>2035</strong> (2012 Update)<strong>State</strong> Guide Plan Element 611<strong>Rhode</strong> <strong>Island</strong> <strong>State</strong>wide <strong>Planning</strong> ProgramPage 1-16
December 2012PUBLIC PARTICIPATIONA Public Participation Guide was adopted by the <strong>State</strong> <strong>Planning</strong> Council in 2007. This guide specifies the public participation requirements for federallyrequired surface transportation planning documents, including the long range plan, transportation improvement program, and unified planning work program.As part <strong>of</strong> this effort, brochures for public distribution were developed in both English and Spanish that explain the planning process and direct the reader toadditional sources <strong>of</strong> information, including staff resources.A <strong>Transportation</strong> Open House was held at the Blackstone Valley Visitors Center on March 1, 2007. This location is co-located with a transit hub in Pawtucketand was designed to better reach transit-dependent populations. RIDOT, RIPTA, <strong>State</strong>wide <strong>Planning</strong>, and the Office <strong>of</strong> Housing and Community Developmenthad displays and staff on hand to answer questions. Multi-media presentations were shown every hour in the adjoining auditorium. A “TRANS-blog” allowedfor posting <strong>of</strong> comments on the wall.<strong>State</strong>wide <strong>Planning</strong>, in conjunction with the University <strong>of</strong> <strong>Rhode</strong> <strong>Island</strong>, conducted special outreach to inner city high school students in Providence. Classroomlectures and exercises provided feedback on travel habits <strong>of</strong> younger people that are <strong>of</strong>ten left out <strong>of</strong> other public outreach activities.In addition, a survey was administered by mail and website (SurveyMonkey) to determine travel behavior and public opinion on transportation issues. Overthe course <strong>of</strong> one year, 135 responses were received. The survey instrument and results can be viewed in Appendix B.In 2011, <strong>State</strong>wide <strong>Planning</strong> was the recipient <strong>of</strong> a U.S. Housing and Urban Development (HUD) Sustainable Communities grant to create stronger and moresustainable communities in <strong>Rhode</strong> <strong>Island</strong>. As part <strong>of</strong> this HUD grant, <strong>State</strong>wide <strong>Planning</strong> is developing strategies to better engage the public, particularly thosetraditionally underserved by the planning process, in its outreach efforts. It is anticipated that the strategies developed through the Sustainable Communitiesgrant will be incorporated and utilized in the next Long Range <strong>Transportation</strong> Plan update.U.S. DEPARTMENT OF TRANSPORTATION STRATEGIC GOALSThe U.S. Department <strong>of</strong> <strong>Transportation</strong>’s (USDOT) Strategic Plan for Fiscal Years 2012-2016 sets forth the overall direction, and mission <strong>of</strong> the Department. TheStrategic Plan provides a mission statement to describe the underlying purpose for Departmental activities, and identifies five strategic goals and oneorganizational goal that capture the most important outcomes influenced by the Department’s programs. These goals, in addition to the goals in the FederalHighway Administration Strategic Plan (discussed in the following section) are guiding principles for other transportation plans.<strong>Transportation</strong> <strong>2035</strong> (2012 Update)<strong>State</strong> Guide Plan Element 611<strong>Rhode</strong> <strong>Island</strong> <strong>State</strong>wide <strong>Planning</strong> ProgramPage 1-17
December 2012MISSION“The national objectives <strong>of</strong> general welfare, economic growth and stability, and the security <strong>of</strong> the United <strong>State</strong>s require the development <strong>of</strong> transportationpolicies and programs that contribute to providing fast, safe, efficient, and convenient transportation at the lowest cost consistent with those and othernational objectives, including the efficient use and conservation <strong>of</strong> the resources <strong>of</strong> the United <strong>State</strong>s.”STRATEGIC GOALSSafety: Improve public health and safety by reducing transportation-related fatalities and injuries.<strong>State</strong> <strong>of</strong> Good Repair: Ensure the U.S. proactively maintains critical transportation infrastructure in a state <strong>of</strong> good repair.Economic Competitiveness: Promote transportation policies and investments that bring lasting and equitable economic benefits to the Nation andits citizens.Livable Communities: Foster livable communities through place-based policies and investments that increase transportation choices and access totransportation services.Environmental Sustainability: Advance environmentally sustainable policies and investments that reduce carbon and other harmful emissions fromtransportation sources.Organizational Excellence: Develop a diverse and collaborative workforce that will enable the Department to advance a transportation system thatserves the Nation’s long-term social, economic, security, and environmental needs.FEDERAL PERFORMANCE OBJECTIVESTo assess implementation success <strong>of</strong> the Strategic Plan, the agency incorporates outcomes and performance measures as part <strong>of</strong> the Plan to in order to markmilestones and measure progress toward the objectives. A number <strong>of</strong> the outcomes and measures <strong>of</strong> the Department’s Plan have relevance to <strong>Rhode</strong> <strong>Island</strong>’sGround <strong>Transportation</strong> Plan, and are included below, for reference.Highway Safety• Reduce transportation-related highway fatalities per 100 million vehicle miles traveled (VMT) to 1.03 by 2013.• Reduce passenger vehicle occupant fatalities per 100 million VMT to 0.82 by 2013.• Reduce non-occupant (pedestrian and bicycle) fatalities per 100 million VMT to 0.15 by 2016.<strong>Transportation</strong> <strong>2035</strong> (2012 Update)<strong>State</strong> Guide Plan Element 611<strong>Rhode</strong> <strong>Island</strong> <strong>State</strong>wide <strong>Planning</strong> ProgramPage 1-18
December 2012<strong>State</strong> <strong>of</strong> Good Repair• Increase the percent <strong>of</strong> travel on the enhanced NHS roads with pavement performance standards rated good to 60 percent in 2016.• Decrease the percent <strong>of</strong> deck area on enhanced NHS bridges rated structurally deficient to 7.4 percent in 2016.• Decrease the backlog <strong>of</strong> transit capital asserts in need <strong>of</strong> replacement or refurbishment by 2 percent from the 2010 baseline by 2016.Economic Competitiveness• Maintain travel time reliability in urban areas as measured by a decrease in the Travel Time Index to 1.19 in 2016.• Maintain travel time reliability in freight significant corridors at or below 15 percent in 2016.Livable Communities• Increase the number <strong>of</strong> <strong>State</strong>s with policies that improve transportation choices for walking, wheeling, and bicycling from 22 in 2011 to 27 in 2016.• Increased access to convenient and affordable transportation choices.• Improved access to transportation for people with disabilities and older adults.Environmental Sustainability• Reduction in transportation-related carbon emissions, improved energy efficiency, and reduction in use <strong>of</strong> oil in the transportation sector.• Reduction in transportation-related air, water and noise pollution and impact on ecosystems.Organizational Excellence• Work with stakeholders to determine the skills, educational, and occupational requirements <strong>of</strong> the future transportation workforce and implement anational workforce development strategy to meet the demands <strong>of</strong> the rapidly changing 21 st century transportation system.The above has been taken from the USDOT Strategic Plan “<strong>Transportation</strong> for a New Generation”.<strong>Transportation</strong> <strong>2035</strong> (2012 Update)<strong>State</strong> Guide Plan Element 611<strong>Rhode</strong> <strong>Island</strong> <strong>State</strong>wide <strong>Planning</strong> ProgramPage 1-19
December 2012FEDERAL HIGHWAY ADMINISTRATION STRATEGIC GOALSDuring 2008, the Federal Highway Administration (FHWA) released its multi-year Strategic Plan. This plan can be found at www.fhwa.dot.gov/strategicplan.pdf.The Agency adopted the new four-goal framework outlined in the Strategic Plan beginning in Fiscal Year (FY) 2009. The Agency developed and released anannual Strategic Implementation Plan (SIP) in advance <strong>of</strong> FY 2010 and FY 2011 that reflected the Agency’s priorities in each goal area for the coming year. InMarch 2011, the Agency extended the existing FY 2011 SIP through the first 9 months <strong>of</strong> FY 2012 as part <strong>of</strong> the transition to an annual planning cycle from June1, 2011, to May 31, 2012. This change in the planning cycle was made so as to coincide with the newly established Individual Performance Management cycle.The Extended FY 2011-12 SIP, also referred to as the Performance Year (PY) 2012 SIP, was updated in September 2011 to better reflect the Agency’s currentpriorities through May 31, 2012. The PY 2013 SIP covers the planning period from June 1, 2012 to May 31, 2013.The long-term FHWA Strategic Goals are:• National Leadership - FHWA leads in developing and advocating solutions to national transportation needs.• System Performance - The Nation’s highway system provides safe, reliable, effective, and sustainable mobility for all users.• Program Delivery - Federal Highway Programs are effectively and consistently delivered through successful partnerships, value-added stewardship,and risk-based oversight.• Corporate Capacity - Organizational resources are optimally deployed to meet today and tomorrow’s mission.The objective <strong>of</strong> the plan update is to refresh the strategic planning framework based on current and emerging issues and trends in consideration <strong>of</strong> the needto refocus the Agency's post-Interstate vision and mission. As noted in the USDOT Strategic Plan section above, the goals in the plan are guiding principles inother transportation plans including this long range plan.<strong>Transportation</strong> <strong>2035</strong> (2012 Update)<strong>State</strong> Guide Plan Element 611<strong>Rhode</strong> <strong>Island</strong> <strong>State</strong>wide <strong>Planning</strong> ProgramPage 1-20
December 2012DEMOGRAPHIC AND TRAVEL TRENDSThis Plan provides some basic summary demographic data that have a bearing on future transportation needs. Population alone does not determine traveldemand. Other factors, such as employment and vehicle registration are also considered.DEMOGRAPHIC TRENDSPOPULATION GROWTHPopulation growth in <strong>Rhode</strong> <strong>Island</strong> slowed during the last decade (0.4 percent) compared with the gains <strong>of</strong> the 1980s and 1990s (5.9 percent and 4.5 percent,respectively). <strong>State</strong>wide <strong>Planning</strong> used 2000 Census data to develop the statewide population projections used in this plan which call for a modest rate <strong>of</strong>future growth (8.8 percent growth from 2000 to 2030). Given the very small actual population growth that actually occurred in 2010, new populationprojections will be an integral part <strong>of</strong> the next Plan update. <strong>Rhode</strong> <strong>Island</strong>’s population has always been – and will likely continue to be – influenced bymigration. Domestic migration from across the country and from beyond our national borders is expected to continue as a major factor in determining the<strong>State</strong>’s population growth during the next decades.Source: U.S. Census (actual); <strong>Rhode</strong> <strong>Island</strong> <strong>State</strong>wide <strong>Planning</strong> (projected)<strong>Transportation</strong> <strong>2035</strong> (2012 Update)<strong>State</strong> Guide Plan Element 611<strong>Rhode</strong> <strong>Island</strong> <strong>State</strong>wide <strong>Planning</strong> ProgramPage 1-21
December 2012AGE STRUCTURE<strong>Rhode</strong> <strong>Island</strong>’s population is aging. During the next twenty years <strong>of</strong> the new millennium, the number <strong>of</strong> <strong>Rhode</strong> <strong>Island</strong>ers 65 years and older is projected toincrease by more than half (53.9 percent), from 151,881 in 2010 to 233,749 in 2030. Representing 14.4 percent <strong>of</strong> the state’s population in 2010, persons 65and older will account for 20.5 percent <strong>of</strong> <strong>Rhode</strong> <strong>Island</strong> residents in 2030. One segment <strong>of</strong> the elderly population <strong>of</strong> significant interest because <strong>of</strong> increasedcosts associated with older age is the frail elderly (ages 85 and older), whose population is expected to increase by 5.4 percent between 2010 and 2030.During those same years, the working age population (15-64) is expected to decline by 3.8 percent. Representing 68.3 percent <strong>of</strong> the population in 2010, thisage group will decline to 60.7 percent by 2030.HOUSEHOLDSThe number <strong>of</strong> households increased at twice the rate <strong>of</strong> the population between 1980 and 2010, growing by 22.2 percent while the population grew at 11.1percent. As the population spread out in a larger number <strong>of</strong> separate households, the ratio <strong>of</strong> persons to households fell from 2.8 to 2.5.500,000400,000300,000200,000100,0000<strong>Rhode</strong> <strong>Island</strong> Households / Persons Per Household Ratio,1980 - 20101980 1990 2000 201032.82.62.42.22Persons-to-Household RatioHouseholdsPersons-to-Household RatioSource: U.S. Census<strong>Transportation</strong> <strong>2035</strong> (2012 Update)<strong>State</strong> Guide Plan Element 611<strong>Rhode</strong> <strong>Island</strong> <strong>State</strong>wide <strong>Planning</strong> ProgramPage 1-22
December 2012EMPLOYMENT GROWTHBetween 1980 and 2010, employment growth (at 12.4 percent) outpaced population growth, although employment declined by 4.4 percent between 2000 and2010 while the population remained fairly constant. According to the <strong>Rhode</strong> <strong>Island</strong> Department <strong>of</strong> Labor & Training, <strong>Rhode</strong> <strong>Island</strong>’s net employment isexpected to increase by 39,674 to 549,206 during the ten-year projection period 2008-2018. (Employment projections in this Update come from the <strong>Rhode</strong><strong>Island</strong> Department <strong>of</strong> Labor and Training’s 2008 Employment Projections. These figures include Self-Employed workers and Unpaid Family Workers, while theemployment counts in this Update come from the Quarterly Census <strong>of</strong> Employment and Wages, which excludes these workers. In 2008, this differenceaccounted for 39,575 workers; in 2018 it is projected to account for 41,708 workers).Source: Quarterly Census <strong>of</strong> Employment and Wages, <strong>Rhode</strong> <strong>Island</strong> Dept. <strong>of</strong> Labor and Training<strong>Transportation</strong> <strong>2035</strong> (2012 Update)<strong>State</strong> Guide Plan Element 611<strong>Rhode</strong> <strong>Island</strong> <strong>State</strong>wide <strong>Planning</strong> ProgramPage 1-23
December 2012DEMOGRAPHIC CHANGESChanges in location <strong>of</strong> population and employment in the last decade have varied. Many cities and towns saw population increases, led by West Greenwichand North Smithfield which experienced growth rates over ten percent, but several cities and towns lost one to seven percent <strong>of</strong> their population, including anumber <strong>of</strong> cities and inner suburbs, and coastal and island communities. By county, Washington County and Providence County had modest increases, whileNewport County, Kent County, and Bristol County had modest declines.Municipalities experiencing employment growth (by place <strong>of</strong> work) were decentralized, with the largest percentage gainsoutside the metropolitan core in Exeter, Smithfield, and North Kingstown, while the cities <strong>of</strong> Providence, Pawtucket, EastProvidence, North Providence, and Central Falls lost jobs. The employment losses in the urban centers <strong>of</strong> the state result in amore sprawling development pattern and leads to greater vehicle-miles-traveled and more difficulty in providing effectivetransit service.See Map # 1-4Employment LocationChange and Map # 1-5Population ChangeTRAVEL TRENDS<strong>Rhode</strong> <strong>Island</strong>’s size and development pattern affect how workers travel. In 2010, <strong>Rhode</strong> <strong>Island</strong>ers had a mean commute time <strong>of</strong> 22.9 minutes (down slightlyfrom 23.5 minutes in 2000) and commuted as follows:2010 Work Trips by Mode RI USDrove alone 80.3% 76.6%Carpooled 8.2% 9.7%Public transportation (excluding taxicab) 2.8% 4.9%Taxicab, motorcycle, or bicycle 0.8% 0.8%Walked 3.8% 2.8%Other means 0.8% 0.9%Worked at home 3.3% 4.3%Average travel time (minutes) 22.9 25.9Source: 2010 1-year American Community Survey<strong>Transportation</strong> <strong>2035</strong> (2012 Update)<strong>State</strong> Guide Plan Element 611<strong>Rhode</strong> <strong>Island</strong> <strong>State</strong>wide <strong>Planning</strong> ProgramPage 1-24
December 2012Compared with the United <strong>State</strong>s, <strong>Rhode</strong> <strong>Island</strong> has a higher rate <strong>of</strong> driving alone to work than the nation. This trend results partly from the dispersion <strong>of</strong>homes and workplaces to the suburbs and more rural communities. <strong>Rhode</strong> <strong>Island</strong> also has a<strong>Rhode</strong> <strong>Island</strong> Car Ownershiplower share <strong>of</strong> workers who commute by public transit than the nation, and a lower share <strong>of</strong>residents who carpool. In <strong>Rhode</strong> <strong>Island</strong>, the work trips by mode did not change significantlyPercentage <strong>of</strong> Households with Access t<strong>of</strong>rom 2000 to 2010.Year 0 vehicles 1 vehicle 2+ vehicles1980 14% 40% 46%Auto ownership continues to increase slowly, although growth has slowed compared with1990 11% 35% 55%previous decades. Over half <strong>of</strong> <strong>Rhode</strong> <strong>Island</strong> households own two or more cars; this number has2000 11% 36% 53%changed little since 2000. The share <strong>of</strong> households with one car increased by one percentagepoint to 37 percent, while the share <strong>of</strong> households without a car fell a percentage point to 10 2010 10% 37% 53%percent in 2010. These figures vary greatly by city and town. In Providence, 19.2 percent <strong>of</strong>households did not have access to a vehicle (2010 1-year ACS) while in some rural towns only Sources: 2010 1-year American Community Survey (2010), U.S Censusone or two percent <strong>of</strong> households had no vehicles (2006-2010 5-year ACS).<strong>Rhode</strong> <strong>Island</strong> Vehicle Registration, 1995 - 2012950,000The number <strong>of</strong> vehicle registrations (as representedby the <strong>Rhode</strong> <strong>Island</strong> <strong>Division</strong> <strong>of</strong> Motor Vehicles for 900,000every month <strong>of</strong> January from 1995 to 2012) in the 850,000state increased by 16 percent from 1995 to 2012. Aslight increase in the early 2000s may have been800,000due to the upturn in the state and national750,000economy during this period. The current declinemay also be due to the economic downturn in the700,000state and national economies.650,000600,000550,000500,000199519961997199819992000200120022003200420052006200720082009201020112012Source: <strong>Rhode</strong> <strong>Island</strong> <strong>Division</strong> <strong>of</strong> Motor Vehicles<strong>Transportation</strong> <strong>2035</strong> (2012 Update)<strong>State</strong> Guide Plan Element 611<strong>Rhode</strong> <strong>Island</strong> <strong>State</strong>wide <strong>Planning</strong> ProgramPage 1-25
December 2012STATEWIDE TRAVEL MODELA statewide travel demand model is used to evaluate the transportation system in <strong>Rhode</strong> <strong>Island</strong>. This model uses socio-economic data developed by the<strong>State</strong>wide <strong>Planning</strong> Program (population and employment forecasts), together with vehicle trip data collected by RIDOT (HPMS traffic counts), and formulasbased on nationally accepted standard practices to project future travel on the state’s roadways. The following system-wide indicators <strong>of</strong> travel result from thiseffort.<strong>Rhode</strong> <strong>Island</strong> Travel ModelTravel Indicator 2012 2015 2025 <strong>2035</strong>Daily number <strong>of</strong> trips 4,337,916 4,408,640 4,654,492 4,837,062Daily vehicle miles <strong>of</strong> travel (VMT) 24,257,378 24,684,051 26,119,290 27,388,290Daily vehicle hours <strong>of</strong> travel (VHT) 663,645 672,362 720,954 761,840Average trip length (miles) 9.86 9.91 10.02 10.20Average trip time (min) 15.47 15.50 15.79 16.13Average vehicle speed (mph) 38.24 38.36 38.08 27.92The VMT above have been calibrated to be consistent with Highway Performance Monitoring System (HPMS) data, which are actual traffic counts reported toFHWA. The model’s population and employment are based on 2000 U.S. Census data and reflect the <strong>State</strong>wide <strong>Planning</strong> Program’s current population andemployment projections.The model indicates that moderate growth in travel is forecast, coinciding with increases in population and employment. Themodel also indicates that average trip length will increase slightly. This is due to continuing (but slowed) movement <strong>of</strong> populationto suburban and rural <strong>Rhode</strong> <strong>Island</strong>. Average travel time is forecast to increase due to two factors: dispersion <strong>of</strong> developmentand increasing congestion. A better indicator <strong>of</strong> congestion is average vehicle speed, which is expected to decrease as well.See Map # 1-7CongestedHighways 2012 andMap # 1-8CongestedHighways <strong>2035</strong>Overall, the level <strong>of</strong> travel is not anticipated to change dramatically. There will be more travel, with individuals travelingsomewhat farther. Congestion will cause travel to take longer. On a system-wide basis, there is concern about growingcongestion without corresponding increase in roadway capacity. Congested conditions can be expected to occur mostly during peak travel hours and /or whenthere is an incident such as highway construction, a severe weather event, or a crash. It will become more important to clear crashes from roadways as quicklyas possible.<strong>Transportation</strong> <strong>2035</strong> (2012 Update)<strong>State</strong> Guide Plan Element 611<strong>Rhode</strong> <strong>Island</strong> <strong>State</strong>wide <strong>Planning</strong> ProgramPage 1-26
December 2012Annual vehicle miles <strong>of</strong> travel (VMT) on <strong>Rhode</strong> <strong>Island</strong> roads increased dramatically through 2004. Annual vehicle miles <strong>of</strong> travel in <strong>Rhode</strong> <strong>Island</strong> dipped in 2005and then again in 2008, falling back to the 2002 level. The dip reflects the unfavorable economic conditions and rising fuel costs during this period. The figurebelow displays VMT projections as derived from themodel and HPMS data. Both data sets show futureAnnual HPMS and Model VMT, 2000 - <strong>2035</strong>growth although the HPMS line shows a higherrate <strong>of</strong> growth (1.48 percent per year) than themodel shows (1.53 percent per year). The twolines cross in the year 2010. Generally, forplanning purposes, 1.0 to 2.0 percent growth peryear is <strong>of</strong>ten used.Congestion modeled for the year 2012 showsmuch <strong>of</strong> the interstate and the major arterialsaround Providence experiencing some amount <strong>of</strong>congestion. South County and the East Bay arealso seeing increasing congestion. Congestioncontinues to worsen up to <strong>2035</strong>.<strong>Transportation</strong> <strong>2035</strong> (2012 Update)<strong>State</strong> Guide Plan Element 611<strong>Rhode</strong> <strong>Island</strong> <strong>State</strong>wide <strong>Planning</strong> ProgramPage 1-27
December 2012Bus ridership system-wide remained relatively stable from 2009 to 2011. In FY 2011, RIPTAincreased fares by 14 percent, resulting in an 8.5 percent increase in total20.0revenues. Ridership increased by almost 10 percent in 2012, most likely due tohigher gas prices.19.519.0The RIde Program is <strong>Rhode</strong> <strong>Island</strong>’s statewide paratransit service providing doorto-doorservice to eligible elderly and disabled residents. RIde’s total trips for FY18.52012 were 706,315, a 19.5 percent increase since FY 2009.18.017.5National travel trends are documented periodically in the Nationwide Personal17.0<strong>Transportation</strong> Survey (NPTS). The 2009 edition showed that most daily travel isfor non-work purposes, such as personal business/errands, social and recreational, 16.5shopping, and school. Interestingly, the vehicle miles <strong>of</strong> travel for social and16.0recreational purposes were significantly lower than 2001, but the number <strong>of</strong> tripsremained the same, indicating that people drove to a similar number <strong>of</strong> social andrecreational activities but chose places closer to home. Both men and women took fewertrips, on average, in 2009 than in 2001 and 1995. Travel by men decreased at agreater rate than travel by women. While traditionally less mobile than men, by2001 women made about the same number <strong>of</strong> person trips, and by 2009 womenmade significantly more trips overall than men. According to the 2009 NHTS,women overall took more trips than men for family errands, including shopping.Men make significantly more trips to and from work, and for work related business.Men and women made about the same number <strong>of</strong> social and recreational trips.Millions720,000680,000640,000600,000RIPTA Fixed Route Ridership, 2009 - 20122009 2010 2011 2012Paratransit Ridership, 2009 - 2012560,000520,0002009 2010 2011 2012<strong>Transportation</strong> <strong>2035</strong> (2012 Update)<strong>State</strong> Guide Plan Element 611<strong>Rhode</strong> <strong>Island</strong> <strong>State</strong>wide <strong>Planning</strong> ProgramPage 1-28
December 2012Airline passengers at the T.F. Green Airport rose sharply in the late 1990’s following a terminal expansion and new airline service. The number <strong>of</strong> passengersclimbed slightly until 2001, declined and then rose to a new high in 2005. Since then, the number <strong>of</strong> passengers continues to waiver due to the economicdownturn and aircraft seating capacity reductions as a result <strong>of</strong> higher fuel costs and airline mergers. The airline industry is still in flux; however, the addition<strong>of</strong> two popular seasonal markets in February 2012 and the arrival <strong>of</strong> a new major carrier at T. F. Green Airport in late November 2012 are expected to provide alift to the airport's passenger numbers.6,000,000Airline Passengers at T.F. Green Airport, 1995 - 20115,000,0004,000,000Passengers3,000,0002,000,0001,000,000019951996199719981999200020012002200320042005200620072008200920102011<strong>Transportation</strong> <strong>2035</strong> (2012 Update)<strong>State</strong> Guide Plan Element 611<strong>Rhode</strong> <strong>Island</strong> <strong>State</strong>wide <strong>Planning</strong> ProgramPage 1-29
Part II <strong>Transportation</strong> System and Needs Assessment
December 2012PART TWO - TRANSPORTATION SYSTEM AND NEEDS ASSESSMENTINVENTORY OF FACILITIESThe transportation system is a complex and integrated network <strong>of</strong> limited and unlimited access roadways, bridges, rail lines, airports, waterways, <strong>of</strong>f-roadpaths, passenger and freight intermodal facilities, transit vehicles and vessels, and ITS hardware. The components <strong>of</strong> the system mustoperate together in order to be effective. The system components are described below with a description <strong>of</strong> the future needs. Thesystem needs far outweigh the available resources, which underscores the importance <strong>of</strong> the <strong>Transportation</strong> Improvement Program(TIP) for defining program spending categories and prioritizing and selecting projects within those categories.HIGHWAYSSee Map # 2-1<strong>Transportation</strong>Facilities<strong>Rhode</strong> <strong>Island</strong>’s first roadways followed foot and horse paths that date to early settlements in the 1600’s. As the state urbanized, this evolved into an extensiveroad network, including arterial highways and local streets, with few areas lacking transportation access. Postwar suburbanization and economic growthstimulated a major wave <strong>of</strong> highway development. Federal legislation in 1956 funded the Interstate system, and <strong>Rhode</strong> <strong>Island</strong>’s three Interstate highways (I-95, I-195, and I-295) were open by 1975. <strong>State</strong> and local road mileage grew from 4,400 to 6,717 between 1962 and 2007, most <strong>of</strong> the total consisting <strong>of</strong> localroads and streets. Many <strong>of</strong> the older urban roads and bridges are expensive to maintain and difficult to upgrade to meet current demands. Harsh weather andsalt exposure hasten the deterioration <strong>of</strong> roads and bridges. The <strong>Rhode</strong> <strong>Island</strong> Department <strong>of</strong> <strong>Transportation</strong> is the state agency responsible for roadwayinfrastructure. Highway congestion is increasing on the Interstate highway system where 35 percent <strong>of</strong> the total VMT occurs on 1.2 percent <strong>of</strong> the roadmileage in 2008.The state road network (in route miles, not lane miles -- which would be higher) totals over 6,700 miles, and includes in 2008:• Three (3) interstate highways totaling 70 miles• Arterial and collector roads totaling 1,029 miles, maintained by the state• Arterial and collector roads totaling 1,669 miles, maintained by 39 cities and towns• Local streets totaling 3,904 miles, maintained by 39 cities and towns• Local streets totaling 45 miles, maintained by the stateThe mixed maintenance responsibilities for arterials and collectors reflect the historical evolution <strong>of</strong> the highway system. The fact that some arterials arelocally maintained, while the state maintains lower-level collectors is as much an artifact <strong>of</strong> history as it is based upon highway functional classification.<strong>Transportation</strong> <strong>2035</strong> (2012 Update)<strong>State</strong> Guide Plan Element 611<strong>Rhode</strong> <strong>Island</strong> <strong>State</strong>wide <strong>Planning</strong> ProgramPage 2-1
December 2012Legislation basing highway jurisdiction on functional classification and providing for jurisdictional transfers was passed in the early 1990s, but funding toimplement the program was not provided.In the FY 2013 – 2016 <strong>Transportation</strong> Improvement Program (TIP), projects are classified in one <strong>of</strong> the following categories: Study and Development, SystemManagement, System Preservation, or System Expansion. The discussion <strong>of</strong> the highway system needs is presented in this framework.PAVEMENT MANAGEMENTA major effort began in 1999 to resurface much <strong>of</strong> the state highway system, and the condition survey in 2001 reflects that effort. RIDOT estimates that thereis a need to resurface 70 miles per year, which would renew road surfaces every 15 years. In the past, a minimal (no more than several million dollars)program was undertaken with state funds. In recognition <strong>of</strong> this need, the TIP includes a Pavement Management Program for the resurfacing <strong>of</strong> roadways.Roadways listed in the Pavement Management Program include projects submitted by municipalities during the project solicitation process andrecommendations from RIDOT’s Pavement Management Program priority list. Any resurfacing project must be proposed on a Federal Aid System eligibleroadway. Both state and local roads are included in the program, based on factors such as regional significance <strong>of</strong> the road and support for economicdevelopment or enterprise zone initiative. There is approximately $118 million programed to pavement management in the FY 2013 – 2016 TIP.Indications are that the program has been insufficient over time to evenmaintain roadway condition. The percentage <strong>of</strong> state highway road surfacesclassified by RIDOT as being in “failed”, “poor”, or “fair” condition increasedfrom 27 percent in 2001 to 58 percent in 2007, and, the percentage rated as“good” or “excellent”, decreased from 73 percent to 42 percent. A conditionassessment <strong>of</strong> the Interstate was not available, but has only gotten worse since2001. Without a dramatic increase in the TIP’s resurfacing program, the trendtowards deteriorated pavement condition will continue.Pavement Condition, 2007<strong>State</strong> HighwaysInterstate Highways2001 2007 (est.) 2001 2007Excellent 38% 12% 98% N/AGood 35% 30% 1% N/AFair 12% 32% 1% N/APoor 12% 16% 0% N/AFailed 3% 10% 0% N/ASOURCE: 2007 RIDOT estimates based on 2004 condition assessment.CRACK SEAL PROGRAMAs pavement ages, the impacts <strong>of</strong> heavy traffic and weather cause the pavement to crack. Cracks allow water to enter the pavement and the highway base,causing further deterioration. This deterioration can be prevented to some extent by sealing the cracks in a timely manner. For many years, funds were notallocated to crack sealing by RIDOT. This effort is estimated to require several million dollars <strong>of</strong> funds each year. The FY 2013 – 2016 TIP carries crack-sealingand elastomeric surface treatment line items in the Pavement Management Program.<strong>Transportation</strong> <strong>2035</strong> (2012 Update)<strong>State</strong> Guide Plan Element 611<strong>Rhode</strong> <strong>Island</strong> <strong>State</strong>wide <strong>Planning</strong> ProgramPage 2-2
December 2012LOCAL ROADWAY MANAGEMENT PROGRAM<strong>Rhode</strong> <strong>Island</strong> cities and towns maintain about 5,573 miles <strong>of</strong> roads as <strong>of</strong> 2008. Like the state, they have not had sufficient funds to maintain their systems.Many streets have been constructed by developers, and then turned over to municipalities. While property tax revenues increase, pressures and costs rise forservices like schools, police, and fire services. The need for pavement maintenance does not occur for ten or more years. By that time, increased property taxrevenues have long been assimilated into the municipal budget. Sidewalks and traffic calming projects are also cited as needs by the cities and towns. A localroads program has been included in the FY13-16 TIP with $4.3 million to begin to assist municipalities with transportation infrastructure maintenance.BRIDGESAs <strong>of</strong> 2012, the <strong>State</strong> owns 611 bridges and culverts, and cities and towns own 149 bridges on the National Bridge Inventory. Two <strong>of</strong> the largest bridges in thestate, the Mt. Hope Bridge, and the Pell Bridge at each end <strong>of</strong> Aquidneck <strong>Island</strong>, are operated by the <strong>Rhode</strong> <strong>Island</strong> Turnpike and Bridge Authority. <strong>State</strong>wide, atotal 772 bridges on the National Bridge Inventory require ongoingmaintenance.Given the large number <strong>of</strong> historic bridges in <strong>Rhode</strong> <strong>Island</strong>, it is to beexpected that a considerable percentage would be classified as functionallyobsolete. The primary cause <strong>of</strong> functional obsolescence is deck geometry orunder clearances that do not meet contemporary design standards.“Functionally obsolete” bridges are considered to be performingsatisfactorily (good traffic flow, low accident rates), and are notprogrammed to be worked upon, unless they are also structurally deficient.Decisions to replace or rehabilitate bridges to address obsolescence mustalso consider the impact on historic resources and community character.<strong>Rhode</strong> <strong>Island</strong> Bridges, 2012greater than 20' longBridge Classification <strong>State</strong>-maintained Locally maintainedStructurally sound 239 39% 47 31%Functionally obsolete* 179 29% 40 27%Structurally deficient** 123 21% 34 23%Posted bridges 61 10% 22 15%Closed bridges 9 1% 6 4%Total Bridges: 611 100% 149 100%*Functionally obsolete: substandard geometrical condition <strong>of</strong> the structure (outdated design)**Structurally deficient: deterioration <strong>of</strong> the physical condition <strong>of</strong> the elements that make up the bridgeSource: RIDOT, 2012As with highway pavement, limited resources have been allocated to bridge maintenance over the past 20 years. Without ongoing maintenance efforts, manybridges have deteriorated and now need expensive rehabilitation. When bridges become severely structurally deficient, vehicle weight restrictions are posted.In extreme cases bridges are closed to all traffic. This impacts local travel, commerce, emergency response, public transit and school buses.There are 83 bridges on the National Bridge Inventory with posted weight limits. Alternate routes for heavy trucks (> 18 tons) have been posted, and these willbe in effect for several years as design and construction can be completed. Additionally, the southern span <strong>of</strong> the Washington Bridge has been found to beseriously affected by deterioration due to age and lack <strong>of</strong> proper maintenance over the years. All <strong>of</strong> these spans are critical links in the state and regional<strong>Transportation</strong> <strong>2035</strong> (2012 Update)<strong>State</strong> Guide Plan Element 611<strong>Rhode</strong> <strong>Island</strong> <strong>State</strong>wide <strong>Planning</strong> ProgramPage 2-3
December 2012transportation systems. Other significant bridge rehabilitation needs <strong>of</strong> the <strong>State</strong> system include the Route 6/10 interchange bridges in Providence, and bridges<strong>of</strong> I-95, I-195, and I-295.RIDOT has developed a bridge washing program to remove salt and sand, reduce corrosion and maintain the functional life and safety <strong>of</strong> bridges. This programwill be expanded to provide for the cyclical, periodic cleaning <strong>of</strong> all <strong>of</strong> <strong>Rhode</strong> <strong>Island</strong>’s bridges. Bridge inspections have been brought up to date.Because <strong>of</strong> the importance <strong>of</strong> the state’s bridge infrastructure, the FY 2013 – 2016 TIP allocates $39.5-$46 million per year to bridge rehabilitation. However,even this level <strong>of</strong> effort will not be sufficient if additional state funds are not allocated to regular bridge maintenance.ITSThe state has made great strides in recent years in implementing Intelligent <strong>Transportation</strong> Systems (ITS). This network is in place to provide drivers withbetter traffic information and also to clear traffic incidents more quickly and reduce congestion. The heart <strong>of</strong> the system is a <strong>Transportation</strong> ManagementCenter (TMC) which is staffed 24 hours a day utilizing funding from the Interstate Program. The TMC receives traffic video signals from cameras and speedsensors. Information on traffic conditions and incidents can be passed along to motorists by several means, including RIDOT’s website, highway advisory radio,and variable message signs along the highways. RIDOT cooperates with neighboring states in alerting drivers to major incidents.RIDOT phased ITS Deployment Plan currently covers the Providence metropolitan area and has been expanded to cover major arterials in the East Bay andSouth County. They will continually need to update this plan as new technology becomes available. It will also be important to improve incident reporting todemonstrate congestion reduction due to reduced incident clearance times. A more detailed discussion <strong>of</strong> the benefits <strong>of</strong> ITS is included in the CongestionManagement Process in Appendix A.<strong>Transportation</strong> <strong>2035</strong> (2012 Update)<strong>State</strong> Guide Plan Element 611<strong>Rhode</strong> <strong>Island</strong> <strong>State</strong>wide <strong>Planning</strong> ProgramPage 2-4
December 2012TRAFFIC/SAFETY PROGRAMSAnother area where there are significant needs is traffic and pedestrian safety programs. These programs manage traffic in congested areas and provide safetyimprovements. The following project types are included:Hazard Elimination Arterials / Traffic Signal Synchronized System Traffic / Safety Design / <strong>Planning</strong> / Right-<strong>of</strong>-WayDrainage Improvements Highway Safety Improvement Program (HSIP) Lighting Repair and ImprovementsMunicipal Traffic Projects Pavement Striping Railroad Grade CrossingsRepair Damaged Safety Devices RI*STARS Program Guide Signing Inventory / Improvements<strong>State</strong> Traffic Commission Projects Traffic Monitoring Traffic Signal OptimizationThe FY 2013 – 2016 TIP allocates $30.5 million each year to this area. Although RIDOT has discretion to select projects within these line items, a list <strong>of</strong>anticipated projects is listed in Appendix E <strong>of</strong> the TIP. A modernization program to upgrade signals to more energy-efficient light-emitting diodes (LEDs) isunderway. Replacement increases the lifetimes <strong>of</strong> signal lights, decreasing maintenance, and enhances signal visibility and safety.HIGHWAY LIGHTINGAdequate highway lighting can be an important factor in highway safety, particularly for older drivers. Glare can be a safety problem because it causesannoyance, discomfort, and fatigue, which can result in driver error. Programs to replace streetlights with more efficient and safer lights known as full-cut<strong>of</strong>fluminaries are in place in some areas <strong>of</strong> the state. These fixtures reduce the level <strong>of</strong> light pollution, save energy; increase safety for pedestrians, motorists, andbicyclists; and produce a more aesthetically pleasing environment.In addition to the problem <strong>of</strong> too much light, another significant safety issue, especially for the older driver, is not enough lighting. Repair or replacement <strong>of</strong>aging and obsolete highway lighting infrastructure is needed for some highway segments and ramps. New or improved lighting may also be needed in somelocations where traffic has increased in recent years. <strong>State</strong> highway lighting adequacy should be periodically reassessed to determine areas where new orenhanced lighting is necessary.HAZARD ELIMINATIONNew crash data systems allow more precise analysis <strong>of</strong> locations and causes <strong>of</strong> crashes. This program addresses high hazard intersections where it isdetermined that improvements to the geometry or signalization will result in fewer crashes. Roundabouts have been used in several intersections in the stateand they appear to be performing as hoped and improving traffic flow and safety.<strong>Transportation</strong> <strong>2035</strong> (2012 Update)<strong>State</strong> Guide Plan Element 611<strong>Rhode</strong> <strong>Island</strong> <strong>State</strong>wide <strong>Planning</strong> ProgramPage 2-5
December 2012HIGHWAY DRAINAGEInsufficient highway drainage can affect highway safety. Ponding <strong>of</strong> water on highway surfaces creates poor traction for vehicles and can lead to loss <strong>of</strong> control.To correct unsafe roadway conditions caused by improper drainage, and to enhance environmental quality, the FY 2013 – 2016 TIP includes $4 million fordrainage improvements statewide under the Traffic Safety Program. Further discussion <strong>of</strong> water quality can be found in Part Four.PUBLIC TRANSITFIXED ROUTE BUSPrivate companies developed trolley lines in the late 1800s, first horse-drawn, then electric. Ridership rose through the early 1900s and flourished againduring World War II. After World War II, trolleys were replaced by buses. As suburban development spread and auto ownership increased, however,ridership on the private transit system fell drastically. In 1964 the state created the <strong>Rhode</strong> <strong>Island</strong> Public Transit Authority (RIPTA). RIPTA doubled the routesystem by 1986, to 447 miles, making it a statewide system. Expansion was supported not only by the state but also by federal operating assistance, whichbegan in FY 1975. RIPTA's enabling legislation was changed in 2007. Originally created to take over failed transit systems, it now is designated to be the<strong>State</strong>'s mobility manager. Currently there are 236 buses, 37 Park 'n' Ride lots, and 54 routes statewide with a single fare ($2.00 per ride). All passengervehicles are equipped for people with disabilities and all full size buses contain bicycle racks. Levels <strong>of</strong> service on RIPTA’s fixed routes vary from route to route,depending on demand; some routes <strong>of</strong>fer only weekday service while other routes operate evenings and Saturdays and Sundays. Twelve colleges anduniversities have been recruited to participate in the U-Pass Program for students. The level <strong>of</strong> participation for these schools varies from statewide bus travelwith the presentation <strong>of</strong> the school and/or staff ID to fare products being sold on campus. RIPTA operates trolley service in Newport and Providence (3routes) with a fleet <strong>of</strong> five historic-style green trolleys and ten hybrid trolleys.A Vision for the Future <strong>of</strong> Transit in <strong>Rhode</strong> <strong>Island</strong>, RIPTA’s five year strategic plan, was completed in 2012. The plan outlined five major goals for RIPTA’sfuture:• Serve as <strong>Rhode</strong> <strong>Island</strong>’s mobility manager• Attract more riders• Grow the transit network to expand mobility and support economic growth• Realize the environmental, economic, and quality <strong>of</strong> life benefits <strong>of</strong> transit• Identify a sustainable funding strategy<strong>Transportation</strong> <strong>2035</strong> (2012 Update)<strong>State</strong> Guide Plan Element 611<strong>Rhode</strong> <strong>Island</strong> <strong>State</strong>wide <strong>Planning</strong> ProgramPage 2-6
December 2012FLEX SERVICEFlex Service is provided in eight (8) zones with a fleet <strong>of</strong> 17 vehicles. This is a hybrid transit service, which combines bus stops with demand response(reservation) service. Flex vehicles do not follow a regular defined route; they travel directly to the next pick-up/drop-<strong>of</strong>f location or time point. This servicelinks patrons with destinations within the zone and with scheduled stops on fixed route transit lines. This is an innovative transit option that responds totransit needs in more rural areas. Two <strong>of</strong> the demand-response zones provide job access services in support <strong>of</strong> the state's "welfare to work" efforts. Futureneeds include adherence to a vehicle replacement program, continued application <strong>of</strong> ITS technologies, and continued evaluation <strong>of</strong> routes and service areas.PARATRANSITThe RIde program continues to focus on providing demand-responsive transportation to low income, elderly and disabled people. RIde is the statewidebroker managing the requests for service and the contracts with carriers operating 104 daily vans that provide service around the state. Funding agencies payan hourly amount that is deposited into a restricted receipt account (Paratransit Capital Fund) used to provide state matching funds for capital expenses, suchas replacement vehicles. Future needs include continued adherence to a vehicle replacement schedule and continued enhancement <strong>of</strong> ITS technologies.Service expansion may be necessary as the population ages.FUTURE NEEDSRIPTA completed a strategic planning effort in order to guide bus transit development for the next five years. The plan identifies important investments, some<strong>of</strong> which are underway, including the development <strong>of</strong> <strong>Rhode</strong> <strong>Island</strong>’s first rapid bus service, improved data collection, and improved customer amenities.RIPTA also completed an Alternatives Analysis reviewing opportunities to improve connections in the Providence Metropolitan area. A fixed route streetcarconnecting College Hill, the Jewelry District, and Upper South Providence was selected as the preferred alternative. A comprehensive operational analysis isalso underway to identify opportunities to create a more efficient and effective transit network. Service standards will be updated to ensure service matchespopulation and employment demands and scenarios will be evaluated that would improve service based on ridership surveys and extensive data analysis.COMMUTER RAILUnder the Pilgrim Partnership II Agreement that is in effect, the Massachusetts Bay <strong>Transportation</strong> Authority (MBTA) operates weekday and weekendcommuter rail service between Boston and Providence, and weekday commuter rail service between Boston and Wickford Junction, while RIDOT contributescapital funding for projects benefitting the Providence line (i.e. Pawtucket layover yard, trainsets, station improvements, etc). This service carriesapproximately 2,000 riders per weekday from Providence and 900 riders per weekend day. As <strong>of</strong> September 2012, there are seventeen (17) inbound trips perweekday from Providence to Boston and nineteen (19) outbound trips per weekday from Boston to Providence. There are ten (10) inbound and ten (10)outbound trips per weekday south <strong>of</strong> Providence at the Interlink in Warwick and Wickford Junction in North Kingstown to Providence and Boston. There are<strong>Transportation</strong> <strong>2035</strong> (2012 Update)<strong>State</strong> Guide Plan Element 611<strong>Rhode</strong> <strong>Island</strong> <strong>State</strong>wide <strong>Planning</strong> ProgramPage 2-7
December 2012nine (9) inbound and nine (9) outbound trips per weekend day between Providence and Boston. There is currently no service south <strong>of</strong> Providence on theweekends.Future commuter rail needs in <strong>Rhode</strong> <strong>Island</strong> include continuation <strong>of</strong> existing service to Providence and the continued expansion <strong>of</strong> service in and around <strong>Rhode</strong><strong>Island</strong>. MBTA service extended south <strong>of</strong> Providence with the station openings at the Warwick Interlink at T.F. Green Airport in 2010 and Wickford Junction inNorth Kingstown in 2012. The operating costs for this service are funded by CMAQ for 3 years, but afterwards may require annual state subsidies. Additionalcommuter stations that are under consideration by RIDOT in <strong>Rhode</strong> <strong>Island</strong> include Pawtucket, Cranston, East Greenwich, West Davisville, Kingston, andWesterly. A potential commuter station in Woonsocket has also been the subject <strong>of</strong> a recent study involving the City <strong>of</strong> Woonsocket, Providence Foundation,and other stakeholder agencies, and is anticipated for further exploration at the planning level. Communities with commuter stations under considerationshould be cognizant <strong>of</strong>, and plan for, secondary growth impacts using Transit Oriented Development (TOD) and other Smart Growth tools. In addition, railservice to Fall River, Massachusetts would have benefits (as well as impacts) in the East Bay <strong>Rhode</strong> <strong>Island</strong> area. RIPTA believes there is a market for bus serviceacross state lines in Massachusetts to serve rail stations in South Attleboro and Franklin. Onerous liability insurance required by the Federal Motor CarrierSafety Administration (FMCSA) has prevented RIPTA from serving these destinations. However in Pawtucket, RIPTA and RIDOT are working together to build abus turnaround and walkway connection to the South Attleboro MBTA station which is just over the state line.INTERCITY BUSPeter Pan bus lines provide regular motor coach service in the New England and New Yorkarea, serving Providence, T.F. Green Airport, and Newport. Greyhound has a nationalservice area with the same stops as Peter Pan in <strong>Rhode</strong> <strong>Island</strong>. MegaBus operatesseveral routes connecting Providence to Boston and New York City. Future needsinclude continued cooperation with other transportation providers and a continuedfocus on intermodalism.Amtrak Ridership in <strong>Rhode</strong> <strong>Island</strong>, 2009 - 2011INTERCITY RAILAmtrak provides passenger rail service in the Northeast Corridor, with nineteen (19)trains operating each day in each direction (north to Boston and south to New York)including Acela and Northeast Regional trains. All trains stop in Providence, with nine(9) southbound trains stopping in Kingston and four (4) southbound trains stopping inWesterly. Northbound, eight (8) trains stop in Kingston and five (5) trains stop inWesterly. Amtrak ridership from <strong>Rhode</strong> <strong>Island</strong>’s three stations in 2011 was 821,567, up 3.6 percent from 2010, and up 9.5 percent from the 2007 ridership. Ofthis number 625,995 used Providence Station, 154,237 used Kingston, and 41,335 used Westerly. Amtrak completed electrification <strong>of</strong> the shoreline route, and<strong>Transportation</strong> <strong>2035</strong> (2012 Update)<strong>State</strong> Guide Plan Element 611<strong>Rhode</strong> <strong>Island</strong> <strong>State</strong>wide <strong>Planning</strong> ProgramPage 2-8
December 2012high-speed Acela rail service utilizing new equipment commenced late in 2000. Future needs include continuation <strong>of</strong> existing service at reasonable prices, newservice at the Warwick Interlink, and improved intermodal connections at terminals to encourage car free tourism and business travel. The capacity andcondition <strong>of</strong> the Northeast Corridor must be preserved and improved to meet the growing demand for passenger rail service in the Corridor. This is a nationalasset and its future is <strong>of</strong> great concern to the congressional delegations <strong>of</strong> all <strong>of</strong> the northeastern states.CARPOOL / VANPOOLThe Commuter Resource <strong>Rhode</strong> <strong>Island</strong> program is operated by RIPTA under contract with RIDOT. The purpose <strong>of</strong> the program is to attract commuters tocarpool, vanpool, and enhanced bus services. According to the 2010 American Community Survey 80.3 percent <strong>of</strong> <strong>Rhode</strong> <strong>Island</strong> workers age 16 and overcommute to work alone in a single occupant vehicle, which is close to the national median <strong>of</strong> 76.6 percent. Other modes <strong>of</strong> transportation for workerstraveling to work in 2010 include 2.8 percent utilizing public transportation, 8.2 percent carpool, 3.8 percent walk, and 3.3 percent work at home. Efforts toincrease auto occupancy for work trips (carpool matching) would generate air quality and energy conservation benefits, which can greatly improve theefficiency <strong>of</strong> peak-hour travel. Carpooling is especially practical for work trips to suburban and out-<strong>of</strong>-state employment centers that lack peak-hour busservice. RIPTA has a web-based carpool matching service to help capture this market 1 along with a reduced rate carpool parking program at the ProvidencePlace Mall. These trips would be diverted from single-occupant auto travel rather than transit or vanpooling. Vanpools are especially suited to suburbanemployment sites that are not served or are inadequately served by transit. Characteristics that facilitate the formation <strong>of</strong> efficient vanpools are largeemployee bases, concentration <strong>of</strong> employee residences in a few areas, and longer-than-average trip lengths. The <strong>State</strong> <strong>of</strong> <strong>Rhode</strong> <strong>Island</strong>, as the largestemployer, should be targeted for special promotions to enable employees to choose an alternative to the single-occupant auto for work trips. Policy changesin the provision <strong>of</strong> free and low-cost parking, and incentive- laden commuter options (subsidized bus/commuter rail passes, free commuter rail parking, etc.)must be considered to provide success to this type <strong>of</strong> endeavor. In 2008, the General Assembly passed a bill directing the Department <strong>of</strong> Administration toconvene a committee to produce a state employee transportation guide plan intended to reduce single occupant vehicle commuting. This plan is still underdevelopment and is expected to be forwarded to the General Assembly in early 2013.1 http://alternetrides.com/List_Destinations_t.asp?Sponsor=81759282<strong>Transportation</strong> <strong>2035</strong> (2012 Update)<strong>State</strong> Guide Plan Element 611<strong>Rhode</strong> <strong>Island</strong> <strong>State</strong>wide <strong>Planning</strong> ProgramPage 2-9
December 2012FERRYSeveral year round and seasonal ferry services are operated in <strong>Rhode</strong> <strong>Island</strong>:Year round:• Point Judith and Block <strong>Island</strong> (Interstate Navigation)• Prudence <strong>Island</strong> and Bristol (Prudence Ferry)Seasonal service:• Point Judith and Block <strong>Island</strong> (Fast Ferry)• Newport to Block <strong>Island</strong> (Interstate Navigation)• New London, Connecticut and Block <strong>Island</strong> (Nelseco Navigation)• Montauk, New York and Block <strong>Island</strong> (Viking Ferry Lines)• Quonset and Martha’s Vineyard (Vineyard Fast Ferry)• Jamestown and several points along Newport’s waterfront and islands (Jamestown and Newport Ferry Company)These services should continue as they either divert traffic away from roads or provide the sole means <strong>of</strong> transportation. Future ferry services may includesome type <strong>of</strong> cross-bay ferry service, perhaps from the Warwick area to the Bristol area (roughly halfway between the I-195 bridge in Providence and theNewport and Jamestown Bridges).BICYCLE<strong>Rhode</strong> <strong>Island</strong> has become a leader in providing bicycle paths, lanes, and routes for both recreation and alternative travel mode options. In 2012, there are justover 63 miles <strong>of</strong> paved bicycle paths in <strong>Rhode</strong> <strong>Island</strong> and more than 25 miles <strong>of</strong> paths under design. Such examples include the East Bay Bike Path, BlackstoneRiver Bikeway, Ten Mile River Greenway, South County Bike Path, and the Washington Secondary Bike Path which are immensely popular with residents andvisitors alike. Several others bicycle paths are in planning, design, and construction phase. Additionally there are more than 70 miles <strong>of</strong> signed on-road routes.Some <strong>of</strong> <strong>Rhode</strong> <strong>Island</strong>’s longer bicycle paths – the Blackstone River Bikeway, the Washington Secondary, and the East Bay Bike Path – are part <strong>of</strong> an ambitiouseffort from the <strong>Rhode</strong> <strong>Island</strong> based East Coast Greenway Alliance to create a contiguous bike path from Maine to Florida. Among the 15 states the East CoastGreenway would pass through, <strong>Rhode</strong> <strong>Island</strong> is a leader in constructing its segments <strong>of</strong> the bikeway.<strong>Transportation</strong> <strong>2035</strong> (2012 Update)<strong>State</strong> Guide Plan Element 611<strong>Rhode</strong> <strong>Island</strong> <strong>State</strong>wide <strong>Planning</strong> ProgramPage 2-10
December 2012According to the 2000 110 th Congress Sample Data, 0.3 percent <strong>of</strong> <strong>Rhode</strong> <strong>Island</strong> workers age 16 and over commuted to work on bicycle. This figure increasedto 0.7 percent in 2010 according to the 2010 American Community, and is also slightly higher than the national average <strong>of</strong> 0.5 percent <strong>of</strong> workers commutingby bicycle.RIDOT will continue to implement its policy <strong>of</strong> accommodating bicyclists whenever feasible on existing roadways through “bicycle friendly” design. The goals<strong>of</strong> the Bicycle Program are to complete the paths currently under design, and to develop new projects that will improve connections among the paths andlinkages with other transportation modes as a means to encourage alternatives to the automobile. For more detailed information on RIDOT’s statewidebicycle project initiatives, please visit www.dot.ri.gov/bikeri/.PEDESTRIANAs <strong>of</strong> 2010, <strong>Rhode</strong> <strong>Island</strong>’s (excluding New Shoreham) 1,082 miles <strong>of</strong> state roads, 395 miles have sidewalks. It is not known how many miles <strong>of</strong> sidewalks thereare on local roads, but they are generally found in most downtown areas and urban neighborhoods. Suburbs and rural areas are typically lacking in sidewalkinfrastructure. Although there is high demand for new sidewalks, many <strong>of</strong> these projects are prohibitively expensive due to drainage, utility and right <strong>of</strong> wayissues. In 2000, a Pedestrian Safety Plan was drafted by the RI Department <strong>of</strong> <strong>Transportation</strong> to inform state and local agencies, the private sector andindividuals how transportation policy, planning and practice can be integrated to better meet the walking needs <strong>of</strong> residents and visitors. The plan encouragesstrong local initiatives in identifying, planning, prioritizing and funding pedestrian improvements because most walking trips are local. The data analyzed in thisreport show that most pedestrian fatalities occur while attempting to cross the street. Improving the walking infrastructure has many benefits, includinghealth, safety, and helping to meet environmental justice goals.Future pedestrian needs are staggering. Maintenance <strong>of</strong> existing crossings, signals, and sidewalks is daunting in and <strong>of</strong> itself. Achieving ADA compliance on allsidewalks is expected to cost $65 million in Providence County alone (RIDOT Pedestrian Safety Plan). Improving safety (especially at crossings) andconstructing new sidewalks are critical, and will require substantial state and federal funding and cooperation with local governments and developers. Mixeduse centers, commercial areas, schools, and recreation areas should be prioritized.SAFETEA-LU created Safe Routes to School Program for kindergarten through eighth grade through which <strong>Rhode</strong> <strong>Island</strong> has allocated $1 million per year in theFY 2013 – 2016 TIP. The first round <strong>of</strong> projects awarded 10 SRTS programs in seven (7) municipalities and involved 30 schools. These projects are in variousstages <strong>of</strong> development ranging from in-process <strong>of</strong> being implemented to completion. The second round awarded 12 programs in 10 municipalities, involving16 schools. These projects are in the process <strong>of</strong> being implemented or will begin shortly.<strong>Transportation</strong> <strong>2035</strong> (2012 Update)<strong>State</strong> Guide Plan Element 611<strong>Rhode</strong> <strong>Island</strong> <strong>State</strong>wide <strong>Planning</strong> ProgramPage 2-11
December 2012FREIGHTThe Providence and Worcester Railroad (P&W) is a major regional freight carrier, connecting <strong>Rhode</strong> <strong>Island</strong> to CSX (Class I freight carrier) in Worcester, MA. TheSeaview Railroad operates switching service at the Quonset Business Park in North Kingstown and connects to the P&W. The Freight Rail Improvement Project(FRIP) involved construction <strong>of</strong> 17 miles <strong>of</strong> track parallel to the Amtrak Main Line toNortheast Intermodal Networkserve freight movements between Central Falls and the Quonset Business Park/ Davisville and to access points west <strong>of</strong> New England. The FRIP has beensuccessful in that tri-level automobile rail cars are now moving to and from thePort <strong>of</strong> Davisville, now possible through increased vertical clearances.Approximately five miles <strong>of</strong> track through Apponaug and East Greenwich arestill shared by freight and passenger operations along the two main lines. Thenew track is also used for MBTA commuter rail service.Common carrier trucking terminals are concentrated in the Providencemetropolitan area and provide service throughout the state and nation.Integrated express package delivery services including Federal Express andUnited Parcel Service (UPS) have major facilities in Warwick that are withinclose proximity to T.F. Green Airport and Interstate I-95.Marine transportation is the oldest form <strong>of</strong> transportation in the state andNewport was once one <strong>of</strong> the nation's major ports. The Port <strong>of</strong> Providencehandles liquid, dry, and breakbulk cargoes exceeding 2.7 million tons annuallyas <strong>of</strong> 2008. Dredging to 40 feet (at mean low water) has been completed along5,000 feet <strong>of</strong> berthing area. Dredging in the main shipping channel to 40 feet MLW has also been completed. New automobiles and frozen fish arrive at thePort <strong>of</strong> Davisville; automobiles are shipped throughout the region by rail and truck while the fish are flown worldwide.Future movement <strong>of</strong> freight relies on a functional highway system with reduced congestion. In 2001, RIDOT and the Federal Highway Administration (FHWA)completed a Commercial Vehicle Parking Supply and Demand analysis for National Highway System (NHS) segments in <strong>Rhode</strong> <strong>Island</strong>. This study found, and thesituation still exists, that on a statewide level, there is a current shortage <strong>of</strong> commercial vehicle parking spaces (i.e. tractor-trailer parking) along NHS segmentsin <strong>Rhode</strong> <strong>Island</strong>, and that, absent action to increase supply, the shortfall would grow to between 298 and 809 spaces (depending upon future demand growthassumptions) by 2019. Interstate I-95 was found to be the most severely impacted NHS route, due to high truck volume and limitations on truck parking. There-opening <strong>of</strong> one rest area on northbound I-295 in Cumberland helped to alleviate the deficit to some degree. The re-opening <strong>of</strong> the southbound I-295 restarea in the same area is still being planned. Safe at-grade crossings should be maintained along the P&W lines. The Freight Rail Improvement Project (FRIP)<strong>Transportation</strong> <strong>2035</strong> (2012 Update)<strong>State</strong> Guide Plan Element 611<strong>Rhode</strong> <strong>Island</strong> <strong>State</strong>wide <strong>Planning</strong> ProgramPage 2-12
December 2012and the Providence River dredging project are complete and ensure the continuity <strong>of</strong> multi-modal goods movement. The state should consider short-seashippingor “marine highway” options such as the Port Inland Distribution Network (PIDN) in conjunction with the Port Authority <strong>of</strong> New York and New Jerseyto divert containerized cargo from I-95. Continued coordination with regional groups such as North Atlantic <strong>Transportation</strong> <strong>Planning</strong> Officials and New EnglandGovernors / Eastern Canadian Premiers <strong>Transportation</strong> Working Group will help realize these objectives.<strong>State</strong>wide <strong>Planning</strong> completed a Freight <strong>Planning</strong> Needs Assessment in 2006. This report describes freight activities occurring at the state and regional levelsand also describes staff needs with respect to training and modeling and outreach to the freight community and cities and towns through the comprehensiveplanning process. This paper can be viewed at www.planning.ri.gov/transportation/158/158.pdf<strong>Transportation</strong> <strong>2035</strong> (2012 Update)<strong>State</strong> Guide Plan Element 611<strong>Rhode</strong> <strong>Island</strong> <strong>State</strong>wide <strong>Planning</strong> ProgramPage 2-13
December 2012INTERMODALThe table to the right accounts for <strong>Rhode</strong> <strong>Island</strong>’s terminals that provide intermodal and/or intramodal connections for passengers and freight as <strong>of</strong> September2012. Some <strong>of</strong> the intermodal passenger hubs are full service centers that have been created or improved in recent years. Others on the list provide minimalfacilities at present and require upgrading. Redevelopment pressures maythreaten the viability <strong>of</strong> the Port <strong>of</strong> Providence. The <strong>State</strong>’s future marinefreight terminal needs must be considered before any land use changes areallowed to occur. New intermodal passenger stations, particularly new railstations, will be required to meet travel demand in the future.AVIATIONThere are six state-owned airports in <strong>Rhode</strong> <strong>Island</strong> operated by the <strong>Rhode</strong><strong>Island</strong> Airport Corporation (RIAC). T.F. Green Airport in Warwick is the primarycommercial service airport (served by seven airlines). T.F. Green hasexperienced a fluctuation in passenger activity over the last 10 years. Afterreaching a new high <strong>of</strong> nearly 6 million annual passengers in 2005, RIAC hasseen a slight decline as a result <strong>of</strong> the economic recession and aircraft seatingreductions related to higher fuel costs and several airline mergers.Since 1996, the passenger terminal has undergone a major transformation andseveral renovations related to security, terminal capacity, and separation <strong>of</strong>arriving and departing passengers. The Warwick Interlink facility wascompleted in 2010 and combines a passenger commuter train station andrental car facility with an elevated walkway linked to the T. F. Green Airportterminal. It is the first station design <strong>of</strong> its type and is made possible by aninnovative financing plan that relies on rental car fees. The Interlink combinestrain, bus, auto, plane, and interstate highway connections that all serve as animportant regional transportation hub and reduce congestion around theairport. Looking forward, T.F. Green will undergo an extensive 5-year capitalprogram that will improve Runway Safety Areas and extend the primary<strong>Rhode</strong> <strong>Island</strong>’s Intermodal Terminals, Passenger & Freight, 2012Location and Terminal Passenger FreightNorthern <strong>Rhode</strong> <strong>Island</strong>Blackstone Valley Visitors’ Center -- PawtucketMetro <strong>Rhode</strong> <strong>Island</strong>Amtrak Station – Providence (1)Kennedy Plaza (major RIPTA hub) -- ProvidenceProvidence HarborWaterson Terminal Services (formerly ProvPort) (1)Allens Avenue AreaEast ProvidenceT.F. Green Airport – Warwick (1)Interlink Station - WarwickEast Bay <strong>Rhode</strong> <strong>Island</strong>RIPTA hub (Ames Plaza), East ProvidenceNewport Gateway Visitors’ Center and Perrotti ParkNewport HarborSouthern <strong>Rhode</strong> <strong>Island</strong>Quonset Davisville - North Kingstown (1)Wickford Junction Station – North KingstownKingston Station - South Kingstown (1)RIPTA hub (Wakefield Mall) - South KingstownWesterly Station - WesterlyPort <strong>of</strong> Galilee – Narragansett (1)Old Harbor -- Block <strong>Island</strong>(1) National Highway System Intermodal Connector<strong>Transportation</strong> <strong>2035</strong> (2012 Update)<strong>State</strong> Guide Plan Element 611<strong>Rhode</strong> <strong>Island</strong> <strong>State</strong>wide <strong>Planning</strong> ProgramPage 2-14
December 2012runway to 8,700 feet.Newport and North Central airports serve general aviation. Quonset serves general aviation and the RI National Guard (Army and Air). Block <strong>Island</strong> andWesterly are also general aviation with limited commercial service between the two. The airport is especially important to Block <strong>Island</strong> for emergency service.Future aviation needs are discussed in the <strong>State</strong> Airport System Plan (<strong>State</strong> Guide Plan Element 640). For the purposes <strong>of</strong> the <strong>Transportation</strong> Plan, access toairports and improved surface transportation connections at the terminals will help the airports to function better as intermodal centers.<strong>Transportation</strong> <strong>2035</strong> (2012 Update)<strong>State</strong> Guide Plan Element 611<strong>Rhode</strong> <strong>Island</strong> <strong>State</strong>wide <strong>Planning</strong> ProgramPage 2-15
December 2012NEEDS ASSESSMENTThe nation and most states are facing severe fiscal crises in their transportation programs. Revenues from fuel taxes have been stagnant and have not beenindexed to inflation. On the expense side, construction and materials costs have increased enormously. Consequently, continued reliance on the samerevenue sources will result in ever diminishing transportation programs. Many states are looking at drastic measures to correct this situation such as dramatictoll increases or new tolls, fuel tax hikes, mileage taxes, and outright sale or lease <strong>of</strong> state assets. The funding model for financing transportation in the United<strong>State</strong>s is 50 years old, and a fundamental overhaul may be on the horizon.<strong>Rhode</strong> <strong>Island</strong>’s long range plan, out <strong>of</strong> necessity, is based on the current funding level as new revenue sources are not yet forthcoming. This current path doesnot permit the state to maintain its infrastructure as it should, leading to a downward spiral <strong>of</strong> the transportation system. In order to begin the dialogue onwhat our needs are and how we can afford to pay for necessary improvements, a system level analysis was undertaken that defines four levels <strong>of</strong>transportation investment.This topic deserves far more attention and study than can be devoted to it in a few pages <strong>of</strong> this Plan. This analysis is a modest RIDOT/RISPP staff effort toprovide order <strong>of</strong> magnitude numbers. It includes capital and operating expenses, state and federal resources, and highway and transit modes. Each scenario isa point in time and does not consider change in VMT, change in price or consumption <strong>of</strong> gas, variable fees/tolls for heavy vehicles, personnel or constructioncost increases, or new technologies. Change in debt service over time is not reflected. Locations for tolled highways are not specified. Earmarks have notbeen considered in the analysis.The four scenarios are as follows:SINKThe Sink Scenario assumes that there are no new funding sources, and the state will continue to rely on current taxes and generalobligation bonds to match federal funds. This is a recipe for disaster as has been pointed out in previous transportation plans.Deferred maintenance and highway projects are the result <strong>of</strong> this unsustainable system. In this scenario, GARVEE projects andbridges demanding immediate attention are the priorities. RIPTA bus and ferry services are cut. Please note that this scenario doesNOT reflect the worst case scenario. Revenues from the Highway Trust Fund may decrease by 35 percent next year if Congressionalaction is not taken.This scenarioprovides for no newsources <strong>of</strong> revenue.The TIP for FY 2009-2012 reflects thislevel <strong>of</strong> funding.<strong>Transportation</strong> <strong>2035</strong> (2012 Update)<strong>State</strong> Guide Plan Element 611<strong>Rhode</strong> <strong>Island</strong> <strong>State</strong>wide <strong>Planning</strong> ProgramPage 2-16
December 2012TREAD WATERThere are many projects in the TIP (Highway and Enhancements especially) which have been there for years and are continuallydeferred due to lack <strong>of</strong> funds. This scenario provides for enough funding to complete these projects, and also provides forsustainable bridge and pavement management schedules. The Routes 6 / Route 10 project, currently estimated at $300 million,can be programmed. Most major highway projects already in the pipeline can be completed. RIPTA service is maintained at2007 levels including the ferry. Most importantly, this scenario breaks the debt financing cycle and shifts state personnel costsaway from the federal program to state funds. This scenario is considered to be the “bare minimum” <strong>of</strong> where we need to be.SWIMIn order to improve the overall condition and capacity <strong>of</strong> the transportation system, some expansion <strong>of</strong> all modes must occur.This scenario makes progress on bicycle and pedestrian infrastructure and increases bus service. Bus service is expanded incorridors in which the greatest VMT savings can be achieved. It provides commuter rail along the Northeast Corridor (Westerlyto Pawtucket and points between), Aquidneck <strong>Island</strong>, and widens certain congested segments <strong>of</strong> I-95 and I-295. It also providesstartup funds for a desperately needed local assistance program. The end result is that mobility is enhanced and the state is ona path toward forward progress.The Tread WaterScenario provides fortimely maintenance <strong>of</strong>infrastructure andbreaks ourunsustainable debtcycle.The Swim Scenarioprovides for targetedexpansion and overallimprovement in thecondition <strong>of</strong> theinfrastructure.WIN THE RACEThe term “Play to Win” is used by the <strong>Rhode</strong> <strong>Island</strong> Economic Policy Council to describe what the state must do not only tocompete and keep afloat, but to “win.” This provides the infrastructure that will carry <strong>Rhode</strong> <strong>Island</strong> successfully through at leastthe first half <strong>of</strong> the 21 st century. Included in this scenario are Providence streetcars, major bridges retr<strong>of</strong>itted for bicycleaccommodation, and commuter rail in the Blackstone Valley. I-95 is widened to the Connecticut border. Bus service is expandedto more rural communities. RIPTA will implement a new model <strong>of</strong> human services transportation in cooperation with the townsthat is based on the Flex Service model and runs 1-5 days per week. All communities have stable state aid for local roads.Congestion is reduced and air quality improves. The walkable and livable communities as envisioned in the <strong>State</strong>’s Land Use Plancan be realized. This scenario is highly desirable, but carries a hefty price tag.The Win the Racescenario achieves thevision <strong>of</strong> the state’sland use plan, providesreal choice and modaldiversity, andmaintains economiccompetitiveness forfuture generations.The table below summarizes transportation needs for the four scenarios by program area. A more detailed table which contains notes and assumptions isincluded in the Appendix.<strong>Transportation</strong> <strong>2035</strong> (2012 Update)<strong>State</strong> Guide Plan Element 611<strong>Rhode</strong> <strong>Island</strong> <strong>State</strong>wide <strong>Planning</strong> ProgramPage 2-17
December 2012The cost <strong>of</strong> the Tread Water scenario is 50 percent higher than what the current funding level is. The Swim scenario is 90 percent higher, and the Win scenariois 163 percent higher. Can the <strong>State</strong> afford this, and are its residents willing to pay for it?Potential new revenues have been identified to fund the four transportation scenarios. This analysis assumes that user fees, rather than general taxes, shouldbe generated in sufficient amounts to achieve a sustainable system. Selling or leasing infrastructure has not been included as an option in this exercise, butthat should not be ruled out. These fees should bea combination <strong>of</strong> new fees/taxes and a diversion<strong>of</strong> existing transportation revenues. The followingrevenue sources are considered:• Diversion <strong>of</strong> existing registration fees totransportation, and increase in fees• Diversion <strong>of</strong> existing vehicle sales tax• Increase in gas tax• New tolls• New sales tax on fuelParticularly with diversion <strong>of</strong> revenues from theGeneral Fund to transportation, lawmakers willface difficult choices between replacing thatrevenue or curtailing other state services. Thefuture <strong>of</strong> transportation funding relies to a greatextent on the authorization <strong>of</strong> the next federalsurface transportation bill. At a certain point intime, the gas tax will become obsolete when fuelefficiency improves and alternative fuel vehiclesbecome more common.A summary table <strong>of</strong> this analysis appears on thenext page, and, again, a more detailed table isincluded in the Appendix.TRANSPORTATION NEEDS(in millions <strong>of</strong> dollars per year)<strong>Transportation</strong> ProgramsSinkTreadWin theSwimWaterRaceRIDOT Maintenance and Operations $45 $109 $114 $128Capital Maintenance $20 $45 $71 $113Highway $42 $177 $245 $342Traffic Safety $6 $18 $25 $40Bridge $67 $128 $128 $128Bike/Pedestrian $9 $16 $24 $32SPR/PL $5 $8 $8 $8Enhancements $4 $13 $15 $25CMAQ $10 $16 $20 $20Personnel (deduct from proj. cost) -$40 -$40 -$40Commuter Rail / Warwick Station $20 $14 $32 $60ROW $0 $1 $5 $10Design $21 $25 $40 $60RIPTA Bus $112 $155 $175 $225Total $361 $683 $862 $1,150GARVEE* $58Other debt service** $35Total with debt service $454 $683 $862 $1,150*Ends in 2022 at $16.5m per year (peaks 2017-2019 at $51m).**Increases from $41m in 2009 to $63m in 2023 per year if this practice continues.<strong>Transportation</strong> <strong>2035</strong> (2012 Update)<strong>State</strong> Guide Plan Element 611<strong>Rhode</strong> <strong>Island</strong> <strong>State</strong>wide <strong>Planning</strong> ProgramPage 2-18
December 2012As the gas tax will eventually become obsolete, an alternative funding source that is based on a per mile fee should also be considered in the future.Calculations (in the Appendix) show that a 5.1 cent per mile fee would replace all <strong>of</strong> the state and federal revenues in the “Sink” scenario except Fares andOther. That fee would rise to 7.6 cents for “Tread”,9.7 cents for “Swim”, and 13.0 cents per mile for“Win.”This Plan does not, at this time, make arecommendation on a particular scenario otherthan state that the path that we are currently on isa losing prospect. The costs <strong>of</strong> rising up from theSink scenario are significant, and the costs forachieving RI’s vision (Win the Race) are staggering.We, as residents <strong>of</strong> this state, must lose the notionthat transportation is free and that infrastructurecan be provided and maintained without somehowdrastically increasing revenues. We hope that theBlue Ribbon Panel on <strong>Transportation</strong> Financing(appointed by Governor Carcieri in March 2008) canuse this analysis in its deliberations and makerecommendations.REVENUE SOURCESPOTENTIAL TRANSPORTATION REVENUE SOURCES(in millions <strong>of</strong> dollars per year)TRANSPORTATION PLANNING NEEDSTOTAL STATE AND FEDERAL $455 $682 $862 $1,151• Expansion <strong>of</strong> scope <strong>of</strong> long range plan toinclude freight rail and waterborne passenger transportation• Implementation <strong>of</strong> Congestion Management Process and Access Management Program• Participation in RIPTA’s Metropolitan Transit Study• Participation in the reauthorization <strong>of</strong> SAFETEALU and in efforts to obtain new state sources <strong>of</strong> revenue for the transportation system• Monitoring and update <strong>of</strong> Public Participation Guide• Continued outreach and public participation, especially to meet environmental justice and equity goals• Continued integration <strong>of</strong> ITS and operational strategies into the planning process• Continued integration <strong>of</strong> freight into the planning process• Continued training in air quality standards and conformitySinkTreadWaterSwimWin theRaceSTATEGAS TAX $132 $205 $273 $341REGISTRATION FEES $0 $50 $75 $100TOLLS $0 $30 $50 $60VEHICLE SALES TAX $0 $80 $80 $80GAS SALES TAX $0 $0 $0 $80GEN OBLIGATION BONDS $40 $0 $0 $0FAREBOX $20 $35 $40 $55OTHER $12 $15 $17 $20STATE Subtotal $204 $415 $535 $736FEDERALFHWA $200 $210 $250 $310NHTSA $6 $2 $2 $5FTA $45 $55 $75 $100FEDERAL Subtotal $251 $267 $327 $415<strong>Transportation</strong> <strong>2035</strong> (2012 Update)<strong>State</strong> Guide Plan Element 611<strong>Rhode</strong> <strong>Island</strong> <strong>State</strong>wide <strong>Planning</strong> ProgramPage 2-19
December 2012• Continued updates and enhancements to the travel demand model, especially the addition <strong>of</strong> a transit component, and an updated household travelsurvey• Continued acquisition <strong>of</strong> most recent GIS data including 1 meter digital elevation data for sea-level rise mapping• Continued emphasis on travel corridor planning too promote improved regional coordination on land use and transportation issues along travel corridors;o guide future updates to local comprehensive plans;o preserve the safety and operational efficiency <strong>of</strong> corridor primary roadways through access management;o provide transit options with zoning and land use that can sustain viable serviceso encourage the establishment <strong>of</strong> effective land use or growth management plans for corridors;o prevent or minimize development within the pathway <strong>of</strong> planned transportation facilities;o promote development <strong>of</strong> supporting street, sidewalk, and site circulation systems where land development is desired;o apply design, regulatory, and funding strategies to retr<strong>of</strong>it or revitalize older developed areas; ando address site-by-site development impacts on corridor capacity through traffic impact assessment and developer mitigation.PLEASE NOTE: This needs assessment was conducted as part <strong>of</strong> <strong>Transportation</strong> 2030 and was not updated as part <strong>of</strong> <strong>Transportation</strong> <strong>2035</strong>. The most up-todatefinancial information for transportation can be found in the following section, Part 3 – <strong>Transportation</strong> Financing, which was updated as a part <strong>of</strong><strong>Transportation</strong> <strong>2035</strong>. Although the numbers listed in the needs assessment in this section are not the most current, the overall findings <strong>of</strong> the analysis areaccurate, therefore the section was retained as it still outlines important policy considerations as we plan for meeting transportation needs into the future.<strong>Transportation</strong> <strong>2035</strong> (2012 Update)<strong>State</strong> Guide Plan Element 611<strong>Rhode</strong> <strong>Island</strong> <strong>State</strong>wide <strong>Planning</strong> ProgramPage 2-20
Part III Financing the <strong>Transportation</strong> System
December 2012PART THREE - TRANSPORTATION FINANCINGFINANCINGThe Safe Accountable Flexible Efficient <strong>Transportation</strong> Equity Act: A Legacy for Users (SAFETEA-LU) required Long Range Plans to have:A financial plan that demonstrates how the adopted statewide transportation plan can be implemented, indicates resources from publicand private sources that are reasonably expected to be made available to carry out the plan, and recommends any additional financingstrategies for needed projects and programs. The financial plan may include, for illustrative purposes, additional projects that would beincluded in the adopted statewide transportation plan if reasonable additional resources beyond those identified in the financial planwere available.Moving Ahead for Progress in the 21 st Century (MAP-21), which was signed into law on July 6, 2012, shifts the perspective <strong>of</strong> the Long Range Plan towardperformance-based planning. The specific requirements for Long Range Plans have not yet been developed or promulgated. Regulations regardingperformance-based measures for states will be issued no later than eighteen (18) months after the enactment <strong>of</strong> the authorization (by December 2013), andstates must develop performance-based plans within twelve (12) months <strong>of</strong> the adoption <strong>of</strong> these finalized regulations (by December 2014). There are anumber <strong>of</strong> unanswered questions regarding the details <strong>of</strong> the new planning requirements. These questions are likely to be resolved over the next two to threeyears, at which time a new Long Range Plan for <strong>Rhode</strong> <strong>Island</strong> will need to take shape.Whether or not it is necessary to meet federal requirements, a financial plan is crucial from the <strong>State</strong>’s perspective. If projects are over programmed, publicexpectations are raised to a level that cannot possibly be met. In order to prepare an effective and rationally-constrained financial plan, the <strong>State</strong> needs toknow the level <strong>of</strong> federal funding likely to be available over the long term. This information is important, not only to anticipate the level <strong>of</strong> match requirementthat must be made available from <strong>State</strong> and other sources, but also to appropriately program projects according to total resources available in any given year.MAP-21 is a two-year authorization: while a two-year authorization is certainly preferable to continued short-term (3 and 6 month) extensions under SAFETEA-LU, there is still a great deal <strong>of</strong> uncertainty about long-term funding and policy initiatives.The financial analysis requirements for the Long Range Plan have not been as stringent as those required and implemented in the <strong>Transportation</strong> ImprovementProgram (TIP). A financial constraint analysis, which considers cost estimates for individual projects by funding category, is required in the TIP. Although thistype <strong>of</strong> analysis is possible in the short term, the Long Range Plan views transportation infrastructure over the long term (20 years). Beyond the four yearhorizon <strong>of</strong> the TIP/STIP and the five year horizon <strong>of</strong> the <strong>State</strong> Capital Budget process, individual projects may not have been selected and broad-brushassumptions concerning availability <strong>of</strong> federal funds must be made.<strong>Transportation</strong> <strong>2035</strong> (2012 Update)<strong>State</strong> Guide Plan Element 611<strong>Rhode</strong> <strong>Island</strong> <strong>State</strong>wide <strong>Planning</strong> ProgramPage 3-1
December 2012Since the <strong>State</strong>’s Long Range Plan <strong>Transportation</strong> 2030 was adopted in 2008, and amended in 2010, there have been fundamental changes to fundingmechanisms and continued focus on financial concerns related to transportation in <strong>Rhode</strong> <strong>Island</strong>. The downturn in both the local and national economy hasreduced the availability <strong>of</strong> some revenues, while forcing a focus on future sustainability and improved efficiency and effectiveness. MAP-21 recognizes theneed for streamlining programs, consolidating or eliminating more than sixty (60) programs, and simplifying the transportation funding structure whilefocusing on core issues such as condition <strong>of</strong> infrastructure, acceleration <strong>of</strong> project delivery, safety, congestion reduction, and development <strong>of</strong> transportationalternatives. This section <strong>of</strong> the Long Range Plan has now been updated to better reflect changes at the <strong>State</strong> level and efforts to meet <strong>Rhode</strong> <strong>Island</strong>’stransportation infrastructure needs moving forward toward <strong>2035</strong>.FEDERAL HIGHWAY PROGRAM FUNDINGAVAILABLE FHWA FUNDSSAFETEA-LU, a five-year act, provided a consistent source <strong>of</strong> highway funds through the end <strong>of</strong> FFY 2009. There were ten (10) short term authorizationsbetween the close <strong>of</strong> FFY 2009 and July 2012. On July 6,2012, MAP-21 was signed into law and provides highwayfunds through the close <strong>of</strong> FFY 2014.Although the level <strong>of</strong> funding to be made available to<strong>Rhode</strong> <strong>Island</strong> in the future is not known beyond FFY 2014,there is an expectation that funding will be maintained inthe short-term and will increase to meet infrastructureneeds in future federal transportation bills. The <strong>State</strong><strong>Transportation</strong> Improvement Program (STIP) used $214million as the average annual amount <strong>of</strong> funding availablethrough regular highway formula funding, based onSAFETEA-LU. When MAP-21 was enacted, this figureAnticipated Funding for FY 2013-2016 TIP(millions <strong>of</strong> dollars)Resources 2013 2014 2015 2016 TotalFederal RevenueFederal Highway $ 212.0 $ 212.0 $ 212.0 $ 212.0 $ 848.0NHTSA Hazard Elimination $ 2.0 $ 2.0 $ 2.0 $ 2.0 $ 8.0Total Federal Revenue Available $ 214.0 $ 214.0 $ 214.0 $ 214.0 $ 856.0<strong>State</strong> RevenueGO Bond Proceeds $ 20.0 $ 13.0 $ 6.0 $ - $ 39.0RICAP Funds / Other <strong>State</strong> Funds $ 20.0 $ 20.0 $ 20.0 $ 20.0 $ 80.0Registration and License Fees $ - $ 7.0 $ 14.0 $ 21.0 $ 42.0Total <strong>State</strong> Revenue Available $ 40.0 $ 40.0 $ 40.0 $ 41.0 $ 161.0Total Federal and <strong>State</strong> Revenue $ 254.0 $ 254.0 $ 254.0 $ 255.0 $ 1,017.0proved to be accurate in FFY 2013 and FFY 2014 and provided no substantive reason to change the assumption <strong>of</strong> level funding in FFY 2015 and FFY 2016. Thetable on the previous page shows the assumption <strong>of</strong> federal funding made for the four years <strong>of</strong> the TIP, along with the sources <strong>of</strong> <strong>State</strong> matching funds. Thetable does not include discretionary grants or other awards and carry-forwards.<strong>Transportation</strong> <strong>2035</strong> (2012 Update)<strong>State</strong> Guide Plan Element 611<strong>Rhode</strong> <strong>Island</strong> <strong>State</strong>wide <strong>Planning</strong> ProgramPage 3-2
December 2012With an average project cost allocation <strong>of</strong> 80 percent Federal and 20 percent <strong>State</strong>, the <strong>State</strong> funds needed to match $214 million <strong>of</strong> federal funds would be$53.5 million each year. If the <strong>State</strong> fully matched the federal funds and all obligation authority translated into actual dollars spent, the total funding availablefor the highway program each year would be approximately $267.5 million. <strong>Rhode</strong> <strong>Island</strong> provides an annual match <strong>of</strong> approximately $40 million (see also<strong>State</strong> Funding Resources discussion on Page 3-8) and uses 100 percent federal funding as permitted and appropriate. All federal funding provided to <strong>Rhode</strong><strong>Island</strong> is allocated. Yet, even if all obligation authority was utilized in every year, there would not be sufficient funding to meet the transportation needs andimprovements required by <strong>Rhode</strong> <strong>Island</strong> businesses and residents. Each time the TIP is updated, implementation <strong>of</strong> some programmed projects are deferreddue to lack <strong>of</strong> funds. The TIP includes a category <strong>of</strong> projects which are unprogrammed but important. These projects could be ready for construction shouldadditional funding sources become available.ADVANCED CONSTRUCTIONIn order to maximize the use <strong>of</strong> available FHWA funds, <strong>Rhode</strong> <strong>Island</strong> utilizes the financing technique known as Advanced Construction. Federal regulationsrequire the authorization <strong>of</strong> all federal highway funds necessary to complete a project at the time the project starts, unless the <strong>State</strong> utilizes AdvancedConstruction. Most <strong>of</strong> the TIP projects are multi-year in nature, so that under normal procedures, federal funds are tied up in projects that won't use the fundsfor months or perhaps years into the future. Large multi-year projects can greatly reduce the amount <strong>of</strong> funds available for smaller projects since the totalamount <strong>of</strong> federal funds available to the <strong>State</strong> on an annual basis is limited.Advanced Construction is a valuable financing tool where the <strong>State</strong> is able to phase-in the federal funding to match the anticipated annual project need.Typically, federal funds in the first year for Advanced Constructed projects are authorized only for expected expenditures during that year. In future years,federal funds are applied to projects to cover each year's anticipated expenditures. The application <strong>of</strong> federal funds in future years is know as AdvancedConstruction Conversion.The risk in Advanced Construction is that if federal funds are reduced in future years, the <strong>State</strong> may not be able to obtain federal reimbursement immediatelyfor project expenditures. To limit the <strong>State</strong>'s liability for Advanced Construction, <strong>Rhode</strong> <strong>Island</strong> has chosen to restrict itself to $25 million <strong>of</strong> total AdvancedConstruction for the annual Highway Program. As Advanced Construction projects are converted by application <strong>of</strong> federal funds, new projects are started withAdvanced Construction in an equal amount.<strong>Transportation</strong> <strong>2035</strong> (2012 Update)<strong>State</strong> Guide Plan Element 611<strong>Rhode</strong> <strong>Island</strong> <strong>State</strong>wide <strong>Planning</strong> ProgramPage 3-3
December 2012MAJOR PROJECT ADVANCEMENT THROUGH GRANT ANTICIPATION REVENUE VEHICLE (GARVEE) FINANCINGIn 2003, the General Assembly granted approval for RIDOT to utilize Grant Anticipation Revenue Vehicle (GARVEE) bonds to finance five (5) large projects thatotherwise would have taken up a significant portion <strong>of</strong> the regular highway program. Motor Fuel bonds were used as the <strong>State</strong> match. The five projects areshown in the chart to the right, along with the percent <strong>of</strong> totalGARVEE/Motor Fuel financing provided to each project.<strong>Rhode</strong> <strong>Island</strong>'s GARVEE Projects & PaymentsThere have been three GARVEE and Motor Fuel bond series issued: 2003,2006, and 2009. Each GARVEE issuance is a 12-year series, while eachMotor Fuel issuance is an 18-year series. The total remaining debtservice to be paid on the GARVEE and Motor Fuel bonds is $533.5 million.The last GARVEE bond will be paid down in FY 2021. The last Motor Fuelbond will be paid down in FY 2027. The table to the right shows theremaining debt service on the five GARVEE projects to be paid down, byyear.ProjectGARVEE BondsMotor Fuel BondsI-195 Relocation $ 298,242,193 48.9% $ 70,030,018 63.4%Rt. 403 Extension $ 92,553,993 15.2% $ 21,303,541 19.3%Freight Rail (FRIP) $ 32,756,843 5.4% $ 7,958,131 7.2%Sakonnet Bridge $ 105,164,324 17.3% $ 11,159,118 10.1%Washington Bridge $ 80,712,037 13.2% $ - 0.0%Total $ 609,429,390 100.0% $ 110,450,808 100.0%The GARVEE funding enabled the <strong>State</strong> to implement five projects critical to rebuilding the infrastructure <strong>of</strong><strong>Rhode</strong> <strong>Island</strong>, fostering economic development and improving our quality <strong>of</strong> life as much as five years earlierthan if programmed through non-GARVEE sources.On the other hand, utilization <strong>of</strong> the GARVEE financing tool impacts the <strong>State</strong>’s overall ground transportationprogram by dedicating a significant portion <strong>of</strong> the <strong>State</strong>’s anticipated future federal highway programallocations to GARVEE bond retirement over an extended period <strong>of</strong> time. The effect on the remainder <strong>of</strong> theprogram would be magnified should the levels <strong>of</strong> federal highway program funding provided to <strong>Rhode</strong> <strong>Island</strong>in the future be reduced for any reason.<strong>Transportation</strong> <strong>2035</strong> (2012 Update)<strong>State</strong> Guide Plan Element 611<strong>Rhode</strong> <strong>Island</strong> <strong>State</strong>wide <strong>Planning</strong> Program<strong>Rhode</strong> <strong>Island</strong>'s Debt Service PaymentsFiscalMotorGARVEEYearFuelTotal2013 $ 48.4 $ 7.1 $ 55.52014 $ 48.4 $ 7.1 $ 55.52015 $ 48.4 $ 7.2 $ 55.62016 $ 52.6 $ 7.2 $ 59.82017 $ 52.8 $ 6.9 $ 59.72018 $ 52.8 $ 6.9 $ 59.72019 $ 43.8 $ 6.9 $ 50.72020 $ 43.6 $ 6.9 $ 50.52021 $ 43.2 $ 6.9 $ 50.12022 $ - $ 6.9 $ 6.92023 $ - $ 6.9 $ 6.92024 $ - $ 6.9 $ 6.92025 $ - $ 6.4 $ 6.42026 $ - $ 6.4 $ 6.42027 $ - $ 3.1 $ 3.1Total $ 434.0 $ 99.7 $ 533.7Page 3-4
December 2012FEDERAL TRANSIT PROGRAM FUNDINGBUS AND BUS RELATED TRANSITRIPTA currently receives funding from formula and discretionary grant programs. RIPTA’s formula funding has been steady from year to year, and the stateanticipates a similar level <strong>of</strong> funding under MAP-21. Discretionary funding, which used to include large portions <strong>of</strong> operating assistance, and then became akey source <strong>of</strong> capital funding, is now highly unpredictable. Without discretionary funds, buses will be funded at the expense <strong>of</strong> other important projects, suchas facilities improvements and IT investments, which are key to system performance.Because a portion <strong>of</strong> FTA funds are available to <strong>of</strong>fset the cost <strong>of</strong> operations, steady or decreasing funding for transit services may require service reductions.RIPTA’s operating costs are affected by inflation, which means that even a steady stream <strong>of</strong> funding could mean reductions in transit service. Transit servicecuts affect all riders who use the service to get to work, medical appointments, and daily errands like grocery shopping. These cuts have the greatest impacton people who do not have other transportation options.FIXED GUIDEWAY (STREETCAR)RIPTA recently completed an Alternatives Analysis and Environmental Assessment (EA), the purpose <strong>of</strong> which was to study the feasibility, cost and benefits <strong>of</strong>constructing an urban circulator in Providence to help our state and capital city to connect, grow and thrive. The study concluded with the selection <strong>of</strong> a locallypreferred alternative, a streetcar route between College Hill, the Jewelry District, and Upper South Providence thereby connecting major activity centers inProvidence’s downtown core, spur significant new development, and create an estimated 6,000 jobs over the next 20 years. The next phase is projectdevelopment, which includes preliminary engineering and final design. The total estimated cost for this phase is $7 million. RIPTA has set aside a portion <strong>of</strong>these costs with the expectation that as the project develops, additional outside resources will be identified. The total cost to construct the project is $126million, however a shorter “starter segment” is being evaluated to lower overall project costs and create a more competitive project for federal discretionaryfunds.<strong>Transportation</strong> <strong>2035</strong> (2012 Update)<strong>State</strong> Guide Plan Element 611<strong>Rhode</strong> <strong>Island</strong> <strong>State</strong>wide <strong>Planning</strong> ProgramPage 3-5
December 2012FIXED GUIDEWAY (RAIL)In an effort to increase mobility in southeastern New England, the <strong>State</strong> <strong>of</strong> <strong>Rhode</strong> <strong>Island</strong>, in cooperation with the Commonwealth <strong>of</strong> Massachusetts, enteredinto the Pilgrim Partnership Agreement (PPA) in 1988 whereby the MBTA provides commuter service to Providence Station. It is a continuation <strong>of</strong> the bi-stategoal to improve mobility within the shared corridor. In 2010, RIDOT and the MBTA entered into the South County Operating Agreement under which, theMBTA extended commuter rail service to T.F. Green Airport in Warwick and Wickford Junction in North Kingstown. New service to Warwick/T.F. Green Airportbecame fully operational on December 6, 2011 and new service to Wickford Junction Station became fully operational on April 2, 2012.SAFETEA-LU and its short term extensions, along with MAP-21, have provided funding for the development and operation <strong>of</strong> commuter rail service in <strong>Rhode</strong><strong>Island</strong>. <strong>Rhode</strong> <strong>Island</strong> receives between $3 million and $4 million annually from the Fixed Guideway Rail Modernization funds administered by the FederalTransit Administration (FTA). The New Start discretionary program provides another source <strong>of</strong> funding from the FTA for commuter rail facilities in the <strong>State</strong>.<strong>Rhode</strong> <strong>Island</strong> has used New Start federal funding for the purchase <strong>of</strong> MBTA commuter rail coaches and for the design, construction and right-<strong>of</strong>-wayacquisition, <strong>of</strong> the Pawtucket Layover Facility and the Wickford Junction Station.For the first three years <strong>of</strong> service, <strong>Rhode</strong> <strong>Island</strong> has used Congestion Mitigation and Air Quality (CMAQ) funds to fund ongoing operating costs <strong>of</strong> the newcommuter rail service. The primary cost for commuter rail operations are payments to AMTRAK for use <strong>of</strong> the Northeast corridor south <strong>of</strong> Providence, and forinsurance to indemnify AMTRAK from any loss due to incidents related to commuter rail service. MAP-21 extended the eligibility for the use <strong>of</strong> CMAQ funds toallow for operating costs <strong>of</strong> services intended to reduce congestion, provide alternative means <strong>of</strong> access, and improve air quality by taking vehicles <strong>of</strong>f <strong>of</strong> theroads. Depending on the amount <strong>of</strong> CMAQ funding available through authorizations beyond September 30, 2014 (the end <strong>of</strong> MAP-21), state funds may beneeded in the future to continue and expand commuter rail service.The federal fixed guideway apportionments are being used to fund capital maintenance costs <strong>of</strong> the commuter rail service and for capital projects required bythe MBTA operating agreement.FUTURE PROJECTS (RAIL)The annual fixed guideway apportionment to <strong>Rhode</strong> <strong>Island</strong> is not sufficient to fund the growing demand for commuter rail facilities and service including cost <strong>of</strong>operations. The following projects have been requested by local communities and/or identified in <strong>State</strong> planning documents for further study pertaining tocommuter rail feasibility: Pawtucket; Kingston and Westerly; Cranston, East Greenwich, West Davisville; Blackstone Valley; and Aquidneck <strong>Island</strong>.<strong>Transportation</strong> <strong>2035</strong> (2012 Update)<strong>State</strong> Guide Plan Element 611<strong>Rhode</strong> <strong>Island</strong> <strong>State</strong>wide <strong>Planning</strong> ProgramPage 3-6
December 2012PAWTUCKETThe City <strong>of</strong> Pawtucket, through the use <strong>of</strong> federal and state funding, completed a commuter rail feasibility study in 2007. As part <strong>of</strong> that study, it wasconfirmed that Amtrak, the Northeast Corridor owner, required side tracks outside <strong>of</strong> its two main line tracks at new station stops to load and unloadpassengers. Because the existing train depot could not accommodate the necessary new sidings without extensive property acquisition and relocation, it wasdetermined that reopening the historic station was not be feasible. The study then evaluated a second site as a potential station location. This site, an existingfreight yard, had limited access and required the relocation <strong>of</strong> the operating freight yard, therefore, this site was eliminated from consideration as well. TheCity then undertook an analysis <strong>of</strong> a third site located along the Northeast Corridor opposite the existing freight yard. This site, the preferred station location,<strong>of</strong>fers improved pedestrian and vehicular access, an area for parking, and the potential <strong>of</strong> utilizing the existing Freight Rail Improvement Project (FRIP) track asa siding for commuter trains.The City <strong>of</strong> Pawtucket has estimated that it will cost approximately $53 million in capital investment to construct the station and the required site and trackenhancements required by Amtrak at the preferred location. RIDOT, in partnership with the City <strong>of</strong> Pawtucket, will use $2 million in FTA appropriations for thenext phase <strong>of</strong> station development, environmental assessment and preliminary engineering, at the preferred site. RIDOT will manage the overall project whilethe City will provide the local match for the FTA funding. As part <strong>of</strong> the study, the environmental, operational and infrastructure impacts <strong>of</strong> constructing acommuter rail station along a high speed rail line will be evaluated in more detail and the capital cost estimates for construction will be further refined.KINGSTON AND WESTERLYKingston Station achieved ADA compliance by Amtrak through construction <strong>of</strong> a pedestrian overpass with elevators and other passenger amenities. In additionto South County Commuter Rail service, there is a possibility <strong>of</strong> extended service in Westerly from Connecticut along the Shoreline East.CRANSTON, EAST GREENWICH, AND WEST DAVISVILLECommuter rail in Cranston, East Greenwich and West Davisville will require further planning studies to determine the feasibility <strong>of</strong> rail service, including sitelocation <strong>of</strong> potential stations, environmental impacts, and potential rail operations.<strong>Transportation</strong> <strong>2035</strong> (2012 Update)<strong>State</strong> Guide Plan Element 611<strong>Rhode</strong> <strong>Island</strong> <strong>State</strong>wide <strong>Planning</strong> ProgramPage 3-7
December 2012BLACKSTONE VALLEYA study on commuter rail in the Blackstone Valley was completed that estimated ridership from Woonsocket to Providence. A follow-up study was conductedto determine feasibility, costs, benefits, ridership, service levels, and potential transit oriented development along an intrastate rail transit corridor fromWoonsocket to Warwick.AQUIDNECK ISLANDShould commuter rail service be extended from Boston to Fall River, a subsequent extension to Aquidneck <strong>Island</strong> may become a possibility. This extensionwould also require a crossing at the Sakonnet River crossing. On island service could be initiated independently <strong>of</strong> Fall River service or a Sakonnet Rivercrossing. The Aquidneck <strong>Island</strong> <strong>Planning</strong> Commission, in conjunction with the RI DOT and the RI <strong>State</strong>wide <strong>Planning</strong> Program, recently completed a<strong>Transportation</strong> Study for the island. That study recommended maintaining an active Newport Secondary Rail Corridor including preserving the rail corridor as acontiguous right-<strong>of</strong>-way, working with adjacent developers to eliminate existing or future encroachments (i.e. roadways, drainage, structure, etc.) as part <strong>of</strong>the local development approval process, promote continued track maintenance/grade-crossing improvements to retain Class 1 rating, and increase potentialuse <strong>of</strong> appropriate/feasible seasonal/year-round passenger rail uses <strong>of</strong> corridor.The <strong>State</strong> is currently in the process <strong>of</strong> completing a <strong>State</strong> Rail Plan which will be utilized to prioritize future rail projects for study and implementation.STATE FUNDING RESOURCESMOTOR VEHICLE FUEL TAX (GAS TAX)The <strong>State</strong> levies a 32 cent per gallon tax on motor vehicle fuels, which was last raised in 2009. In addition, <strong>Rhode</strong> <strong>Island</strong> levies a one-cent per gallon surchargewhich was originally intended to fund the Underground Storage Tank (UST) environmental remediation fund. The revenue generated by this “gas tax”increases and decreases in proportion to the number <strong>of</strong> gallons <strong>of</strong> fuel sold. According to a study by the Brookings Institution, receipts from federal and stategas taxes nation-wide rose beginning in the 1970s, but they reached a plateau in the late 1990s. The issue <strong>of</strong> reduced revenues from the gas tax is not a <strong>Rhode</strong><strong>Island</strong> issue alone, but a national problem, bolstered by the push to reduce congestion, promote alternate modes <strong>of</strong> transportation and alternative fuels, andimprove fuel economy in passenger vehicles.In 1992, <strong>Rhode</strong> <strong>Island</strong> had a 26 cent per gallon gas tax, which over the course <strong>of</strong> 20 years rose to 32 cents, an increase <strong>of</strong> 23.1 percent. <strong>Rhode</strong> <strong>Island</strong>’s total gastax receipts have not kept pace with increasing costs for transportation infrastructure, instead falling sharply in the past decade. With citizens driving less and<strong>Transportation</strong> <strong>2035</strong> (2012 Update)<strong>State</strong> Guide Plan Element 611<strong>Rhode</strong> <strong>Island</strong> <strong>State</strong>wide <strong>Planning</strong> ProgramPage 3-8
December 2012cars becoming more fuel efficient, the <strong>State</strong>, and by extension its transportation functions, currently receive $16 million, or 11 percent, less per year than in2007. Whereas in 2007, the <strong>State</strong> received $4.7 million for each penny <strong>of</strong> gas tax, in 2012, the <strong>State</strong> receives only $4.2 million for each penny. At the sametime, <strong>Rhode</strong> <strong>Island</strong>’s transportation program expenses were subject to the decreased buying power caused by inflation. Prior to FY 2010, at least a portion <strong>of</strong>the gas tax revenue was deposited in the General Fund, but in recent years policy-makers at the <strong>State</strong> level have redirected the funding to meet transportationneeds. The table below shows the FY2012 anticipated gas tax distribution based on current law and an estimated yield <strong>of</strong> $4.2 million per penny.RIDOT’S USE OF GAS TAX FUNDSThe fuel tax allocated to RIDOT funds the Department’s annual operating costs and pays for debt service on bonds issued for highway improvements.Operating costs include nearly all Department expenses that are not part <strong>of</strong> the Highway Improvement Program and are not otherwise covered by federalgrants. The gas tax pays for such work as snow removal, litter pickup, catch basin cleaning, bridge washing,grass cutting and minor road maintenance and repair as well as the agency’s administrative costs.FY 2012 Anticipated Gas Tax DistributionRIDOT’s expenditures for operating costs are forecast to increase each year. There are a number <strong>of</strong> factorsYield inRecipientPennieswhich contribute to escalating costs, including salaries and benefits for personnel, cost <strong>of</strong> materials,MillionsRIDOT 19.75 $ 83.4severity and duration <strong>of</strong> winter storms, equipment repairs and maintenance, utility costs, and otherGARVEE Program 2.00 $ 8.4variables that are dependent on the national and local economy.RIPTA 9.75 $ 41.2DHS 1.00 $ 4.2Until the General Assembly and Governor took action as part <strong>of</strong> the FY 2012 and FY 2013 <strong>State</strong> Budgets,Underground Storage 0.50 $ 2.1debt service had been forecast to increase on an annual basis as additional bonds were issued to matchTotal 33.00 $ 139.3FHWA funds. Typically, $40 million in bonds were issued annually to match FHWA capital funds and to payfor projects with 100 percent <strong>State</strong> costs. Reliance on bond funds for matching federal funds was a dangerous practice that threatened to severely limitavailable resources for operating as debt service costs grew to a disproportionate share <strong>of</strong> gas tax revenue, and gas tax revenue declined. Prior to the actions<strong>of</strong> policymakers, the continued issuance <strong>of</strong> bonds were projected to result in debt service <strong>of</strong> $62.93 million in 2023, creating an estimated $30 million gap inRIDOT’s operating budget.Several steps have been taken in the last two years to address the issue <strong>of</strong> bond borrowing as a match for Federal funds and to smooth the sharp peak that hadbeen anticipated in debt service over the next decade, as a result <strong>of</strong> prior borrowing. These steps are detailed below.<strong>Transportation</strong> <strong>2035</strong> (2012 Update)<strong>State</strong> Guide Plan Element 611<strong>Rhode</strong> <strong>Island</strong> <strong>State</strong>wide <strong>Planning</strong> ProgramPage 3-9
December 2012INCREASE REGISTRATION AND LICENSE FEES, ALLOCATE RHODE ISLAND CAPITAL PLAN (RICAP) FUNDSDuring the 2011 General Assembly session, legislation was enacted that will gradually replace bond borrowing with registration and license fees, along with<strong>Rhode</strong> <strong>Island</strong> Capital Plan (RICAP) funds. These funds will be collected in the <strong>Rhode</strong> <strong>Island</strong> Highway Maintenance Trust Fund. Registration and license feeincreases will be phased-in over a three year period, and by 2016 there will be no bond funds required to match federal funds. The table below shows the shiftfrom bond funds tonew<strong>State</strong> sources.Shift from Bond Funds to New <strong>State</strong> Funding SourcesFY 2012 - FY 2018Source FY 2012 FY 2013 FY 2014 FY 2015 FY 2016 FY 2017 FY 2018Increase 2-Year Registrations by $30 $ - $ - $ 3.9 $ 7.8 $ 11.7 $ 11.7 $ 11.7Increase 1-Year Registrations by $15 $ - $ - $ 1.6 $ 3.2 $ 4.8 $ 4.8 $ 4.8Increase License Fees by $30 $ - $ - $ 1.5 $ 3.0 $ 4.5 $ 4.5 $ 4.5<strong>Rhode</strong> <strong>Island</strong> Capital Plan Fund (RICAP) $ - $ 20.0 $ 20.0 $ 20.0 $ 20.0 $ 20.0 $ 20.0Total New Sources $ - $ 20.0 $ 27.0 $ 34.0 $ 41.0 $ 41.0 $ 41.0<strong>State</strong> Match Needed $ 40.0 $ 40.0 $ 40.0 $ 40.0 $ 40.0 $ 40.0 $ 40.0Balance Required from Bonds $ 40.0 $ 20.0 $ 13.0 $ 6.0 $ - $ - $ -REFINANCING OF GENERAL OBLIGATION BONDS AND LIMITED STATE DEBT RELIEFThe <strong>State</strong> Budget Office refinanced existing General Obligation bonds to s<strong>of</strong>ten a sharp peak in debt service payments. Although the refinancing has a net cost<strong>of</strong> $5 million over the full term, the immediate savings are substantial, as shown in the table to the right.At the same time, the General Assembly included $8 million in General Revenue for RIDOT operations in FY 2013 to <strong>of</strong>fset reduced gas tax revenue andincreased operating costs. The Governor has proposed greater debt relief in his five-year plan ($10 million in FY 2014; $20 million in FY 2015; $30 million in FY2016; and $40 million in FY 2017), but the funds do not have a specific source and have not yet been allocated for transportation purposes.<strong>Transportation</strong> <strong>2035</strong> (2012 Update)<strong>State</strong> Guide Plan Element 611<strong>Rhode</strong> <strong>Island</strong> <strong>State</strong>wide <strong>Planning</strong> ProgramPage 3-10
December 2012The table on the right shows the funds expected to be provided to RIDOT from the gas tax through <strong>2035</strong>.The table also shows the expected RIDOT expenditures out <strong>of</strong> the gas tax (debt service and operatingcosts) for the same period, based on revised debt service costs after refinancing and the elimination <strong>of</strong>future bonds. Gas tax receipts are projected to experience slow growth beginning in FY 2015, rising froma yield <strong>of</strong> $4.2 million per penny in FY 2013 to a yield <strong>of</strong> $4.4 million per penny in FY <strong>2035</strong>.RIPTA’S USE OF STATE FUNDSRIPTA uses state gas tax funding to support all aspects <strong>of</strong> its annual budget, operations, maintenance,and local shares <strong>of</strong> grant programs. While RIPTA has other sources <strong>of</strong> revenue, such as passengerrevenue, contract revenue for services, advertising/rent, and federal funds, gas tax revenue is the largestsingle share, providing over 40 percent <strong>of</strong> the agency’s funds in recent years.While RIPTA has been making many investments in efficiency, bus service requires one driver for eachvehicle. The agency’s expenditures have typically been 70 percent labor, and expenditures are budgetedto increase each year due to inflationary pressures on the cost <strong>of</strong> labor. Therefore changes in gas taxrevenue directly affect the agency’s ability to provide service.In responding to budget challenges, RIPTA must act in accordance with labor agreements, and thereforechanges in service can only be implemented at one <strong>of</strong> three times during the year. RIPTA is required byfederal and state regulations to hold public hearings before making major service cuts or fare increases.Taken together, these procedural constraints mean that if RIPTA’s budget is reduced in June, RIPTA willnot be able to cut its operating costs until January <strong>of</strong> the following year. The agency is then faced withtrying to spread an annualized level <strong>of</strong> budget reduction over the space <strong>of</strong> half a year.RIDOT Operating Revenue & CostsFiscalYearGas TaxRevenueDebtServiceAvailable forOperations2013 $ 91.8 $ 41.2 $ 50.62014 $ 91.8 $ 38.5 $ 53.32015 $ 92.3 $ 45.0 $ 47.32016 $ 92.4 $ 47.2 $ 45.22017 $ 92.6 $ 46.8 $ 45.82018 $ 92.6 $ 40.7 $ 51.92019 $ 92.7 $ 39.7 $ 53.02020 $ 92.7 $ 36.8 $ 55.92021 $ 92.8 $ 43.0 $ 49.82022 $ 92.8 $ 40.2 $ 52.72023 $ 92.9 $ 39.6 $ 53.32024 $ 92.9 $ 31.2 $ 61.82025 $ 93.0 $ 28.3 $ 64.72026 $ 93.0 $ 28.3 $ 64.72027 $ 93.1 $ 25.0 $ 68.12028 $ 93.1 $ 23.4 $ 69.82029 $ 93.2 $ 16.9 $ 76.32030 $ 93.2 $ 16.8 $ 76.52031 $ 93.3 $ 7.3 $ 86.02032 $ 93.3 $ 7.3 $ 86.02033 $ 93.3 $ 3.5 $ 89.92034 $ 93.4 $ 1.6 $ 91.8<strong>2035</strong> $ 93.4 $ 0.5 $ 92.9Total $ 2,135.6 $ 648.8 $ 1,487.3When gas prices increase sharply, consumers tend to limit their purchase <strong>of</strong> gasoline. At the same time,ridership tends to increase as people turn to a less expensive alternative to cars. Therefore an increase in gasoline costs has a two-fold effect on RIPTA’sbudget: high gas prices both decrease gas tax revenue and increase the need for service.Transit bonding levels vary from year to year, depending on the need for bus replacement. In the past, RIPTA has used bond funds to meet Federal matchrequirements for the procurement <strong>of</strong> buses. RIPTA makes quarterly payments on the debt service for these bonds. Current repayments make upapproximately 1 percent <strong>of</strong> the agency’s annual operating budget. In moving forward, the General Assembly has discontinued the practice <strong>of</strong> bonding,replacing bond funds with <strong>State</strong> Fleet Revolving Loan Funds. The <strong>State</strong> Fleet Revolving Loan Fund requires repayment by RIPTA, but the intent <strong>of</strong> the General<strong>Transportation</strong> <strong>2035</strong> (2012 Update)<strong>State</strong> Guide Plan Element 611<strong>Rhode</strong> <strong>Island</strong> <strong>State</strong>wide <strong>Planning</strong> ProgramPage 3-11
December 2012Assembly and the Administration was to provide a source <strong>of</strong> matching funds that would not require repayment. At this time, RIPTA anticipates thatrepayments will continue to be an ongoing part <strong>of</strong> the agency’s budget. It should be noted that RICAP funds do not need to be repaid by RIPTA.Another source <strong>of</strong> capital match for RIPTA is the Capital Revolving Loan Fund. The fund is used by RIPTA to match the cost <strong>of</strong> major capital projects. The fundsare repaid by at a rate no less than 1 percent below the market rate. Other sources <strong>of</strong> match currently used are gas tax proceeds (to meet certain capital matchand preventive maintenance requirements) and the RI Capital Fund, when appropriated for specific projects.The combination <strong>of</strong> sources may not be enough to meet RIPTA’s annual match requirements. This can cause delay in project implementation and provision <strong>of</strong>services. Tight operating budgets sometimes prevent RIPTA from providing the local match needed to utilize the available grant funds.RIPTA has received, almost annually, discretionary grants to purchase buses and build facilities. These grants are not a guaranteed source <strong>of</strong> funding, which,considering RIPTA’s budget difficulties could cause major capital funding shortfalls if discretionary funds are no longer available.ALTERNATIVES TO ADDRESS STATE FUNDING SHORTFALLOver the past decade, construction costs increased dramatically with no corresponding increase in funding sources. As a result, many projects have beendeferred to future years, and the “project pipeline” remains full. This FY 2013-2016 TIP includes an appendix to show recommended unprogrammed projects,planned to be undertaken in future years, beyond the lifespan <strong>of</strong> the FY 2013 - 2016 TIP.Two panels, detailed below, have been convened and two reports have been produced since 2008 that have impacted transportation funding and have helpedto ensure that some fundamental changes have been enacted. Although progress has been made in reaching the goals iterated by the panels, there is still asignificant shortfall in funding and further action required to preserve our transportation infrastructure and services.BLUE RIBBON PANEL ON TRANSPORTATION FUNDING (2008)In order to address the dire funding shortfall faced by the <strong>State</strong>, former Governor Carcieri convened a Blue Ribbon Task Force to investigate potential newrevenue sources. The Panel concluded that RIDOT would need to double its investment in annual spending on infrastructure improvement – an estimated$300 million – each year for the next 10 years just to bring the current network <strong>of</strong> roads in bridges to a state <strong>of</strong> good repair. The report does include fundingscenarios for this level <strong>of</strong> investment and also a less-aggressive scenario <strong>of</strong> increasing the yearly investment in transportation by 50 percent, or about $150million.The Blue Ribbon Panel report made the following recommendations to restore and retain the <strong>State</strong>’s highway system bridges and roads in good condition:• Repair or replace all structurally deficient local and state-owned bridges at the rate <strong>of</strong> about 26 bridges per year.<strong>Transportation</strong> <strong>2035</strong> (2012 Update)<strong>State</strong> Guide Plan Element 611<strong>Rhode</strong> <strong>Island</strong> <strong>State</strong>wide <strong>Planning</strong> ProgramPage 3-12
December 2012• Complete more than 20 major bridge and highway projects, each having a cost greater than $10 million.• Totally reconstruct 20 lane-miles <strong>of</strong> roadway per year.• Resurface 120 lane-miles <strong>of</strong> roadway, including replacement <strong>of</strong> approximately 34 miles <strong>of</strong> sidewalk associated with these projects.• Fully fund preventive maintenance activities essential to the cost-effective management <strong>of</strong> the <strong>State</strong>’s roads and bridges including: bridge paintingand washing, deck joint repair, overlay and crack sealing <strong>of</strong> roadways.• Fully fund essential operations and maintenance activities including: bridge inspection, drainage improvements, pavement striping, traffic signal repairand replacement, signing and lighting improvements and repair, replacement <strong>of</strong> damaged hardware, landscaping maintenance and improvements.• Fully fund essential roadway maintenance activities such as snow removal, grass cutting, minor highway and bridge repairs, and drainage structurerepair and cleaning.SENATE COMMISSION ON SUSTAINABLE TRANSPORTATION FUNDINGIn the spring <strong>of</strong> 2011, the <strong>Rhode</strong> <strong>Island</strong> Senate convened the Senate Commission on Sustainable <strong>Transportation</strong> Funding. The Commission held six (6) meetings,which included presentations from staff members <strong>of</strong> the Senate Fiscal Office, the <strong>Rhode</strong> <strong>Island</strong> Department <strong>of</strong> <strong>Transportation</strong> (RIDOT), the Department <strong>of</strong>Administration’s <strong>Division</strong> <strong>of</strong> <strong>Planning</strong>, the <strong>Rhode</strong> <strong>Island</strong> Public Transit Authority (RIPTA), the <strong>Rhode</strong> <strong>Island</strong> Turnpike and Bridge Authority (RITBA), and theFederal Highway Administration (FHWA). The Commission also examined transportation funding trends across states, among quasi-public agencies, and at thefederal level.The Commission established transportation funding priorities and listed transportation funding opportunities.<strong>Transportation</strong> Funding Priorities• Eliminate bonding to provide the state match for federal funds.• No new bonds: replace with alternate sources.• Eliminate debt service payments and reallocate gas tax revenue for operations and maintenance.• Provide additional funding for Department <strong>of</strong> <strong>Transportation</strong> operations, maintenance, and capital.• Provide additional funding for local roads and RIPTA.<strong>Transportation</strong> Funding Opportunities• Establish a <strong>Transportation</strong> Trust Fund to implement the stated priorities.• Increase motor vehicle registration and license fees and dedicate solely to transportation in accordance with the stated priorities.<strong>Transportation</strong> <strong>2035</strong> (2012 Update)<strong>State</strong> Guide Plan Element 611<strong>Rhode</strong> <strong>Island</strong> <strong>State</strong>wide <strong>Planning</strong> ProgramPage 3-13
December 2012• Dedicate transportation-related fees to the <strong>Transportation</strong> Trust Fund in accordance with the stated priorities. The Commission recognizes that thiscreates a funding gap in the General Fund.• Consider tolls on the I-95 corridor, or other locations, after appropriate impact study.• Consider commercial enterprise at highway rest stops in <strong>Rhode</strong> <strong>Island</strong>.• Advocate for increased funding in the upcoming federal transportation authorization.• Consider seeking public/private partnerships where feasible.• Continue to examine new methods <strong>of</strong> funding transportation projects.• Consider conducting an in-depth and comprehensive Vehicle Miles Traveled (VMT) fee study, including economic, privacy, and environmental factors.There is a clear understanding that the funding provided through both existing <strong>State</strong> and Federal sources is insufficient to meet our transportationinfrastructure needs. Furthermore, <strong>Rhode</strong> <strong>Island</strong> is not alone: every state is facing an uncertain future for Federal transportation funding, and every state hasunmet transportation infrastructure needs. The American Association <strong>of</strong> <strong>State</strong> Highway and <strong>Transportation</strong> Officials (AASHTO) has estimated an annual fundinggap <strong>of</strong> $135 billion at the national level.<strong>Rhode</strong> <strong>Island</strong> has taken the first, formative steps to resolve the funding gap by passage <strong>of</strong> a measure to eliminate future bond borrowing and replace the <strong>State</strong>match with revenue from more sustainable sources. Further change is needed, a fact recognized by both the Executive and Legislative branches <strong>of</strong>government in <strong>Rhode</strong> <strong>Island</strong>. Several proposals have been made to increase and diversify revenue streams: these proposals are being analyzed in an effort t<strong>of</strong>ind the most equitable and sustainable sources <strong>of</strong> funding for future transportation infrastructure needs.FISCAL CONSTRAINT ANALYSISThe table below shows <strong>Rhode</strong> <strong>Island</strong>’s historic and projected Highway and Transit Program funding allocations from 2009 – <strong>2035</strong>. For 2013 and beyond, thetable is based on anticipated FHWA, FTA, and <strong>State</strong> funding. The funding allocation is displayed by major TIP program and project.<strong>Transportation</strong> <strong>2035</strong> (2012 Update)<strong>State</strong> Guide Plan Element 611<strong>Rhode</strong> <strong>Island</strong> <strong>State</strong>wide <strong>Planning</strong> ProgramPage 3-14
December 2012ALLOCATION OF HIGHWAY FUNDS TO PROJECT CATEGORIES(Federal and <strong>State</strong> Funds Shown - $ Millions)Category / Project 2009 2010 2011 2012 2013 2014 2015 2016 2017 2018 2019 2020 2021 2022 2023 2024 2025 2026 2027 2028 2029 2030 2031 2032 2033 2034 <strong>2035</strong>ExpendituresActualPlannedAdministrative $ 0.82 $ 0.83 $ 1.10 $ 1.10 $ 1.10 $ 1.10 $ 1.10 $ 1.10 $ 1.13 $ 1.17 $ 1.20 $ 1.20 $ 1.24 $ 1.28 $ 1.31 $ 1.35 $ 1.39 $ 1.44 $ 1.48 $ 1.52 $ 1.57 $ 1.62 $ 1.66 $ 1.71 $ 1.77 $ 1.82 $ 1.87 $ 34.33Project Change Orders $ 4.19 $ - $ 10.00 $ 10.00 $ 8.00 $ 8.00 $ 8.00 $ 8.00 $ 8.24 $ 8.49 $ 8.74 $ 8.74 $ 9.00 $ 9.27 $ 9.55 $ 9.84 $ 10.13 $ 10.44 $ 10.75 $ 11.07 $ 11.41 $ 11.75 $ 12.10 $ 12.46 $ 12.84 $ 13.22 $ 13.62 $ 253.68Flood Emergency Projects $ - $ 18.63 $ - $ - $ - $ - $ - $ - $ - $ - $ - $ - $ - $ - $ - $ - $ - $ - $ - $ - $ - $ - $ - $ - $ - $ - $ - $ -Bike/Pedestrian Program $ 1.77 $ 1.97 $ 4.73 $ 3.70 $ 12.41 $ 9.13 $ 5.13 $ 5.14 $ 5.29 $ 5.45 $ 5.62 $ 5.62 $ 5.79 $ 5.96 $ 6.14 $ 6.32 $ 6.51 $ 6.71 $ 6.91 $ 7.11 $ 7.33 $ 7.55 $ 7.77 $ 8.01 $ 8.25 $ 8.50 $ 8.75 $ 169.82Bridge Program $ 54.78 $ 42.75 $ 57.55 $ 49.79 $ 39.50 $ 41.50 $ 41.75 $ 46.00 $ 47.38 $ 48.80 $ 50.27 $ 51.77 $ 53.33 $ 62.00 $ 77.00 $ 79.31 $ 81.69 $ 84.14 $ 86.66 $ 89.26 $ 91.94 $ 94.70 $ 97.54 $ 100.47 $ 103.48 $ 106.59 $ 109.78 $ 1,792.21CMAQ Program $ 4.12 $ 8.61 $ 10.80 $ 9.00 $ 10.30 $ 10.30 $ 10.30 $ 10.30 $ 10.61 $ 10.93 $ 11.26 $ 11.26 $ 11.59 $ 11.94 $ 12.30 $ 12.67 $ 13.05 $ 13.44 $ 13.84 $ 14.26 $ 14.69 $ 15.13 $ 15.58 $ 16.05 $ 16.53 $ 17.02 $ 17.54 $ 320.66Enhancement Program $ 4.60 $ 3.36 $ 4.20 $ 4.00 $ 4.00 $ 4.00 $ 4.00 $ 4.00 $ 4.12 $ 4.24 $ 4.37 $ 4.37 $ 4.50 $ 4.64 $ 4.78 $ 4.92 $ 5.07 $ 5.22 $ 5.38 $ 5.54 $ 5.70 $ 5.87 $ 6.05 $ 6.23 $ 6.42 $ 6.61 $ 6.81 $ 125.04Highway Program $ 20.96 $ 16.15 $ 11.30 $ 16.00 $ 39.40 $ 26.75 $ 22.30 $ 11.50 $ 11.85 $ 12.20 $ 12.57 $ 12.57 $ 12.94 $ 13.33 $ 13.73 $ 14.14 $ 14.57 $ 15.00 $ 15.46 $ 15.92 $ 16.40 $ 16.89 $ 17.39 $ 17.92 $ 18.45 $ 19.01 $ 19.58 $ 417.16Interstate Program $ 23.60 $ 7.27 $ 16.50 $ 32.50 $ 13.50 $ 12.50 $ 15.50 $ 18.00 $ 18.54 $ 19.10 $ 19.67 $ 19.67 $ 20.26 $ 20.87 $ 21.49 $ 22.14 $ 22.80 $ 23.49 $ 24.19 $ 24.92 $ 25.66 $ 26.43 $ 27.23 $ 28.04 $ 28.88 $ 29.75 $ 30.64 $ 562.27GARVEE Debt Service $ 45.18 $ 47.18 $ 48.38 $ 48.39 $ 48.40 $ 48.40 $ 48.40 $ 52.60 $ 52.80 $ 52.80 $ 43.80 $ 43.50 $ 43.20 $ - $ - $ - $ - $ - $ - $ - $ - $ - $ - $ - $ - $ - $ - $ 530.67<strong>Planning</strong> $ 7.56 $ 6.71 $ 5.80 $ 5.80 $ 5.80 $ 5.80 $ 5.80 $ 6.00 $ 6.18 $ 6.37 $ 6.56 $ 6.56 $ 6.75 $ 6.96 $ 7.16 $ 7.38 $ 7.60 $ 7.83 $ 8.06 $ 8.31 $ 8.55 $ 8.81 $ 9.08 $ 9.35 $ 9.63 $ 9.92 $ 10.21 $ 186.26Pavement ManagementProgram$ 61.41 $ 26.76 $ 51.66 $ 28.41 $ 26.80 $ 31.00 $ 30.00 $ 30.00 $ 30.90 $ 31.83 $ 32.78 $ 32.78 $ 33.77 $ 34.78 $ 35.82 $ 36.90 $ 38.00 $ 39.14 $ 40.32 $ 41.53 $ 42.77 $ 44.06 $ 45.38 $ 46.74 $ 48.14 $ 49.59 $ 51.07 $ 954.16Study & Development $ - $ - $ 1.00 $ 1.00 $ 1.50 $ 1.50 $ 1.50 $ 1.50 $ 3.00 $ 3.09 $ 3.18 $ 3.18 $ 3.28 $ 3.38 $ 3.48 $ 3.58 $ 3.69 $ 3.80 $ 3.91 $ 4.03 $ 4.15 $ 4.28 $ 4.41 $ 4.54 $ 4.67 $ 4.81 $ 4.96 $ 81.43Traffic Safety Program $ 27.13 $ 19.02 $ 30.00 $ 30.00 $ 30.50 $ 30.50 $ 33.50 $ 30.50 $ 31.42 $ 32.36 $ 33.33 $ 33.33 $ 34.33 $ 35.36 $ 36.42 $ 37.51 $ 38.64 $ 39.80 $ 40.99 $ 42.22 $ 43.49 $ 44.79 $ 46.13 $ 47.52 $ 48.94 $ 50.41 $ 51.92 $ 953.89I-195 Relocation $ - $ - $ 37.12 $ 28.80 $ 37.90 $ 22.70 $ 8.60 $ 1.10 $ - $ - $ - $ - $ - $ - $ - $ - $ - $ - $ - $ - $ - $ - $ - $ - $ - $ - $ - $ 136.22Washington Pedestrian Bridge $ - $ - $ - $ - $ 12.50 $ 7.88 $ 0.50 $ - $ - $ - $ - $ - $ - $ - $ - $ - $ - $ - $ - $ - $ - $ - $ - $ - $ - $ - $ - $ 20.88I-95 Pawtucket Bridge 550 $ 1.23 $ 65.28 $ 11.50 $ 11.50 $ 20.00 $ - $ - $ - $ - $ - $ - $ - $ - $ - $ - $ - $ - $ - $ - $ - $ - $ - $ - $ - $ - $ - $ - $ 43.00Providence Viaduct $ - $ 3.45 $ 3.00 $ 4.00 $ 11.00 $ 20.00 $ 20.00 $ 20.00 $ 20.00 $ 20.00 $ 20.00 $ 20.00 $ 20.00 $ 10.00 $ - $ - $ - $ - $ - $ - $ - $ - $ - $ - $ - $ - $ - $ 188.00Sakonnet River Bridge $ 4.35 $ 6.17 $ 18.90 $ 14.30 $ 22.50 $ - $ - $ - $ - $ - $ - $ - $ - $ - $ - $ - $ - $ - $ - $ - $ - $ - $ - $ - $ - $ - $ - $ 55.70Other Potential Projects $ - $ - $ - $ - $ 8.90 $ 6.72 $ 10.32 $ 10.36 $ 5.60 $ 2.50 $ 11.32 $ 12.94 $ 10.37 $ 64.20 $ 57.61 $ 53.50 $ 49.42 $ 45.05 $ 40.60 $ 35.74 $ 30.80 $ 25.20 $ 21.40 $ 17.20 $ 12.00 $ 6.50 $ 0.80 $ 539.05Total $ 261.70 $ 274.14 $ 323.54 $ 298.29 $ 354.01 $ 287.78 $ 266.70 $ 256.10 $ 257.06 $ 259.32 $ 264.66 $ 267.49 $ 270.35 $ 283.96 $ 286.80 $ 289.56 $ 292.56 $ 295.49 $ 298.55 $ 301.43 $ 304.46 $ 307.07 $ 311.72 $ 316.23 $ 320.01 $ 323.75 $ 327.56 $ 7,364.42RevenuesFHWA Earmark Funds $ 6.00 $ 1.00 $ 30.00 $ 3.20 $ 2.60 $ - $ - $ - $ - $ - $ - $ - $ - $ - $ - $ - $ - $ - $ - $ - $ - $ - $ - $ - $ - $ 42.80Flood Funds Recovered $ 17.00 $ - $ - $ - $ - $ - $ - $ - $ - $ - $ - $ - $ - $ - $ - $ - $ - $ - $ - $ - $ - $ - $ - $ - $ - $ 17.00Estimated FHWA Federal Funds $ 228.00 $ 228.00 $ 214.00 $ 214.00 $ 214.00 $ 214.00 $ 216.14 $ 218.30 $ 220.48 $ 222.69 $ 224.92 $ 227.17 $ 229.44 $ 231.73 $ 234.05 $ 236.39 $ 238.75 $ 241.14 $ 243.55 $ 245.99 $ 248.45 $ 250.93 $ 253.44 $ 255.98 $ 258.54 $ 5,810.07TIGER Grant $ 10.00 $ - $ - $ - $ - $ - $ - $ - $ - $ - $ - $ - $ - $ - $ - $ - $ - $ - $ - $ - $ - $ - $ - $ 10.00GARVEE Proceeds $ 37.12 $ 28.80 $ 42.70 $ 7.90 $ 9.10 $ 1.10 $ - $ - $ - $ - $ - $ - $ - $ - $ - $ - $ - $ - $ - $ - $ - $ - $ - $ - $ - $ 126.72Land Sales $ - $ - $ 17.30 $ 22.70 $ - $ - $ - $ - $ - $ - $ - $ - $ - $ - $ - $ - $ - $ - $ - $ - $ - $ - $ - $ - $ - $ 40.00<strong>State</strong> Match Bonds $ 35.40 $ 40.50 $ 20.00 $ 13.00 $ 7.00 $ - $ - $ - $ - $ - $ - $ - $ - $ - $ - $ - $ - $ - $ - $ - $ - $ - $ - $ - $ - $ 115.90<strong>State</strong> Match RICAP Funds $ - $ - $ 20.00 $ 20.00 $ 20.00 $ 20.00 $ 20.00 $ 20.00 $ 20.00 $ 20.00 $ 20.00 $ 20.00 $ 20.00 $ 20.00 $ 20.00 $ 20.00 $ 20.00 $ 20.00 $ 20.00 $ 20.00 $ 20.00 $ 20.00 $ 20.00 $ 20.00 $ 20.00 $ 460.00<strong>State</strong> Match Registration Fees $ - $ - $ - $ 7.00 $ 14.00 $ 21.00 $ 21.00 $ 21.00 $ 21.00 $ 21.00 $ 21.00 $ 21.00 $ 21.00 $ 21.00 $ 21.00 $ 21.00 $ 21.00 $ 21.00 $ 21.00 $ 21.00 $ 21.00 $ 21.00 $ 21.00 $ 21.00 $ 21.00 $ 441.00<strong>State</strong> Other Funds $ - $ - $ - $ - $ - $ - $ - $ - $ 3.20 $ 3.80 $ 4.40 $ 15.80 $ 16.40 $ 16.90 $ 17.60 $ 18.10 $ 18.70 $ 19.30 $ 19.90 $ 20.10 $ 22.30 $ 24.30 $ 25.60 $ 26.70 $ 28.10 $ 301.20Total $ 323.52 $ 298.30 $ 354.00 $ 287.80 $ 266.70 $ 256.10 $ 257.14 $ 259.30 $ 264.68 $ 267.49 $ 270.32 $ 283.97 $ 286.84 $ 289.63 $ 292.65 $ 295.49 $ 298.45 $ 301.44 $ 304.45 $ 307.09 $ 311.75 $ 316.23 $ 320.04 $ 323.68 $ 327.64 $ 7,335.60Total 2011 to<strong>2035</strong><strong>Transportation</strong> <strong>2035</strong> (2012 Update)<strong>State</strong> Guide Plan Element 611<strong>Rhode</strong> <strong>Island</strong> <strong>State</strong>wide <strong>Planning</strong> ProgramPage 3-15
December 2012ALLOCATION OF COMMUTER FUNDS TO PROJECT CATEGORIES(Federal and <strong>State</strong> Funds Shown - $ Millions)Category / Project 2009 2010 2011 2012 2013 2014 2015 2016 2017 2018 2019 2020 2021 2022 2023 2024 2025 2026 2027 2028 2029 2030 2031 2032 2033 2034 <strong>2035</strong>Total 2011 to<strong>2035</strong>ExpendituresOperations $ - $ - $ 3.62 $ 5.10 $ 5.00 $ 5.15 $ 5.30 $ 5.46 $ 5.63 $ 5.80 $ 5.97 $ 6.15 $ 6.33 $ 6.52 $ 6.72 $ 6.92 $ 7.13 $ 7.34 $ 7.56 $ 7.79 $ 8.02 $ 8.26 $ 8.51 $ 8.77 $ 9.03 $ 9.30 $ 9.58 $ 170.98Stations $ 14.22 $ 27.90 $ - $ - $ - $ - $ 1.55 $ 3.00 $ 10.00 $ 18.00 $ 15.00 $ 3.00 $ - $ - $ - $ - $ - $ - $ - $ - $ - $ - $ - $ - $ - $ - $ - $ 50.55Facilities & Equipment $ 0.46 $ - $ - $ 3.96 $ - $ - $ - $ - $ - $ - $ - $ - $ - $ - $ - $ - $ - $ - $ - $ - $ - $ - $ - $ - $ - $ - $ - $ 3.96South County Rail SupportProjects - Either Stations or $ - $ - $ - $ - $ 3.00 $ 3.09 $ 3.18 $ 3.28 $ 3.38 $ 3.48 $ 3.58 $ 3.69 $ 3.80 $ 3.91 $ 4.03 $ 4.15 $ 4.28 $ 4.41 $ 4.54 $ 4.67 $ 4.81 $ 4.96 $ 5.11 $ 5.26 $ 5.42 $ 5.58 $ 5.75 $ 97.36EquipmentTotal $ 14.68 $ 27.90 $ 3.62 $ 9.06 $ 8.00 $ 8.24 $ 10.04 $ 11.74 $ 19.00 $ 27.27 $ 24.55 $ 12.84 $ 10.13 $ 10.44 $ 10.75 $ 11.07 $ 11.41 $ 11.75 $ 12.10 $ 12.46 $ 12.84 $ 13.22 $ 13.62 $ 14.03 $ 14.45 $ 14.88 $ 15.33 $ 322.85RevenuesARRA $ 0.46 $ 4.35 $ - $ - $ - $ - $ - $ - $ - $ - $ - $ - $ - $ - $ - $ - $ - $ - $ - $ - $ - $ - $ - $ - $ - $ - $ - $ -New Start $ 2.73 $ 15.56 $ - $ - $ - $ - $ 1.24 $ 2.40 $ 4.00 $ 8.00 $ 7.40 $ - $ - $ - $ - $ - $ - $ - $ - $ - $ - $ - $ - $ - $ - $ - $ - $ 23.04Rail Modernization $ 8.65 $ 3.28$ 2.40 $ 2.47 $ 2.55 $ 2.62 $ 2.70 $ 2.78 $ 2.87 $ 2.95 $ 3.04 $ 3.13 $ 3.23 $ 3.32 $ 3.42 $ 3.52 $ 3.63 $ 3.74 $ 3.85 $ 3.97 $ 4.09 $ 4.21 $ 4.33 $ 4.46 $ 4.60 $ 77.89CMAQ Funds Transferred toFTA$ - $ - $ 3.62 $ 5.10 $ 5.00 $ 1.00 $ - $ - $ 2.00 $ 2.00 $ 2.00 $ 2.00 $ - $ - $ - $ - $ - $ - $ - $ - $ - $ - $ - $ - $ - $ - $ - $ 22.72TCSP/Other Discretionary $ - $ - $ - $ 3.96 $ - $ - $ - $ - $ 1.00 $ 1.00 $ 1.00 $ - $ - $ - $ - $ - $ - $ - $ - $ - $ - $ - $ - $ - $ - $ - $ - $ 6.96Local/Private/Other $ - $ 0.49 $ - $ - $ - $ - $ 0.31 $ 0.60 $ 2.00 $ 5.00 $ 2.60 $ 1.00 $ - $ - $ - $ - $ - $ - $ - $ - $ - $ - $ - $ - $ - $ - $ - $ 11.51<strong>State</strong> Operating Subsidy $ - $ - $ - $ - $ - $ 4.15 $ 5.30 $ 5.46 $ 5.63 $ 5.80 $ 5.97 $ 6.15 $ 6.33 $ 6.52 $ 6.72 $ 6.92 $ 7.13 $ 7.34 $ 7.56 $ 7.79 $ 8.02 $ 8.26 $ 8.51 $ 8.77 $ 9.03 $ 9.30 $ 9.58 $ 156.26<strong>State</strong> Match GO Bonds/RICAPFunds$ 2.84 $ 4.22 $ - $ - $ - $ - $ - $ - $ 1.00 $ 2.00 $ 2.00 $ - $ - $ - $ - $ - $ - $ - $ - $ - $ - $ - $ - $ - $ - $ - $ - $ 5.00MBTA Match $ - $ - $ - $ - $ 0.60 $ 0.62 $ 0.64 $ 0.66 $ 0.68 $ 0.70 $ 0.72 $ 0.74 $ 0.76 $ 0.78 $ 0.81 $ 0.83 $ 0.86 $ 0.88 $ 0.91 $ 0.93 $ 0.96 $ 0.99 $ 1.02 $ 1.05 $ 1.08 $ 1.12 $ 1.15 $ 19.47Total $ 14.68 $ 27.90 $ 3.62 $ 9.06 $ 8.00 $ 8.24 $ 10.04 $ 11.74 $ 19.00 $ 27.27 $ 24.55 $ 12.84 $ 10.13 $ 10.44 $ 10.75 $ 11.07 $ 11.41 $ 11.75 $ 12.10 $ 12.46 $ 12.84 $ 13.22 $ 13.62 $ 14.03 $ 14.45 $ 14.88 $ 15.33 $ 322.85<strong>Transportation</strong> <strong>2035</strong> (2012 Update)<strong>State</strong> Guide Plan Element 611<strong>Rhode</strong> <strong>Island</strong> <strong>State</strong>wide <strong>Planning</strong> ProgramPage 3-16
December 2012ALLOCATION OF FEDERAL TRANSIT ADMINISTRATION FUNDS TO PROJECT CATEGORIESCategory / Project 2009 2010 2011 2012 2013 2014 2015 2016 2017 2018 2019 2020 2021 2022 2023 2024 2025 2026 2027 2028 2029 2030 2031 2032 2033 2034 <strong>2035</strong>Expenditures(Federal and <strong>State</strong> Funds Shown - $ Millions)Total 2011 to<strong>2035</strong>5307 Urbanized Area Formula $ 34.10 $ 33.91 $ 33.80 $ 34.08 $ 33.80 $ 34.14 $ 34.49 $ 34.83 $ 35.11 $ 35.38 $ 35.75 $ 36.11 $ 36.48 $ 36.85 $ 37.23 $ 37.60 $ 37.99 $ 38.37 $ 38.76 $ 39.16 $ 39.55 $ 39.95 $ 40.36 $ 40.77 $ 41.19 $ 41.61 $ 42.03 $ 935.385310 Elderly/Disabled Vehicles $ 0.80 $ 0.80 $ 0.80 $ 0.80 $ 0.80 $ 0.80 $ 0.80 $ 0.80 $ 0.80 $ 0.80 $ 0.80 $ 0.80 $ 0.80 $ 0.80 $ 0.80 $ 0.80 $ 0.80 $ 0.80 $ 0.80 $ 0.80 $ 0.80 $ 0.80 $ 0.80 $ 0.80 $ 0.80 $ 0.80 $ 0.80 $ 20.005311 NonUrbanized AreaFormula$ 1.16 $ 1.16 $ 1.16 $ 1.23 $ 1.23 $ 1.25 $ 1.25 $ 1.28 $ 1.29 $ 1.31 $ 1.32 $ 1.33 $ 1.35 $ 1.36 $ 1.37 $ 1.39 $ 1.40 $ 1.41 $ 1.43 $ 1.44 $ 1.46 $ 1.47 $ 1.49 $ 1.50 $ 1.52 $ 1.53 $ 1.55 $ 34.305316 Job Access ReverseCommute$ 1.20 $ 1.11 $ 1.14 $ 1.15 $ 1.14 $ 1.15 $ 1.16 $ 1.17 $ 1.18 $ 1.20 $ 1.21 $ 1.22 $ 1.23 $ 1.25 $ 1.26 $ 1.27 $ 1.28 $ 1.30 $ 1.31 $ 1.32 $ 1.34 $ 1.35 $ 1.36 $ 1.38 $ 1.39 $ 1.40 $ 1.42 $ 31.575317 New Freedom $ 0.45 $ 0.45 $ 0.45 $ 0.45 $ 0.45 $ 0.46 $ 0.46 $ 0.47 $ 0.47 $ 0.48 $ 0.48 $ 0.49 $ 0.49 $ 0.50 $ 0.50 $ 0.51 $ 0.51 $ 0.52 $ 0.52 $ 0.53 $ 0.53 $ 0.54 $ 0.54 $ 0.55 $ 0.56 $ 0.56 $ 0.57 $ 12.615309 Bus and Bus Facility(discretionary)$ 6.60 $ 0.98 $ - $ 1.53 $ - $ - $ - $ - $ - $ - $ - $ - $ - $ - $ - $ - $ - $ - $ - $ - $ - $ - $ - $ - $ - $ - $ - $ 1.535308 Clean Fuel $ 8.00 $ - $ - $ - $ - $ - $ - $ - $ - $ - $ - $ - $ - $ - $ - $ - $ - $ - $ - $ - $ - $ - $ - $ - $ - $ - $ - $ -Total $ 52.31 $ 38.41 $ 37.35 $ 39.23 $ 37.42 $ 37.80 $ 38.17 $ 38.56 $ 38.86 $ 39.17 $ 39.56 $ 39.95 $ 40.35 $ 40.75 $ 41.16 $ 41.57 $ 41.98 $ 42.40 $ 42.82 $ 43.25 $ 43.68 $ 44.11 $ 44.55 $ 45.00 $ 45.45 $ 45.90 $ 46.36 $ 1,035.38RevenuesFormula FTA Grant Programs $ 29.66 $ 29.26 $ 29.59 $ 29.18 $ 29.27 $ 29.57 $ 29.85 $ 30.16 $ 30.46 $ 30.77 $ 31.07 $ 31.38 $ 31.70 $ 32.02 $ 32.34 $ 32.66 $ 32.99 $ 33.32 $ 33.65 $ 33.99 $ 34.32 $ 34.67 $ 35.01 $ 35.36 $ 35.72 $ 36.08 $ 36.44 $ 811.55Discretionary FTA GrantPrograms$ 11.68 $ 0.79 $ - $ 1.22 $ - $ - $ - $ - $ - $ - $ - $ - $ - $ - $ - $ - $ - $ - $ - $ - $ - $ - $ - $ - $ - $ - $ - $ 1.22Match - GasolineTax/Farebox/<strong>State</strong> Fleet/GO $ 10.81 $ 8.20 $ 7.60 $ 8.67 $ 7.99 $ 8.07 $ 8.15 $ 8.24 $ 8.24 $ 8.24 $ 8.32 $ 8.41 $ 8.49 $ 8.57 $ 8.66 $ 8.75 $ 8.83 $ 8.92 $ 9.01 $ 9.10 $ 9.19 $ 9.29 $ 9.38 $ 9.47 $ 9.57 $ 9.66 $ 9.76 $ 218.59BondElderly/Disabled vehicle match -RIde agencies$ 0.16 $ 0.16 $ 0.16 $ 0.16 $ 0.16 $ 0.16 $ 0.16 $ 0.16 $ 0.16 $ 0.16 $ 0.16 $ 0.16 $ 0.16 $ 0.16 $ 0.16 $ 0.16 $ 0.16 $ 0.16 $ 0.16 $ 0.16 $ 0.16 $ 0.16 $ 0.16 $ 0.16 $ 0.16 $ 0.16 $ 0.16 $ 4.00Total $ 52.31 $ 38.41 $ 37.35 $ 39.23 $ 37.42 $ 37.80 $ 38.16 $ 38.56 $ 38.86 $ 39.17 $ 39.56 $ 39.95 $ 40.35 $ 40.75 $ 41.16 $ 41.57 $ 41.98 $ 42.40 $ 42.82 $ 43.25 $ 43.68 $ 44.11 $ 44.55 $ 45.00 $ 45.45 $ 45.90 $ 46.36 $ 1,035.36<strong>Transportation</strong> <strong>2035</strong> (2012 Update)<strong>State</strong> Guide Plan Element 611<strong>Rhode</strong> <strong>Island</strong> <strong>State</strong>wide <strong>Planning</strong> ProgramPage 3-17
Part IV Environmental Analysis
December 2012PART FOUR - ENVIRONMENTAL ANALYSISThe transportation system provides tremendous benefits to the economy and to the quality <strong>of</strong> life enjoyed by <strong>Rhode</strong> <strong>Island</strong>ers. Unfortunately, past highwayconstruction practices and the sheer volume <strong>of</strong> vehicles using the state’s roadways also has various adverse impacts. This section begins with a discussion <strong>of</strong>the state’s natural resources and broaches the concept <strong>of</strong> activities that can begin to mitigate any adverse impacts on a system-wide basis. This is followed byan analysis that looks at three scenarios <strong>of</strong> growth with respect to <strong>Rhode</strong> <strong>Island</strong>’s recently adopted Land Use Plan and delineated urban services boundary andhow that affects the transportation network. There is also an Environmental Justice section that examines the distribution <strong>of</strong> benefits and burdens <strong>of</strong> thetransportation system on target populations (low-income and minority). The Air Quality Analysis section documents that the projects recommended by thisPlan are consistent with the <strong>State</strong> Implementation Plan for Air Quality.NATURAL RESOURCES AND ENVIRONMENTAL MITIGATIONThe <strong>State</strong> <strong>of</strong> <strong>Rhode</strong> <strong>Island</strong> is endowed with a wealth <strong>of</strong> natural and historic resources. Several <strong>State</strong> Guide Elements,including Land Use 2025, exist to protect these resources. The <strong>State</strong> is also fortunate to have vast GIS data layers that policymakers can use to look at the environment on a system level. The National Environmental Policy Act (NEPA) has mandatedanalysis <strong>of</strong> environmental impacts on a project level, but SAFETEA-LU requires that this be studied on a system level as well.<strong>Rhode</strong> <strong>Island</strong> <strong>State</strong>wide <strong>Planning</strong> held an Environmental Mitigation Consultation in April <strong>of</strong> 2007 to gather interested partiesand agencies to generate ideas for mitigation strategies. The agencies listed at the left participated in this session. Researchon activities undertaken by other MPO’s was presented as a platform from which to begin. <strong>Transportation</strong> 2025, <strong>Rhode</strong><strong>Island</strong>’s plan at the time, already contained many strategies and policies related to environmental stewardship. The chartbelow summarizes the discussion that was held during the Environmental Mitigation Consultation. Following the chart is amore detailed discussion <strong>of</strong> each topic area.Environmental MitigationConsultationFederal Highway AdministrationEnvironmental Protection AgencyRI Department <strong>of</strong> <strong>Transportation</strong>RI Public Transit AuthorityRI Department <strong>of</strong> EnvironmentalManagementRI Coastal ResourcesManagement CouncilRI Historic Preservation andHeritage CommissionRI <strong>State</strong>wide <strong>Planning</strong> ProgramNarragansett Indian TribeGrow Smart RISierra ClubSave the Bay<strong>Transportation</strong> <strong>2035</strong> (2012 Update)<strong>State</strong> Guide Plan Element 611RI <strong>State</strong>wide <strong>Planning</strong> ProgramPage 4-1
December 2012Environmental Mitigation ConsultationResource Impaired by ImpactAirVMT increaseVehicle emissions / idling /congestionConstruction dust/ <strong>of</strong>f-road dieselactivityParticulate matter from tires, brakepads, tailpipesHeat island effectPublic health (respiratory illness,including asthma)VegetationExisting Recommendations &ProgramsEn.2.a, En.3.c/g, D.3.bNew Mitigation StrategyOpen Space Acquisition (Plan)Diesel retr<strong>of</strong>its – <strong>State</strong> vehicles, rail,ferry, etc.Wildlife TIP Alternative modesClimate changeBicycle Pedestrian, CMAQ, andTransit ProgramsOpen Space AcquisitionSetbacks from state roads withvegetated bufferReceiving AreasResidences within 250’ feet <strong>of</strong>state roadsSediment Groundwater recharge En.2.b, En.3.c/d, Pre-treat stormwater/infiltration Drinking water suppliesWater /WetlandsStorm run<strong>of</strong>f Drinking water supplies D.3.b Use <strong>of</strong> porous pavements/recharge Vernal poolsParticulate matter from tires, brakepadsPublic healthLeaking fuels, fluids, lubricants Marine and terrestrial wildlife TIPSnow removal (salt/sand) Marine and terrestrial vegetation Open Space AcquisitionTest stormwater for effectiveness <strong>of</strong>new technologies2:1 wetland replacement (prefer onsite)SCORP wetland prioritiesCommuter lotsErosionFlood storageHighway/Enhancement Programs:Stormdrain retr<strong>of</strong>it, landscapingWetland fillingImpervious surfaceHighwaysThermal impact on coldwaterhabitatsColdwater fisheries (thermalimpacts <strong>of</strong> highway run<strong>of</strong>f)Critter crossingsStream crossings (such as Rt.4/Hunt River Crossing) that lackterrestrial crossingsWildlifeTraffic Fragmentation <strong>of</strong> habitat D.2.dCulvert designVernal pools and surroundinglands – mapping underway –<strong>State</strong>wide habitat restoration planInvasive species Roadkills Deer reflectorsRemoval <strong>of</strong> non-native speciesReduced mowing<strong>Transportation</strong> <strong>2035</strong> (2012 Update)<strong>State</strong> Guide Plan Element 611RI <strong>State</strong>wide <strong>Planning</strong> ProgramPage 4-2
December 2012Resource Impaired by ImpactExisting Recommendations &ProgramsNew Mitigation StrategyReceiving AreasEnergyCommunityFuel consumption Climate change En.3.j, En.2.a, En.3.e/f, D.2.f Incentives for efficient vehiclesElectricity for transit/ highwayoperationsEconomicPolitical stabilityFiscalCMAQNoise Economy En.3.c, D.2.a/c/d/f, D.3.bEncourage solar energyEncourage green design andconstruction practicesMeasure GHG emissions at projectlevelUse recycled materials as much aspracticableSpeed Quality <strong>of</strong> life ACI litter patrol crewsTraffic congestionHighwaysSolid waste (junk cars, tires, litter)Light pollutionSnow removal, including sidewalks(salt/sand)Fragmented open space andneighborhoodsLandfill spaceEnhancement Program<strong>Transportation</strong> Community SystemPreservation Program(discretionary))Explore use <strong>of</strong> porous / quietpavementsEnforce sidewalk snow removalUse <strong>of</strong> “grassy strips” for snowstorage/bufferCeremonial stone landscapesTribal resources / cultural /subsurfaceD.2.e, D.3.f, Lu.2.bRecognize stone landscapes in EIS/EAScenic andHistoricResourcesPower linesInfrastructureVisual qualityEnhancement Program*<strong>Transportation</strong> Community SystemPreservation Program (discretionary)Support reduction in the number andbillboards and other outdooradvertisingGraffiti removalBillboardsQuality <strong>of</strong> lifeLitterFragmented forests/ open spaces*Not an appropriate source for burial <strong>of</strong> overhead power lines.<strong>Transportation</strong> <strong>2035</strong> (2012 Update)<strong>State</strong> Guide Plan Element 611RI <strong>State</strong>wide <strong>Planning</strong> ProgramPage 4-3
December 2012AIR QUALITYA well-known system wide impact <strong>of</strong> the transportation system is degraded air quality. Exhaust from cars and trucks contribute pollutants that are regulatedby the Clean Air Act (most notable, volatile organic compounds, oxides <strong>of</strong> nitrogen, carbon monoxide and particulate matter). Through the air qualityconformity process these emissions are well documented and modeled. Rules require that transportation plans and projects do not result in furtherdegradation <strong>of</strong> air quality. The good news is that the vehicle fleet is becoming cleaner and air quality is expected to show marked improvements in the comingdecades, despite increases in vehicles mile traveled (VMT). An executive summary <strong>of</strong> the air quality conformity demonstration for this plan appears later inthis chapter. The Congestion Mitigation Air Quality Program (CMAQ) exists to improve air quality. <strong>Rhode</strong> <strong>Island</strong> will fund over $10 per year in CMAQ projectsthat include bike/pedestrian projects, South County Commuter Rail service, transit service, commuter resources, and many others. In addition, the issue <strong>of</strong>residential proximity to highways was raised by this group. This has been further explored in the Environmental Justice section, but this should be considered atarget area for mitigation measures, and a criteria under which additional points can be awarded in future CMAQ project solicitations.WATER QUALITY AND WETLANDSSee Map # 4-1Water quality is a serious issue, although not as rigorously regulated by transportation planning regulations. Water quality suffers due Water Supply andto stormwater run<strong>of</strong>f from highways (as well as privately owned parking lots) that contains fuels, oils, lubricants, salt, sand, andWellheadparticles from brake and tire wear. Sand, salt and soil erosion can also contribute large amounts <strong>of</strong> sediment and silt to run<strong>of</strong>f waters. Protection AreasSome <strong>of</strong> this run<strong>of</strong>f is filtered by natural means or treated in a wastewater facility, but some <strong>of</strong> it is collected in storm drains and runs and Map # 4-2untreated directly into water bodies. At a certain level this results in drinking water, public health, and ecological impacts. Design andWetlandsconstruction <strong>of</strong> new projects do a much better job in treating and filtering stormwater. <strong>Rhode</strong> <strong>Island</strong> also has a program <strong>of</strong> retr<strong>of</strong>ittingstorm drains to reduce the pollutant load <strong>of</strong> water that is discharged. Mitigation sites should be considered around drinking water reservoirs and wellheadrecharge areas. Porous pavements, although they can be maintenance issues during the winter, should be considered for certain overflow parking areas and inother low use situations by the state and municipalities.Wetlands are now recognized for the many purposes they serve, including provision <strong>of</strong> habitat, flood storage, groundwater recharge, etc. There are fewhighway construction projects undertaken now that will have severe wetland impacts. However, when there are impacts, 2:1 wetland replacement should bethe goal, preferably on-site. If that is not possible, <strong>of</strong>f-site receiving areas should be considered. The <strong>State</strong> Comprehensive Outdoor Recreation Plan (SCORP)identifies wetland priorities. Additionally, RIDEM is undertaking an effort to map vernal pools in the state which could also be targeted for <strong>of</strong>f-site mitigation.Vernal pools are seasonal bodies <strong>of</strong> standing water that typically form in the spring from melting snow and other run<strong>of</strong>f and dry out in the summer, providinghabitat for semi-aquatic species.<strong>Transportation</strong> <strong>2035</strong> (2012 Update)<strong>State</strong> Guide Plan Element 611RI <strong>State</strong>wide <strong>Planning</strong> ProgramPage 4-4
December 2012Preventing run<strong>of</strong>f pollution from road, highway, and bridge construction and operation requires planning, education, inspection, and maintenance. Drainagedesigns that reduce overall run<strong>of</strong>f by maximizing infiltration should be encouraged. Erosion, sediment, and run<strong>of</strong>f control plans that incorporate the mostappropriate and cost-effective “best management practices” are essential to effective pollution control. Highway personnel must be educated about therequirements <strong>of</strong> the erosion/sediment/run<strong>of</strong>f control plan. Inspection and enforcement authority are necessary to ensure awareness <strong>of</strong> and compliance withthe adopted practices. Finally, best management practices require regular maintenance to ensure that they perform optimally. Once a system has beenconstructed or improved, responsibility for maintenance should be assumed by the state or the locality. The FY 2013-2016 TIP includes a combined total <strong>of</strong> $4million for drainage improvements statewide under the stormwater retr<strong>of</strong>it item in the Traffic Safety Program. It’s important to note that RIDOT has requestedan additional $2 million annually (not included in the FY 2013 – 2016 TIP) through the Capital Budget process to address highway drainage issues and is animportant component <strong>of</strong> the overall RIDOT program.WILDLIFEWildlife considerations are a new topic in <strong>Rhode</strong> <strong>Island</strong>’s long range transportation plan. The construction <strong>of</strong> the transportationsystem has fragmented forest habitat and provides few crossing areas for animals. Potential solutions include “critter crossings” thatallow animals to safely go over or under a highway. One particular area that was noted for lack <strong>of</strong> terrestrial crossing is Route 4 whereit crosses the Hunt River. Reduced mowing along roadsides (consistent with safety practices) can provide better cover for smallanimals. Habitat can also be degraded by introduction <strong>of</strong> invasive species. It has been noted that there is a possibility <strong>of</strong> thermalimpacts to coldwater fisheries from highway run<strong>of</strong>f, but no locations were specifically noted.See Map # 4-3Rare SpeciesHabitats and Map# 4-4 ProtectedConservation andPark LandsWhile the highway system can have adverse impacts on wildlife, the opposite is also true. Large animals also present a hazard to motorists. A motorist thatstrikes a large deer may or may not walk away. Swerving to avoid animals also results in crashes. While geographic data on roadkills is not readily available,particularly deer strikes, deer reflectors should be considered for rural highways in the state. Deer are attracted to lights, so these white reflectors, placed <strong>of</strong>fthe shoulder, divert deer away from headlights <strong>of</strong> moving vehicles. Vernal pool restoration (see wetland section above) as part <strong>of</strong> a larger statewide habitatrestoration plan should be considered as appropriate.ENERGYIt is becoming increasingly important during times <strong>of</strong> global political instability, climate change, and record high fuel prices to reinvigorate our efforts todrastically reduce our fossil fuel consumption and develop more reliable and renewable sources. This will provide tremendous benefits through economicindependence and air quality. This concept is important not only for vehicle energy use, but also in transportation operations and facilities (green buildingdesign, solar powered detection equipment and signage, LED traffic lights). Most would agree that the level <strong>of</strong> fossil fuel use on this planet has resulted incarbon induced climate change. This in turn may be causing sea level rise that could threaten communities and transportation infrastructure in the future. Sea<strong>Transportation</strong> <strong>2035</strong> (2012 Update)<strong>State</strong> Guide Plan Element 611RI <strong>State</strong>wide <strong>Planning</strong> ProgramPage 4-5
December 2012level rise mapping has been undertaken in this Plan (Page 4-8). This Plan contains many strategies that encourage sustainable and responsible use <strong>of</strong> energyresources.COMMUNITY IMPACTSThere are a multitude <strong>of</strong> community impacts from the transportation system, although these may be <strong>of</strong>fset to a great extent by mobility and quality <strong>of</strong> lifebenefits provided. Noise, speed, traffic congestion, solid waste (junk cars, tires, litter), light pollution, and snow removal residue (salt/sand) can all beconsidered as adverse community impacts. To a certain extent these are unavoidable, but certain design techniques (cut-<strong>of</strong>f light fixtures, quieter pavements)can mitigate these impacts without compromising safety. Operational activities (enforcement, traffic management, and street sweeping) should be enhanced.Lastly, the use <strong>of</strong> grassy strips between the street and sidewalk can provide for a much more enjoyable pedestrian experience as well as provide space forsnow storage, groundwater recharge, vegetation, and beautification. Recycling transportation related waste (such as fuel oil) and use <strong>of</strong> recycled materials inconstruction (asphalt) is also strongly encouraged.SCENIC AND HISTORIC RESOURCESIn addition to established historic sites and districts, lesser known historic resources include ceremonial stone landscapes which were used by Native Americantribes for celebrations and rituals. As they are not identified in the NEPA process, the <strong>State</strong> should make every effort to identify andSee Map # 4-5protect these sites from development. Many <strong>of</strong> the views <strong>of</strong> <strong>Rhode</strong> <strong>Island</strong>’s forests, farms, and waterfronts are marred to someDesignated Scenicdegree by outdoor advertising, utility structures, and litter. Outdoor advertising in particular should be limited as much as possible.Areas and Map #Inmate crews should be used to the extent practicable for litter and graffiti removal. New or upgraded utility infrastructure should be4-6 Historic Sitesplaced as sensitively as possible. While there may be a visual impact, these facilities serve a public need.and DistrictsSince the Environmental Mitigation Consultation has occurred, staff has investigated two topics, dam safety and sea level rise, inwhich the environment has the potential to threaten transportation infrastructure. In both cases, more detailed investigation is required to really utilize thisinformation.DAM SAFETYThe RIDEM maintains a database <strong>of</strong> the <strong>State</strong>’s 672 dams and has classified them by the severity <strong>of</strong> the consequences <strong>of</strong> dam failure. The three classificationsinclude:• Low - No probable loss <strong>of</strong> human life (468 dams)• High - Probable loss <strong>of</strong> human loss (92 dams)• Significant - No probable loss <strong>of</strong> human life, but can cause major economic loss, disruption <strong>of</strong> lifeline facilities, ormay impact public health or safety (112 dams)See Map # 4-7Roadways Vulnerableto Dam Failure<strong>Transportation</strong> <strong>2035</strong> (2012 Update)<strong>State</strong> Guide Plan Element 611RI <strong>State</strong>wide <strong>Planning</strong> ProgramPage 4-6
December 2012A map was prepared that shows 204 dams rated High or Significant that are within 1,000 feet <strong>of</strong> a roadway. In this particular exercise, the condition <strong>of</strong> thedam was not taken into account. The topic <strong>of</strong> dam safety should receive more attention in the future. Further analysis should screen the condition <strong>of</strong> the dam,as well as the importance <strong>of</strong> the roadway. In these instances, diversionary routes should be identified in the same manner they are for Interstate highways. Afield should be added to RIDEM’s database that identifies whether the dam is in fact integral to the roadway itself. The Gainer Dam is the most prominentexample, but it is unknown how many others there are. Security, maintenance and inspection activities should be <strong>of</strong> paramount importance.SEA-LEVEL RISEThe generally accepted theory <strong>of</strong> climate change and sea-level rise is no longer a situation that is considered to be preventable. It is happening, and as wework toward reducing our carbon emissions (mitigation measures), we must also plan for impacts to our infrastructure from sea-level rise. How much andwhen are still open for debate, but the RI Coastal Resources Management Council is currently using 3-5 feet as the likely rise in the next 100 years (1-2meters). <strong>Rhode</strong> <strong>Island</strong> has over 400 miles <strong>of</strong> coastline and the low-lying areas are vulnerable to various levels <strong>of</strong> inundation. SteeplySee Map # 4-8sloped shorelines will fare better as the horizontal impact will be minimal. Flat areas like beaches, however, are most vulnerable andSea Level Riseflooding will affect a broader land area. At the time this plan was written, digital elevation data was available for areas in flood zonesand below a 3 meter elevation. These areas were mapped for informational purposes; although it is not anticipated that a 3 meter rise would occur in the2030 planning horizon. It is, however, entirely appropriate to consider a 100-year planning horizon as new bridges that are being built today have a lifeexpectancy <strong>of</strong> 50-100 years.The mapped impacted areas included parts <strong>of</strong> all the <strong>Rhode</strong> <strong>Island</strong> coastal communities including such areas as Winnapaug Pond and Atlantic Avenue,Jerusalem and Galilee, Quonset <strong>State</strong> Airport, Conimicut, Port <strong>of</strong> Providence, and downtown Newport. Individual state highway segments lying withininundated areas should be identified and categorized as to their future status (these are considered to be “adaptation” strategies):• Realign roadway on higher ground• Elevate roadway -- bridge structure• Elevate roadway – dike structure• Accept loss <strong>of</strong> roadway and identify alternate route<strong>Transportation</strong> <strong>2035</strong> (2012 Update)<strong>State</strong> Guide Plan Element 611RI <strong>State</strong>wide <strong>Planning</strong> ProgramPage 4-7
December 2012It is also important to note that bridges may not be flooded, but the clearance under the bridges will be reduced making the deck more susceptible to stormsurges and wave action. Visualizations <strong>of</strong> sea-level rise were performed by the University <strong>of</strong> <strong>Rhode</strong> <strong>Island</strong> for locations in Providence, Pawtucket, andNewport. Images <strong>of</strong> Waterplace Park in Providence appear below. More information can be found at http://seagrant.gso.uri.edu/coast/slr_tools.html .It is expected that 1-meter data will be available in the near future. <strong>State</strong>wide <strong>Planning</strong> will continue to collect the best available data and further developmapping and identification <strong>of</strong> impacted facilities into a Technical Paper to be made available to the cities and towns to assist them in undertaking this sameprocess for local roads.<strong>Transportation</strong> <strong>2035</strong> (2012 Update)<strong>State</strong> Guide Plan Element 611RI <strong>State</strong>wide <strong>Planning</strong> ProgramPage 4-8
December 2012LAND USE SCENARIO ANALYSISLand Use 2025, <strong>Rhode</strong> <strong>Island</strong>’s statewide land use plan, established a boundary called the Urban Services Area. Inside the urban area, public water andwastewater infrastructure exists to support more dense population growth. Outside this area, this infrastructure does not exist, and it is considered to be inthe <strong>State</strong>’s best interest to maintain this area in more <strong>of</strong> a rural state for scenic, environmental, fiscal, and quality <strong>of</strong> life reasons. The urban area generallyincludes everything around Narragansett Bay and the Blackstone Valley, and small areas in Burrillville, Jamestown, and Westerly. Village scale Growth Centersare also permitted in certain rural areas.A scenario planning exercise was completed by <strong>Rhode</strong> <strong>Island</strong> <strong>State</strong>wide <strong>Planning</strong> Program that looks at varying degrees <strong>of</strong> density inside the urban area andthen begins to investigate the transportation impacts that may have. The Travel Demand Model was used to analyze population and employment growth byassigning different percentages <strong>of</strong> population and employment growth to Traffic Analysis Zones (TAZ’s) inside and outside the urban area. The total numbersremain the same – only the distribution changes.Population and Employment GrowthYear Population Employment2000 1,048,319 467,2992030 1,140,543 516,048Change 92,224 48,749The three scenarios are as follows for Current Trend, Sprawl Scenario, and Compact Scenario:CURRENT TRENDThis reflects the current population and employment projections as assigned to the TAZ’s for use in forecasting VMT and emissions. This is consideredto be the best available data. The current trend shows 55 percent <strong>of</strong> the growth going to TAZ’s inside the urban area and 45 percent outside (55 / 45split).SPRAWL SCENARIOIn this scenario, the rural area absorbs more <strong>of</strong> the population and employment growth (20 percentage points more <strong>of</strong> the 2000-2030 growth than inthe Current Trend for a 35 / 65 split).COMPACT SCENARIOIn this scenario, the urban area absorbs more <strong>of</strong> the population and employment growth (30 percentage points more <strong>of</strong> the 2000-2030 growth than inthe Current Trend for an 85 / 15 split).<strong>Transportation</strong> <strong>2035</strong> (2012 Update)<strong>State</strong> Guide Plan Element 611RI <strong>State</strong>wide <strong>Planning</strong> ProgramPage 4-9
December 2012These scenarios were run in 2008 with a partially completed transit component <strong>of</strong> the travel model and based on current RIPTA ridership on individual routes.The results are as follows:Growth ScenariosPopulation Employment Daily Vehicle2030 2030Miles Traveled (DVMT)2030TransitRidership2030Urban Rural Urban Rural Urban Rural Total Urban Rural TotalCurrent Trend 55/45 855,947 284,596 438,084 77,964 16,390,489 10,355,817 26,746,306 108,475 835 109,310Sprawl Scenario 35/65 836,433 304,110 417,482 98,566 15,810,783 11,345,517 27,156,300 104,789 998 105,787change from current trend -19,514 19,514 -20,602 20,602 -579,706 989,700 409,994 -3,686 163 -3,523percent -2.3% 6.9% -4.7% 26.4% -3.5% 9.6% 1.5% -3.4% 19.5% -3.2%Compact Scenario 85/15 882,545 257,998 441,857 74,191 16,502,947 9,970,877 26,473,824 110,765 778 111,543change from current trend 26,598 -26,598 3,773 -3,773 112,458 -384,940 -272,482 2,290 -57 2,233percent 3.1% -9.3% 0.9% -4.8% 0.7% -3.7% -1.0% 2.1% -6.8% 2.0%This analysis confirms what is widely believed in the planning pr<strong>of</strong>ession: compact development is more sustainable. For example, In the Sprawl Scenario, arural population increase <strong>of</strong> 6.9 percent leads to a larger rural VMT increase <strong>of</strong> 9.6 percent. Conversely, an urban population increase <strong>of</strong> 3.1 percent in theCompact Scenario produces only a 0.7 percent increase in Urban VMT.The model also shows that total DVMT is actually reduced in the Compact Scenario (compared to the Current Trend) and increased in the Sprawl Scenario.Conversely, transit ridership decreases in the Sprawl Scenario and increases in the Compact Scenario. The reader should bear in mind that this is a daily model,and the changes on an annual basis are significant and meaningful in terms <strong>of</strong> congestion reduction and air quality benefits.This cursory look at growth scenarios is deserving <strong>of</strong> further study when the transit component <strong>of</strong> the model is complete (including commuter rail) and is fullycalibrated. At that time, further investigation into mode split, projected ridership, and travel time may reveal corridors where increased transit service isneeded.<strong>Transportation</strong> <strong>2035</strong> (2012 Update)<strong>State</strong> Guide Plan Element 611RI <strong>State</strong>wide <strong>Planning</strong> ProgramPage 4-10
December 2012ENVIRONMENTAL JUSTICE ANALYSISThe <strong>State</strong> <strong>of</strong> <strong>Rhode</strong> <strong>Island</strong> is committed to integrating the principles <strong>of</strong> environmental justice into all <strong>of</strong> our transportation planning programs and activities.This commitment to equity was first included in the Long Range <strong>Transportation</strong> Plan in <strong>Transportation</strong> 2020 (completed in 2001). A full assessment <strong>of</strong> ourplanning process, including environmental justice actions undertaken, was conducted in 2005 and 2010 as part <strong>of</strong> a federal certification review. In 2008<strong>State</strong>wide <strong>Planning</strong> conducted a benefits and burden case study <strong>of</strong> the environmental justice population based on 2000 U.S. Census data and select elements<strong>of</strong> the 2008 transportation system. Quantification <strong>of</strong> burdens was conducted on a macro level using an equation termed the “Location Quotient.” The targetpopulation’s environmental justice proximity to an interstate and bus routes was used as a variable in the 2008 case study, along with access and air qualityassumptions to calculate the measure <strong>of</strong> burden. It was determined that a higher proportion <strong>of</strong> minorities and populations below the poverty level live withinthe case study area and that there is a disproportionate burden, for example, poor air quality, with regards to the transportation systems studied. As part <strong>of</strong>this update, the location quotient analysis was employed using 2010 Census figures. This analysis found that a higher proportion <strong>of</strong> minorities and populationsbelow the poverty level continue to live within the case study area and there continues to be a disproportionate burden with regards to the transportationsystems studied.The transit program recommended in this Plan is expected to benefit minority and low-income households by increasing transit service available to them andby increasing their access to jobs and other opportunities. As part <strong>of</strong> the 2008 Plan update, a benefits analysis was conducted to determine if targetenvironmental justice populations have equitable transit access. Another demographic group that is considered in this analysis is “transit dependent” asdefined by zero-car households. The same location quotient equation used in the burdens analysis was used for this analysis for combined minority and lowincome populations. It was found that <strong>Rhode</strong> <strong>Island</strong>’s environmental justice populations, along with transit dependent populations have greater access totransit than the state population as a whole. As part <strong>of</strong> this update, the same analysis was conducted using 2010 Census figures. The findings <strong>of</strong> this exerciseconcluded that environmental justice populations along with transit dependent populations continue to have greater access to transit than the statepopulation as a whole.As part <strong>of</strong> the FY 2013-2016 <strong>Transportation</strong> Improvement Program update, a quantitative analysis <strong>of</strong> the projects that are programmed for minority and lowincome areas was conducted. In summary, this analysis found that in nearly all cases, the percentage <strong>of</strong> transportation improvement projects in the categories<strong>of</strong> Highway, Pavement Management, Bicycle/Pedestrian, Enhancement, Traffic Safety Programs, and Major Projects with Multi Year Funding, in the minorityand low-income census tracts far exceeds the percentage <strong>of</strong> the target population as it compares to the total state population. Overall, the implementation <strong>of</strong>these types <strong>of</strong> projects in the TIP is extremely equitable and beneficial to <strong>Rhode</strong> <strong>Island</strong>’s disadvantaged citizens as the rehabilitation <strong>of</strong> existing transportationinfrastructure provides an overwhelming positive impact on a neighborhood in that it improves safety, increases mobility and may provide constructionworkforce opportunities for local residents; therefore benefits rather than burdens a community. The full results <strong>of</strong> this study are presented in the TIP(www.planning.state.ri.us/tip/TIP%20Full%207-12-12%20Final.pdf ).<strong>Transportation</strong> <strong>2035</strong> (2012 Update)<strong>State</strong> Guide Plan Element 611RI <strong>State</strong>wide <strong>Planning</strong> ProgramPage 4-11
December 2012In examining the equitable distribution <strong>of</strong> transit services and projects, it has been determined that two-thirds <strong>of</strong> RIPTA’s system serves minorityneighborhoods. The route system has Providence as its hub, with additional intra-city service in Pawtucket, Woonsocket, and Newport. This corresponds wellwith areas where minority concentrations are the greatest. The paratransit service is now a statewide system. Additional information on RIPTA’s commitmentto Civil Rights, Title VI can be found at www.ripta.com/civil-rights--title-vi .IDENTIFYING ENVIRONMENTAL JUSTICE POPULATIONSThe target populations for environmental justice are minorities, low-income individuals, and persons with disabilities. Minority is defined as including fourethnic groups: Hispanic, Black, Asian, and Native Indian, consistent with the Federal Environmental Justice Order. With the exception <strong>of</strong> persons withdisabilities, these populations have been identified and mapped using data from the 2010 Census. For this update, the Census definition <strong>of</strong> minority wasutilized which is the total population minus all white, non-Hispanic persons. The data for persons with disabilities has not yet beenreleased. The updated environmental justice population mapping can be found at the end <strong>of</strong> this document.See E.J. Maps #4-9Through 4-16In compliance with Executive Order No. 13166, Improving Access to Services for Persons with Limited English Pr<strong>of</strong>iciency (LEP), thepurpose <strong>of</strong> which is to ensure accessibility to programs and services to eligible persons who are not pr<strong>of</strong>icient in the English language, <strong>State</strong>wide <strong>Planning</strong>compiled data and mapping <strong>of</strong> LEP populations as part <strong>of</strong> a RIDOT Environmental Impact <strong>State</strong>ment (EIS) for the South County Commuter Rail Study. Inaddition, <strong>State</strong>wide <strong>Planning</strong> is in the process <strong>of</strong> completing an LEP Plan for its own planning program services. These efforts were conducted using guidancethat was issued by the U.S. Department <strong>of</strong> <strong>Transportation</strong> (DOT) to ensure that persons in the United <strong>State</strong>s are not excluded from participation in DOTassistedprograms and activities simply because they face challenges communicating in English.The mapping for these efforts is provided within this plan, a test case study, along with the other environmental justice mapping.PRINCIPLES OF ENVIRONMENTAL JUSTICEThe <strong>State</strong> embraces the following three core principles to guide our efforts in environmental justice:• Outreach - Reach out to involve target populations in the planning process.• Burdens - Prevent disproportionately high adverse impacts.• Benefits - Ensure an equitable distribution <strong>of</strong> benefits.The discussion that follows is organized by these principles.<strong>Transportation</strong> <strong>2035</strong> (2012 Update)<strong>State</strong> Guide Plan Element 611RI <strong>State</strong>wide <strong>Planning</strong> ProgramPage 4-12
December 2012OUTREACHOutreach activities are intended to provide input and guidance to the planning process to achieve environmental justice goals in both the Long Range<strong>Transportation</strong> Plan and the <strong>Transportation</strong> Improvement Program. The following outreach activities have occurred from 2007 to the current day in 2012:• <strong>Transportation</strong> Advisory Committee (TAC) Membership: The Governor’s Commission on Disabilities and the Narragansett Indian Tribe are representedon the TAC.• Environmental Justice List: An e-mail list consisting <strong>of</strong> 49 social advocacy groups (housing, elderly, Hispanic, etc.) for target populations wasdeveloped and is used in notifying the community <strong>of</strong> major planning activities.• Bus Users Forum: The Accessible <strong>Transportation</strong> Advisory Committee (ATAC) provides an opportunity for transit dependent residents to discuss busservice issues directly with transit operators and planners.• Flyers: Public participation brochures have been developed in Spanish and have been distributed and posted our website.• Open House: A major event was held in March 2007 at the Blackstone Valley Visitor Center (also a bus terminal) and advertised in Spanish andEnglish.• Inner City Students: Several lectures and planning exercises were held in 2007 – 2008 in conjunction with the University <strong>of</strong> <strong>Rhode</strong> <strong>Island</strong> at FeinsteinHigh School in Providence.• Coordinated Public <strong>Transportation</strong> - Human Services Plan: RIPTA brought together many agencies (Elderly Affairs, Human Services, Labor andTraining, Commission on Disabilities) that were key to the development <strong>of</strong> this Plan. <strong>State</strong>wide <strong>Planning</strong> assisted in this effort with extensive censusmapping <strong>of</strong> target populations, mailings to our Social Advocacy Group list, and e-mail notifications to our EJ list.Meeting the needs <strong>of</strong> the “underserved communities” is found in the goal <strong>of</strong> the <strong>Planning</strong> section <strong>of</strong> this Plan’s recommendations. The polices related to thisgoal run the spectrum <strong>of</strong> a program that is accessible, constructively engages, is inclusive, institutes outreach, and emphasizes all members <strong>of</strong> theenvironmental justice community.BURDENS<strong>Transportation</strong> systems exist to provide mobility and quality <strong>of</strong> life benefits. Unfortunately, the construction and operation <strong>of</strong> these systems can have adverseimpacts such as excessive noise, degraded air quality, degraded water quality, and isolation or fracturing <strong>of</strong> neighborhoods. Equity and environmental justicegoals seek to ensure that target populations do not bear a disproportionate share <strong>of</strong> these “burdens.” Quantifying burdens on a macro level can beaccomplished with the following equation termed “Location Quotient:”<strong>Transportation</strong> <strong>2035</strong> (2012 Update)<strong>State</strong> Guide Plan Element 611RI <strong>State</strong>wide <strong>Planning</strong> ProgramPage 4-13
December 2012EJ population in the study area / total population in the study area (U.S. Census, 2000 or 2010) .EJ population in the reference area / total population in the reference area 1A number greater than 1 indicates that there is a greater proportion <strong>of</strong> the EJ population in the study area. For the purposes <strong>of</strong> this plan and in consideration<strong>of</strong> the analytical tools available to staff, exposure to vehicle emissions was undertaken as a case study to determine if there is a disproportionate adverseimpact on environmental justice populations.Poor air quality can aggravate respiratory conditions such as asthma. On-road mobile sources <strong>of</strong> emissions (car, truck, and bus) contribute to degraded airquality, although point sources (power plants and factories) and area sources (lawn mowers and leaf blowers) contribute as well. <strong>Rhode</strong> <strong>Island</strong> has a rate <strong>of</strong>asthma that is 8 th highest in the nation, and 1 in 10 households in <strong>Rhode</strong> <strong>Island</strong> has someone with this disease. 2A University <strong>of</strong> Southern California (USC) study(part <strong>of</strong> the large California Children's Health Study) has found a link between asthma rates and how close the subjects live to a freeway. Specifically, thenumber <strong>of</strong> children who suffered asthma attacks increased as the distance between their homes and a major thoroughfare decreased. Those living within 82yards <strong>of</strong> a freeway had the highest rates <strong>of</strong> asthma, while those living 83 to 166 yards away had the second-highest rates. A family's socioeconomic status,exposure to secondhand smoke and the type <strong>of</strong> housing did not explain the differences in asthma rates. 3The current 2012 bus fleet includes 235 buses, trolleys, and vans including 52 hybrid buses. All vehicles use ultra-low sulfur diesel toreduce emissions. The primary bus routes traverse many low-income, minority, and transit dependent neighborhoods as well as thestate’s freeways. Diesel emissions in particular can pose a health hazard in these urban neighborhoods where asthma rates are <strong>of</strong>tenhigher than in suburban neighborhoods.CASE STUDY: Whatpercentage <strong>of</strong> RI’s EJpopulations live within250 feet <strong>of</strong> Interstatehighways compared tothe population as awhole?In an effort to determine the exposure <strong>of</strong> <strong>Rhode</strong> <strong>Island</strong>’s environmental justice populations to excessive emissions, census tracts withgreater than average concentrations target populations were mapped with a 250’ buffer around Interstate highways and freeways. The250’ buffer (approximately 82 yards as noted in the USC study) becomes the study area. Vehicles on other roadways also contribute to poor air quality, but aprincipal arterial has mobility benefits that balance out the burdens (access to commercial areas, services, residential neighborhoods, sidewalks, bus routes,etc.) Interstate highways, however, provide mobility benefits only without providing access to property or allowing for non-motorized modes or transit stops.Therefore, close proximity to an Interstate is assumed in this case to be more <strong>of</strong> a burden than a benefit. The reference area is the entire <strong>State</strong>.1 Methodological Challenges <strong>of</strong> Environmental Justice Assessments for <strong>Transportation</strong> Projects, TRB, TRC #2013, 2007.2 Behavioral Risk Factor Surveillance System, 2002.3 http://www.cleanairchoice.org/outdoor/AsthmaFreeway.asp<strong>Transportation</strong> <strong>2035</strong> (2012 Update)<strong>State</strong> Guide Plan Element 611RI <strong>State</strong>wide <strong>Planning</strong> ProgramPage 4-14
December 2012This mapping exercise presented the following Location Quotient equation for combined minority populations according to 2000 U.S.Census data:8,073 / 30,218167,081 / 1,048,319The calculated ratio is 1.68 which indicates that in fact a higher proportion <strong>of</strong> minorities live within this study area and that there is adisproportionate burden.See Map # 4-15Case Study: EJPopulations within250’ <strong>of</strong> Interstatesand FreewaysThis mapping exercise presented the following Location Quotient equation for combined minority populations according to 2010 U.S. Census data:7,691 / 20,367248,882 / 1,052,567The calculated ratio is 1.60 which indicates that a higher proportion <strong>of</strong> minorities continue to live within this study area and that there is a disproportionateburden; however the ratio is just slightly smaller than that found in 2000 indicating a slight reduction in the transportation burden on minorities.Similarly with population below the poverty level in 2000, the equation is:5,938 / 30,218120,548 / 1,048,319The calculated ratio is 1.71 which, again, indicates a disproportionate burden.Using the 2010 population below the poverty level, the equation is:3,538 / 20,367123,396 / 1,052,567The calculated ratio is 1.48 which, again, indicates a disproportionate burden, however the burden has improved over the past 10 years.This Plan presents the following recommendations to begin to address this concern. These recommendations are also found in Part Five with numbers noted inparentheses.1. Amend CMAQ criteria to award more points to projects improving air quality in areas close to freeways. (EQ.3.d)2. Through program implementation <strong>of</strong> diesel retr<strong>of</strong>its for school buses, begin with school districts in affected areas. (EN.3.e)3. Increase use <strong>of</strong> vegetated buffers along the highway to trap particulates and improve air quality. (En.3.c)<strong>Transportation</strong> <strong>2035</strong> (2012 Update)<strong>State</strong> Guide Plan Element 611RI <strong>State</strong>wide <strong>Planning</strong> ProgramPage 4-15
December 2012Additionally, in order to better understand this situation, further study is encouraged to attempt to obtain historic data from 1970, 1980, and 1990.Identification <strong>of</strong> a trend would determine whether the problem is getting better or worse. From the limited data that was analyzed (2000 and 2010), it doesappear that the disproportionate burden is shrinking. Also, <strong>State</strong>wide <strong>Planning</strong> has generated a map that identifies locations suitable for high-density housing.In future refinements <strong>of</strong> this map, the <strong>State</strong> should consider a new site screening criteria related to health impacts due to emissions exposure for allpopulations, not just target populations.<strong>Rhode</strong> <strong>Island</strong>’s transportation plans, policies, and programs advance the goal <strong>of</strong> reducing diesel emissions by encouraging diesel retr<strong>of</strong>itting programs and theuse <strong>of</strong> alternative fuels. All new RIPTA fixed route buses will be equipped with diesel particulate filters and engines with lower emissions levels. This plan alsoencourages non-motorized modes <strong>of</strong> transportation (bicycle and pedestrian) which help to achieve many goals related to improved air quality, physical fitness,reduced congestion, and are free or low-cost modes. It should be noted that overall air quality is improving and the passenger vehicle fleet is becomingcleaner. Additionally, the standards for transit bus engines have been getting more stringent on the amount <strong>of</strong> emissions that are acceptable, which results inimproved air quality in areas with a lot <strong>of</strong> transit activity. Over time, living in proximity to a highway should have increasingly fewer health impacts.It is beyond the scope <strong>of</strong> this Plan to investigate other potentially disproportionate adverse impacts to environmental justice populations, such as freewaynoise and degraded water quality.BENEFITS<strong>Transportation</strong> provides a means to access shopping, gainful employment, health care and other services, and social andrecreational activities. Without adequate means <strong>of</strong> transportation, quality <strong>of</strong> life can suffer. <strong>Transportation</strong> system investmentsshould be equitably distributed, and access to transportation services should also be equitable such that disadvantagedpopulations can reasonably accomplish the activities <strong>of</strong> daily life. Public transportation service is not a convenience, but rather anecessity for transit dependent residents.CASE STUDY: Whatpercentage <strong>of</strong> RI’starget populations livein area served bytransit compared tothe population as awhole?ACCESS TO TRANSITThe transit program recommended in this Plan is expected to benefit minority and low-income households by increasing transit service available to them andby increasing their access to jobs and other opportunities. As part <strong>of</strong> this Plan update, an analysis was conducted to determine if target populations haveequitable transit access. Firstly, a polygon coverage was created for geographic analysis by defining a half-mile radius buffer around transit stops. This transitservice area coverage was then overlaid on target populations to determine the number <strong>of</strong> people in the access area. The same Location Quotient equation asused in the previous section was used for this analysis for combined minority and low income populations. Using the 2000 Census, the calculation is thefollowing:259,574 / 771,704310,434 / 1,048,379<strong>Transportation</strong> <strong>2035</strong> (2012 Update)<strong>State</strong> Guide Plan Element 611RI <strong>State</strong>wide <strong>Planning</strong> ProgramPage 4-16
December 2012The calculated ratio is 1.14 which indicates greater access to transit for environmental justice populations.Using the 2010 Census, the calculation is the following:283,839 / 533,487372,278 / 1,052,567The calculated ratio is 1.50 which indicates that access to transit for environmental justice populations continues to improve.Another demographic group that is considered in this analysis is “transit dependent” as defined by zero-car households, <strong>of</strong> which there were 38,422 in thetransit service area in 2000:38,422 / 771,70444,518 / 1,048,379The calculated ratio is 1.19 which indicates greater access to transit for zero-car households.According to the 2010 Census, there were 37,563 zero-car households in the transit service area:37,563 / 533,48738,137 / 1,052,567The calculated ratio is 1.94 which indicates that access to transit for zero-car households continues to improve.Access to jobs is one <strong>of</strong> the most critical issues for low-income and transit dependent households in the <strong>State</strong> <strong>of</strong> <strong>Rhode</strong> <strong>Island</strong>. RIPTA administers severalprograms to meet this need including Jobs Access Reverse Commute and New Freedoms Initiatives. However, the growth <strong>of</strong> employment in suburban areasand the lack <strong>of</strong> adequate transit service to these areas <strong>of</strong>ten create barriers for transit-dependent residents searching for jobopportunities. Additionally, developments that locate low cost and senior housing in areas with low land costs may serve thestate’s affordable housing goals but put a great strain on RIPTA’s ability to serve these locations.See Map # 4-16Case Study: EJPopulations within ¼Mile <strong>of</strong> a Transit Stop<strong>Transportation</strong> to jobs was raised as a key issue in the Coordinated Plan for Public <strong>Transportation</strong> and Human Services. This Plancontinues to support bus service as part <strong>of</strong> its environmental justice program. RIPTA should also continue its efforts to givetransit users a voice through a forum such as the New Public Transit Alliance (NUPTA) and continue its efforts to improve busscheduling. Further development <strong>of</strong> the transit component <strong>of</strong> the travel demand model will enable analysis <strong>of</strong> other indicators such as travel time to work.<strong>Transportation</strong> <strong>2035</strong> (2012 Update)<strong>State</strong> Guide Plan Element 611RI <strong>State</strong>wide <strong>Planning</strong> ProgramPage 4-17
December 2012HOW THIS PLAN ADVANCES ENVIRONMENTAL JUSTICE GOALSThere are a number <strong>of</strong> transportation issues that this Plan identifies as important to minority, low-income, or transit dependent populations. There is an entiresection <strong>of</strong> the plan recommendations that addresses Equity (described below). In addition, our commitment to environmental justice is pervasive throughoutthe recommendations section, and applicable references are also noted below.EQUITYThe goal <strong>of</strong> equity is to “ensure that the transportation system equitably serves all <strong>Rhode</strong> <strong>Island</strong>ers regardless <strong>of</strong> race, ethnic origin, income, age, mobilityimpairment, or geographic location.” The objectives refer to equitable distribution <strong>of</strong> projects and access to services. The policies and strategies reinforce theneed for outreach and avoidance <strong>of</strong> disproportionate adverse impacts. They also set forth the need for provision <strong>of</strong> travel training for non-English speakingpopulations.BICYCLE & PEDESTRIANPedestrian and bicycle safety is an important issue that affects minority, low-income households, and especially transit dependent households living in ourmore urbanized communities. According to the 2010 American Community Survey 10.2 percent <strong>of</strong> households in <strong>Rhode</strong> <strong>Island</strong> does not own a vehicle, and formany <strong>of</strong> them, walking, and riding a bike is an important means <strong>of</strong> travel. However, pedestrians and cyclists face many safety hazards in urban areas wheretraffic volumes are high. This Plan promotes pedestrian and bicycle safety in urban areas <strong>of</strong> the state.DESIGNDesign policies stress the importance <strong>of</strong> pedestrian access to transit and the need for ADA improvements.ECONOMIC DEVELOPMENTEconomic development objectives and policies deal directly with getting people to and from work sites.EMERGENCY RESPONSEEmergency response cites the special evacuation needs <strong>of</strong> those with mobility impairments, the elderly and transit dependent populations.<strong>Transportation</strong> <strong>2035</strong> (2012 Update)<strong>State</strong> Guide Plan Element 611RI <strong>State</strong>wide <strong>Planning</strong> ProgramPage 4-18
December 2012ENVIRONMENTEnvironmental objectives identify the need to reduce air and noise pollution, which may impact target populations disproportionately.FINANCEOver a quarter <strong>of</strong> the policy recommendations within the Finance section are devoted to the enhancement <strong>of</strong> the economic well-being <strong>of</strong> the transit systemservice within the state. In addition, ADA improvements are singled out for special consideration for financial restructuring to provide long-term fiscal stability.HIGHWAY AND INTERSTATENone <strong>of</strong> the proposed freeway improvements are expected to adversely affect any minority or low-income neighborhoods. The design for the improvementsto Route 6 evolved such that there were minimal adverse impacts to minority or low-income neighborhoods. The operational and safety improvements alloccurred largely within existing rights <strong>of</strong> way and did not affect residential neighborhoods. RIDOT outreach during the design process was done in English andSpanish. The interstate system was examined along its entire length with respect to the proximity <strong>of</strong> environmental justice populations, as close proximity isbeing considered as a burden due to degraded air quality. And lastly, the FY 2013 – 2016 <strong>Transportation</strong> Improvement Program (TIP) includes an analysis thatdemonstrates that bicycle, highway, and enhancement projects are equitably distributed.INTERMODALIntermodal planning emphasis is placed on transit and connections to and between modes. The creation <strong>of</strong> additional “mini transit hubs,” maintenance <strong>of</strong>Kennedy Plaza, provision <strong>of</strong> additional traveler information, travel training for the disabled, and expansion <strong>of</strong> private participation is all beneficial to theenvironmental justice populations.LAND USE AND CORRIDORSLand Use 2025, <strong>Rhode</strong> <strong>Island</strong>’s <strong>State</strong> Land Use Plan, calls for directing growth and investments within an “urban services boundary” and creating developmentthat is more conducive to successful use. The majority <strong>of</strong> low income, minority, and transit dependent populations are found within this urban area andimproved transit service will benefit all.<strong>Transportation</strong> <strong>2035</strong> (2012 Update)<strong>State</strong> Guide Plan Element 611RI <strong>State</strong>wide <strong>Planning</strong> ProgramPage 4-19
December 2012PLANNING<strong>Planning</strong> aspects recognize the “needs <strong>of</strong> underserved communities” and “supports inclusive transportation planning and resource allocation processes thatare accessible to, understood by, and constructively engage all population groups.”SAFETYThe safety goals <strong>of</strong> the plan involve education, as well as engineering and enforcement. This is particularly important when addressing the needs <strong>of</strong> theenvironmental justice populations. The use <strong>of</strong> safety devices such as seatbelts and the routine state safety inspection <strong>of</strong> vehicles are lower within thesedemographics.TRANSITOther transit recommendations in the Plan are specifically intended to improve mobility for low-income households. The Jobs Access Program is designed tohelp low income workers gain access to job site otherwise unavailable to them. The recommendation to extend hours <strong>of</strong> service for the bus system is intendedto benefit the transit dependent person who <strong>of</strong>ten cannot access certain activities because bus service stops at 8:00 p.m. on many routes. Alternativetransportation options need to be developed to address the challenges <strong>of</strong> providing access to job centers that are not located in areas with a lot <strong>of</strong> transitactivity and <strong>of</strong> providing access to jobs that begin at staggered times. Fixed route public transit is not a viable service for low ridership travel like access to jobsthat are located in remote areas and serve individual workers.These many goals, policies, and strategies are critical components <strong>of</strong> <strong>Rhode</strong> <strong>Island</strong>’s environmental justice program that the <strong>State</strong> will strive to pursue andimprove. The <strong>State</strong> <strong>of</strong> <strong>Rhode</strong> <strong>Island</strong> remains committed to involving minority groups and low-income groups in our planning process, and to developing plansand programs that provide an equitable distribution <strong>of</strong> benefits and burdens.AIR QUALITY ANALYSISEXECUTIVE SUMMARYAs part <strong>of</strong> its transportation planning process, the <strong>State</strong> <strong>of</strong> <strong>Rhode</strong> <strong>Island</strong> conducted an air quality analysis for both the FY 2013-2016 <strong>Transportation</strong>Improvement Program (TIP) and <strong>Transportation</strong> <strong>2035</strong>, the Long Range <strong>Transportation</strong> Plan 2012 Update. The air quality analysis included a statewide analysisfor ozone precursor emissions <strong>of</strong> volatile organic compounds (VOCs) and oxides <strong>of</strong> nitrogen (NO x ).<strong>Transportation</strong> <strong>2035</strong> (2012 Update)<strong>State</strong> Guide Plan Element 611RI <strong>State</strong>wide <strong>Planning</strong> ProgramPage 4-20
December 2012In response to the Federal Highway Administration (FHWA) and Environmental Protection Agency (EPA) guidance, <strong>Rhode</strong> <strong>Island</strong> has developed a Long Range<strong>Transportation</strong> Plan <strong>2035</strong> Update that includes projects to reduce vehicle miles <strong>of</strong> travel and improve traffic flow. The air quality analysis evaluated the onroadair quality emissions for <strong>Transportation</strong> <strong>2035</strong>.The general modeling process involved two major inputs, traffic and emission factor data. The traffic data were obtained from the <strong>Rhode</strong> <strong>Island</strong> <strong>State</strong>wideModel (RISM). The RISM was updated to include additional roadways, modeling zones, and current planning assumptions. Consistent with federal guidance,the model’s traffic data were adjusted to account for the following factors, Highway Performance Monitoring System, seasonal adjustment for pollutants, andpeak and <strong>of</strong>f-peak period speed characteristics.The vehicle emission factors were derived using the EPA’s latest mobile source emission factor model, MOBILE 6.2, and reflect <strong>Rhode</strong> <strong>Island</strong>-specific conditions,such as the vehicle registration distribution and the statewide Inspection and Maintenance (I/M) Program. The traffic and emission factor data were calculatedon a link-by-link basis in the EPA’s Air Information Retrieval System (AIRS) format, which is consistent with air quality analyses for previous Long Range<strong>Transportation</strong> Plans and <strong>Transportation</strong> Improvement Programs (TIPs).The air quality analysis performed for <strong>Transportation</strong> <strong>2035</strong> demonstrates compliance to the <strong>Rhode</strong> <strong>Island</strong> <strong>State</strong> Implementation Plan, the Clean Air ActAmendments, and the <strong>Transportation</strong> Conformity requirements. The air quality analysis demonstrates that the mobile source emissions <strong>of</strong> ozone precursor(volatile organic compounds (VOCs) and oxides <strong>of</strong> nitrogen (NO x )) for 2012 Existing, 2015 Build, 2025 Build, and <strong>2035</strong> Build conditions fall below the statewide2009 SIP mobile source emission budgets <strong>of</strong> 22.75 tons per day (tpd) <strong>of</strong> volatile organic compounds and 25.29 tpd <strong>of</strong> oxides <strong>of</strong> nitrogen for all future years. Theresults <strong>of</strong> the air quality analysis are presented in the table below.<strong>Rhode</strong> <strong>Island</strong> <strong>State</strong>wide Ozone Results for the Long Range <strong>Transportation</strong> PlanDaily Vehicle MilesTraveled (VMT)VOC(tons/day)NO X(tons/day)2009 SIP Budget --- 22.75 25.292012 Build 27,168,666 10.91 14.582015 Build 27,659,094 10.96 11.482025 Build 29,296,868 8.00 5.89<strong>2035</strong> Build 30,749,608 8.28 5.71The complete Air Quality Analysis is on file at the RI <strong>State</strong>wide <strong>Planning</strong> Program <strong>of</strong>fice.<strong>Transportation</strong> <strong>2035</strong> (2012 Update)<strong>State</strong> Guide Plan Element 611RI <strong>State</strong>wide <strong>Planning</strong> ProgramPage 4-21
December 2012<strong>Transportation</strong> <strong>2035</strong> (2012 Update)<strong>State</strong> Guide Plan Element 611RI <strong>State</strong>wide <strong>Planning</strong> ProgramPage 4-22
Part V Recommendations
December 2012PART FIVE RECOMMENDATIONSFRAMEWORK FOR RECOMMENDATIONSThis plan presents recommendations around 14 topic areas (listed at left). Within each topic, there is an overall goal, followed by objectives, policies,strategies and performance measures. Collectively, these are referred to as “recommendations.” This is written according to guidance issued by RISPP on“How to Prepare and Maintain a <strong>State</strong> Guide Plan Element” (September 2003) using the following definitions:RECOMMENDATIONSBicycleDesignEconomic DevelopmentEmergency ResponseEnvironmentEquityFinanceHighwayIntermodalLand Use and CorridorsPedestrian<strong>Planning</strong>SafetyTransitGOALThe Goals is the end or ideal that is desired. It is a state or value toward which an effort is directed even though it may notnecessarily be attainable. Goal statements are broad in scope, long-term in nature but should not be vague.OBJECTIVELike a goal, an objective is an end toward which an effort is directed. An objective, however, should be measurable andattainable. Objectives are stated in more narrow and specific terms than goals and may be set within definite time periodsand establish performance measures.POLICYPolicies are intended to guide decisions and courses <strong>of</strong> action toward implementing a plan. Policies are not an endpoint butset forth the acceptable and recommended procedures for attaining goals and objectives.STRATEGYA Strategy is a specific action suggested as a recommendation that will further the advancement toward a goal or objective.PERFORMANCE MEASUREPerformance Measure is a plan’s objectives should be measurable and measured. Plans should specify parties responsible for implementing objectives, ideallywithin targeted timeframes.<strong>Transportation</strong> <strong>2035</strong> (2012 Update)<strong>State</strong> Guide Plan Element 611<strong>Rhode</strong> <strong>Island</strong> <strong>State</strong>wide <strong>Planning</strong> ProgramPage 5-1
December 2012Following is an introduction to the topics under which recommendations are organized.BICYCLEA growing network <strong>of</strong> bicycle (and walking) paths is hugely popular among residents and tourists. Continued expansion <strong>of</strong> the state’sgreenway network is a strategic investment in the state’s future that will provide transportation options and enhance theattractiveness <strong>of</strong> the state. Bicycling is an inexpensive and environmentally sound means <strong>of</strong> travel, practical for many short trips towork, school, and shopping. Added emphasis on signing and striping on-road bike routes will also support the diversification <strong>of</strong> travelSee Map # 5-1Future<strong>Transportation</strong>Systemoptions. Bicycle travel can be made safer and more appealing when these modes <strong>of</strong> transportation are consistently mainstreamed into project and communityplanning and design.DESIGNThe design details and aesthetics <strong>of</strong> a transportation system’s facilities are increasingly recognized as important determinants <strong>of</strong> the system’s impact upon thecommunities it serves. Whether a transportation facility reflects the uniqueness <strong>of</strong> the place and character <strong>of</strong> the community it serves, or whether it representsa “cookie-cutter sameness” is determined by the quality <strong>of</strong> design and its attention to details. Design details that preserve (or echo) local historic features andcultural assets, use landscaping creatively, and reflect a human scale can enhance the attractiveness <strong>of</strong> transportation infrastructure and help enlist communityand public support for needed facilities.ECONOMIC DEVELOPMENTEconomic development is stimulated by transportation improvements and linkages. The concept <strong>of</strong> intermodal transportation isevident in prime industrial areas like Quonset/Davisville, the planned Warwick/Airport business center (Warwick StationRedevelopment District), and older cities. Such areas can be made more attractive to investment and development byintermodalism -- creating effective transportation linkages. The economy depends upon the successful movement <strong>of</strong> rawmaterials to manufacturers, finished goods to retail markets (or directly to the consumer), workers to the workplace, andconsumers to shopping areas. Vibrant downtown shopping areas and Main Streets create a sense <strong>of</strong> community that appeals toresidents and visitors alike. Tourism is a leading industry. It can be encouraged by providing better information in centrallocations, shuttle routes, appealing waterborne trips, port facilities for cruise ships, and other innovative transportation.The statetransportationprogram should befocused on preservingassets and doing agood job <strong>of</strong> managingthem consistent withthe vision <strong>of</strong> this plan<strong>Transportation</strong> <strong>2035</strong> (2012 Update)<strong>State</strong> Guide Plan Element 611<strong>Rhode</strong> <strong>Island</strong> <strong>State</strong>wide <strong>Planning</strong> ProgramPage 5-2
December 2012EMERGENCY RESPONSESee Map # 5-3The terrorist attacks against the United <strong>State</strong>s <strong>of</strong> America that occurred on September 11, 2001 and Hurricane Katrina in 2005 had aEmergencyvast and pr<strong>of</strong>ound impact on the transportation and infrastructure networks across the country as well as members <strong>of</strong> the public who Response Networkare the customers <strong>of</strong> these systems. Our economy and our free lifestyle are dependent upon open, convenient, and low costtransportation. Our means <strong>of</strong> transportation, with the exception <strong>of</strong> airline travel, remain largely porous and in many cases vulnerable to terrorist attacks,whether by explosives or by release <strong>of</strong> chemical or biological agents. Although the risk <strong>of</strong> a terrorist incident is probably lower in <strong>Rhode</strong> <strong>Island</strong> than othermetropolitan areas, the possibility cannot be ruled out, and the state and local governments must be prepared to respond. <strong>Rhode</strong> <strong>Island</strong> is also very vulnerableto tropical and winter storms that may necessitate evacuations or activation <strong>of</strong> other emergency response systems.ENVIRONMENT<strong>Transportation</strong> projects can enhance the environment and communities --revitalizing city and village streetscapes, restoringhistoric terminals, preserving scenic vistas, and opening river corridors to bicyclists and pedestrians. Unfortunately, they can alsohave adverse impacts.Stormwater run<strong>of</strong>f from highways must be properly managed to avoid being a significant contributor to water pollution. Wherefeasible, retention <strong>of</strong> stormwater within the highway right <strong>of</strong> way, by providing vegetated buffers for infiltration, <strong>of</strong>fers the mosteffective and enduring solution. Drainage structures can also control run<strong>of</strong>f and provide treatment, but require on-goingmaintenance to retain effectiveness. Integrating the principles <strong>of</strong> urban forestry into the vegetation regimes for highway rights <strong>of</strong>way and parking areas can reduce run<strong>of</strong>f and improve the aesthetics <strong>of</strong> such facilities.The statetransportation systemshould maintain andenhance the quality <strong>of</strong>the state’senvironment and thelivability <strong>of</strong> itscommunities.The transportation sector can be a positive force for improvement <strong>of</strong> the quality <strong>of</strong> the air we breathe. Investments to expand transit services, provide bikepaths and other facilities to encourage bicycling and walking, and to introduce cleaner fuels and vehicles that are more fuel efficient all contribute to reducingemissions <strong>of</strong> mobile source air pollutants and greenhouse gases associated with global warming. Public education regarding the effects <strong>of</strong> auto-dependantland use and development patterns that require excessive commuting or other auto travel may also contribute to greater recognition, over time, <strong>of</strong> theconnection between individual lifestyle choices and air pollution. As fuel prices reach an all-time high, the need to reduce our reliance on foreign oil and turnto renewable sources and conservation measures has never been greater. This plan also begins to explore the impacts that sea-level rise may have on the<strong>State</strong>’s transportation infrastructure.<strong>Transportation</strong> <strong>2035</strong> (2012 Update)<strong>State</strong> Guide Plan Element 611<strong>Rhode</strong> <strong>Island</strong> <strong>State</strong>wide <strong>Planning</strong> ProgramPage 5-3
December 2012EQUITYInequities in the transportation system can exist as differentials in the levels <strong>of</strong> benefits (availability or accessibility to facilities, levels <strong>of</strong> service, investments intransportation systems) provided to different population groups; or in the degree <strong>of</strong> burdens (negative impacts <strong>of</strong>transportation such as inability to access services and jobs, degradation <strong>of</strong> air quality, noise levels, impacts on water quality,pollution, disruption to communities, etc.) that different communities or geographic areas are called upon to shoulder. Underfederal law (Civil Rights Act <strong>of</strong> 1964) federal agencies have an obligation to avoid discrimination in the distribution <strong>of</strong> federalresources and benefits. Executive Order 12898 (Environmental Justice) additionally charges agencies with identifying andaddressing, as appropriate, “disproportionately high and adverse human health or environmental effects” <strong>of</strong> their programs,policies, and activities on minority populations and low-income populations. Lower income, elderly and minority populations,and persons with disabilities who lack access to an automobile must deal with daunting personal transportation issuescompared to individuals who have automobiles. The transportation needs <strong>of</strong> suburban and rural populations for access to jobs,medical and other essential services are as acute as in urban areas, and transportation services are generally less available inrural communities. Historically, the participation <strong>of</strong> lower income, minority, and other transportation-disadvantagedpopulations in the transportation planning processes has been limited by a lack <strong>of</strong> information, constraints on the time,The statetransportation systemshould be equitableand just in itsdistribution <strong>of</strong> benefitsand burdens, andshould strive to meetthe needs <strong>of</strong>underservedcommunities.mobility and resources <strong>of</strong> such groups, and, in some instances, cultural and language barriers. Expanded, community-based, outreach approaches should bepursued to better engage low income and minority populations in transportation decision-making to insure that their legitimate transportation needs are fullyconsidered.FINANCEThe fiscal crisis that was projected in the 2001 and 2004 Plans is now upon us. <strong>Transportation</strong> finance gaps at the state and federal level threaten to dismantlestate transportation programs as we know them. Construction costs have soared in recent years and that has been reflected inproject costs. Fuel costs have also risen dramatically, which particularly affects RIPTA’s costs. Recent efforts to draw attention tothis include the Massachusetts <strong>Transportation</strong> Finance Commission and the National Surface <strong>Transportation</strong> Policy and RevenueStudy Commission. Both <strong>of</strong> these Commissions published reports documenting the tremendous unfunded needs andrecommending dramatic increases in funding that are required to put the programs back on sustainable courses.<strong>Rhode</strong> <strong>Island</strong> needs to continue weaning itself from over-reliance on long-term bonding for regular transportation expenses.Transit and paratransit operating costs are a growing state responsibility, and it is especially critical to identify a sustainable andlong term funding stream for RIPTA to ensure that transit can continue to perform its transportation and social functions in aThe statetransportation systemshould have a financialbase adequate forsupporting neededservices.manner that allows it to increase their ridership. Municipalities need state support for road surfacing. More state-share funds should be found to match the<strong>Transportation</strong> <strong>2035</strong> (2012 Update)<strong>State</strong> Guide Plan Element 611<strong>Rhode</strong> <strong>Island</strong> <strong>State</strong>wide <strong>Planning</strong> ProgramPage 5-4
December 2012level <strong>of</strong> federal transportation funding currently available. The potential for future reductions in federal funds coming to <strong>Rhode</strong> <strong>Island</strong> must be contemplated,and strategically planned for. Options for alternative, indigenous funding sources should be explored as a hedge against reduced federal funding, and toprovide adequate support for development and maintenance <strong>of</strong> a functional intermodal transportation system for <strong>Rhode</strong> <strong>Island</strong>’s future.HIGHWAYAs the number <strong>of</strong> registered vehicles and the vehicle miles traveled both continue to increase, and highway capacity remains relatively static, we mustcontinue to improve the performance <strong>of</strong> our existing highway system. Traffic flow and safety can benefit from new technology, suchas motorist information systems, centrally coordinated traffic monitoring and control, signal timing, and other Intelligent<strong>Transportation</strong> System (ITS) technologies. Mainstreaming consideration <strong>of</strong> ITS opportunities into planned transportation projects willaccelerate the potential benefits <strong>of</strong> this new technology. Coordinated development with combined access points can preserve thefunctional capacity <strong>of</strong> arterial highways, reducing congestion. Regularly scheduled pavement and bridge management can avoidfailures, such as the bridge collapse in Minneapolis in 2006, and eventual, more costly replacements or reconstructions. Investmentsshould continue to concentrate on maintenance and operations, rather than new highway building. The TIP for FY 2009-2012 reflects aSee Map # 5-4Intelligent<strong>Transportation</strong>Systemsconcerted effort to address bridge structural deficiencies, which is a critical need, but does take away from other TIP programs. This Plan also stresses greateruse <strong>of</strong> access management and congestion management to obtain greater functionality from our highway system.INTERMODALThe growing momentum towards intermodal transportation must be sustained and cultivated as an underlying philosophy for organizing the transportationsystem at the state, regional and municipal levels. Continued emphasis on modal diversification and intermodal linkages will strengthen the state’stransportation system, reduce pollution, and <strong>of</strong>fer convenient, efficient, and enjoyable means for visitors to traverse the state. Intermodal concepts andprojects have greatly increased over the last decade, but opportunities remain for strengthening the linkages among various modes, and for expanding thediversity <strong>of</strong> travel options available to <strong>Rhode</strong> <strong>Island</strong> residents and visitors. A boom in airport patronage, the inauguration <strong>of</strong> high-speed rail, and the extension<strong>of</strong> commuter rail presage success for the planned intermodal connection <strong>of</strong> T.F. Green <strong>State</strong> Airport with the Northeast Rail Corridor. Intermodal terminals areneeded in other places, and meticulous attention must be paid to coordinated scheduling, traveler information services and accurate, well-placed signage t<strong>of</strong>ully support a convenient and effective intermodal system. Convenient intermodal connections can encourage transit usage. Trains to bus, ferry to bus, andairport to other modes -- all need stimulus.<strong>Transportation</strong> <strong>2035</strong> (2012 Update)<strong>State</strong> Guide Plan Element 611<strong>Rhode</strong> <strong>Island</strong> <strong>State</strong>wide <strong>Planning</strong> ProgramPage 5-5
December 2012LAND USE AND CORRIDORSOur state is the second most densely populated in the country. Existing urban places and locations that are suitable for development need improvedtransportation services, but open space and pristine rural areas should not be sacrificed. To preserve the beauty <strong>of</strong> <strong>Rhode</strong> <strong>Island</strong> for future generations, statetransportation planning and design must work hand-in-hand with cities and towns to manage land development and establishstandards for roads, sidewalks, shared-use paths and transit facilities that are responsive to safety, travel demand, capacity,environmental, and aesthetic concerns. Land Use 2025 will play a key role in shaping the <strong>State</strong>’s development, primarily by theestablishment <strong>of</strong> an Urban Services Area. This area has the water and sewer infrastructure to support increased density, which inturn can sustain public transportation.Land use decisions also need to support transportation system objectives. The nature and character <strong>of</strong> development allowed bycommunities must be related to the level <strong>of</strong> transportation infrastructure available and planned. An orientation to transit, bicycle,and pedestrian needs in the siting and design <strong>of</strong> new development can support transportation goals, reduce vehicle trips, maketransit service more viable, and improve safety. The state’s transportation planning process should continue to build on anintermediate framework for analysis <strong>of</strong> travel corridor needs to integrate the statewide policies expressed in this plan with regionalconsiderations and local plans, and to provide a process for individual transportation projects to be planned and coordinatedwithin a context <strong>of</strong> regional needs and statewide policies.The statetransportationsystem shouldsupport desired landuse patterns- theconcentration <strong>of</strong>growth in existingurban centers, andin locations suitableand planned formore intensivedevelopment.PEDESTRIANPedestrian (and bicycle) travel can be made safer and more appealing when these modes <strong>of</strong> transportation are consistently mainstreamed into project andcommunity planning and design. Greater consideration to opportunities for encouraging pedestrian travel in all aspects <strong>of</strong> community planning and projectdesign will improve safety, support transit, encourage more healthful lifestyles, invigorate downtown areas, and enhance community livability. Communitiesshould embrace the principles <strong>of</strong> walkable communities and use tools available (such as traffic calming, restoring 2-way traffic flow on one-way streets,reducing curb radii, maintaining crosswalks and signals, etc.) to encourage pedestrian activity. The Safe Routes to School Program established by SAFETEA-LUstrives to create a better and safer walking environment for school children, consistent with goals <strong>of</strong> reducing congestion, improving air quality, andencouraging healthy lifestyles.PLANNINGFederal funding agencies require metropolitan planning organizations to maintain a “comprehensive, cooperative, and continuing” planning process. Thisentails cooperation with all levels <strong>of</strong> government, the public, and other stakeholders. Additionally, in <strong>Rhode</strong> <strong>Island</strong>, all cities and towns are required to adopt<strong>Transportation</strong> <strong>2035</strong> (2012 Update)<strong>State</strong> Guide Plan Element 611<strong>Rhode</strong> <strong>Island</strong> <strong>State</strong>wide <strong>Planning</strong> ProgramPage 5-6
December 2012comprehensive plans consistent with the <strong>State</strong> Guide Plan. This enhances the planning relationships with communities and broadens transportation planningto include other topics such as economic development, land use, and the environment. <strong>Rhode</strong> <strong>Island</strong>'s vision for transportation is built on a solid base <strong>of</strong> publicinvolvement; and it can continue to evolve by welcoming the participation <strong>of</strong> all users, public sector <strong>of</strong>ficials, the business community, and interest groups,with special attention to engaging disadvantaged populations.SAFETYAs one <strong>of</strong> FHWA’s “vital few” focus areas, safety has a prominent presence in this plan with respect to all modes <strong>of</strong> transportation. As crash reporting datasystems improve, analysis <strong>of</strong> locations and causes <strong>of</strong> crashes should become more precise. However, with the increasing number <strong>of</strong> elderly drivers andincreasing vehicle miles traveled (VMT), reducing fatalities and injuries on the roadways will be a daunting task. This task can be accomplished through betterroadway and vehicle design, increased awareness and behavior changes, as well as more stringent laws and stepped up enforcement. RIDOT recentlycompleted the 2012 <strong>Rhode</strong> <strong>Island</strong> Strategic Highway Safety Plan which provides short and medium term strategies in five areas where fatalities will leadtoward zero deaths.TRANSITRIPTA represents a significant public investment that serves the public interest in many ways. It carries employees to their workplaces. It strengthens urbancommunities by serving people who do not drive -- students, low-income families, elderly and disabled persons, and also helps some individuals to liveindependently. It reduces congestion and pollution and conserves energy. An effective and convenient transit system can bean alternative to single-occupant auto travel, and RIPTA should continue to attract riders who would otherwise drive alone.Marketing and outreach are key to the success <strong>of</strong> the various transit services that are <strong>of</strong>fered. RIPTA also needs to continueto redesign its routes and <strong>of</strong>fer a new array <strong>of</strong> bus, van, and other services to meet the changing markets for transit. But thesystem needs a sustainable source <strong>of</strong> operating funds, regular maintenance, and replacement <strong>of</strong> equipment and facilities.RIPTA’s funding needs are as acute as RIDOT’s, and they are now facing a loss <strong>of</strong> revenue streams. In spite <strong>of</strong> these financialdifficulties, they have been extremely successful in attracting riders, and in fact ridership is at an all-time high, and some busroutes are over-crowded. At the time this Plan was written, RIPTA was embarking on a Metropolitan Transit Study that willcontinue the work <strong>of</strong> the Transit 2020 Group and the Special Legislative Commission. This Study occurs at a time when thereis energy in the community around the future <strong>of</strong> transit and it certainly bears watching.The state transportationsystem should add newservices to reflect newtravel demands and shiftsin usage, and to <strong>of</strong>ferattractive intermodal travelalternatives to reduceprivate (single occupancy)automobile use.<strong>Transportation</strong> <strong>2035</strong> (2012 Update)<strong>State</strong> Guide Plan Element 611<strong>Rhode</strong> <strong>Island</strong> <strong>State</strong>wide <strong>Planning</strong> ProgramPage 5-7
BICYCLEGOAL BOBJECTIVES B.1.aB.1.bB.1.cPOLICIES B.2.aB.2.bB.2.cB.2.dB.2.eB.2.fB.2.gMaintain and expand an integrated statewide network <strong>of</strong> on-road and <strong>of</strong>f-road bicycle routes to provide a safe means <strong>of</strong> travel forcommuting, recreation, and tourism in order to improve public health, and reduce auto congestion and dependency.Increase bicycle ridership.Complete <strong>Rhode</strong> <strong>Island</strong> portion <strong>of</strong> East Coast Greenway.Complete the 200 mile integrated statewide bicycle system as recommended in the Greenspace and Greenways Element <strong>of</strong> the stateGuide Plan by 2020.Maintain existing bicycle paths and on-street lanes in a clean, safe, and attractive condition.Expand the on and <strong>of</strong>f-road bicycle network – prioritizing projects that provide links between bike paths, seamless connections to othermodes, or have the potential to reduce automobile traffic. This includes provision <strong>of</strong> facilities such as bike racks, lockers, showers,etc.Encourage cities and towns to address bicycle transportation in comprehensive plans. Promote locally sponsored bicycle facilitieswhich connect with and complement the state system.Adhere to the "bicycle tolerant" design philosophy in all highway reconstructions. Include experienced bicyclists in the design reviewprocess for both on and <strong>of</strong>f road bicycle routes.Promote bicycling as a viable transportation choice for commuters, students, and tourists. Businesses receiving state funding forexpansion should accommodate bicycle commuting by providing user facilities if safe and reasonable connections can be made to anexisting bicycle route.Provide ADA compliant accommodations for pedestrians, skateboards, non-motorized scooters, roller blades/skates, strollers,motorized and non-motorized wheelchairs on <strong>of</strong>f-road paths.Cooperate with public and private sector entities to promote and provide a resource for healthy recreation activities.<strong>Transportation</strong> <strong>2035</strong> (2012 Update)<strong>State</strong> Guide Plan Element 611RI <strong>State</strong>wide <strong>Planning</strong> ProgramPage 5-8December 2012BICYCLEDESIGNECONOMICDEVELOPMENTEMERGENCYRESPONSEENVIRONMENTEQUITYFINANCEHIGHWAYINTERMODALLAND USE ANDCORRIDORSPEDESTRIANPLANNINGSAFETYTRANSIT
BICYCLESTRATEGIES B.3.aB.3.bB.3.cB.3.dB.3.eB.3.fB.3.gB.3.hB.3.iB.3.jDesign on-road bike lanes in urban areas with a minimum acceptable width to ensure bicyclist safety; include adequate striping,signage, and, where possible, physical barriers to separate bike lanes from motor vehicles and make them clearly visible to motorists.Explore new technologies that can detect bicyclists at signalized intersections.Install bike-parking facilities and cyclist amenities at public properties such as schools, community centers, libraries, and parkinggarages. Encourage businesses to do the same.Maintain bicycle paths and lanes free from debris and excess sand. Maintain surfaces, signage, striping, lighting, and drainagestructures.Determine a safe and convenient means for providing bicycle access across the Pell, Jamestown, Mt. Hope, and Sakonnet Riverbridges.Develop a system <strong>of</strong> naming, route designation, and signage/marking for the statewide bikeway system. The system should beconsistent with national standards and the system developed by the East Coast Greenway Alliance (as it applies to the <strong>Rhode</strong> <strong>Island</strong>segment <strong>of</strong> the East Coast Greenway) and done in conjunction with host communities that maintain paths.Republish the RIDOT ”Guide to Cycling in the Ocean <strong>State</strong>” and a RI greenways or trails map on a periodic, continuing basis. Workwith FHWA to allow designation <strong>of</strong> bike related businesses on the map, and in exchange, seek private sponsorship and maintenance<strong>of</strong> the path by the businesses.Continue to <strong>of</strong>fer grants to local governments and non-pr<strong>of</strong>it groups for trail and greenway development under the NationalRecreational Trails Program administered by DEM.Develop a statewide trail plan, which inventories existing trails and provides a detailed trail development and maintenance program insupport <strong>of</strong> the recommendations <strong>of</strong> the Greenspace and Greenways Plan.Utilize the Bicycle/Pedestrian Program <strong>of</strong> the TIP to help fund bike path and bike lane construction.Utilize the Safe Routes To School Program for infrastructure and non-infrastructure projects to improve bicycling safety for schoolchildren.PERFORMANCEMEASURESB.4.a Increase mode share <strong>of</strong> bicycle commuters [included in “Other” as defined by US Census] from 1.0% to 1.2% in 2010, 1.5% in 2020and 1.7% in 2030.B.4.b Complete the RI portion <strong>of</strong> the East Coast Greenway (25 miles by 2015).B.4.cComplete the 200 mile integrated statewide bicycle system as recommended in the Greenspace and Greenways Element <strong>of</strong> the stateGuide Plan by 2030.<strong>Transportation</strong> <strong>2035</strong> (2012 Update)<strong>State</strong> Guide Plan Element 611RI <strong>State</strong>wide <strong>Planning</strong> ProgramPage 5-9December 2012BICYCLEDESIGNECONOMICDEVELOPMENTEMERGENCYRESPONSEENVIRONMENTEQUITYFINANCEHIGHWAYINTERMODALLAND USE ANDCORRIDORSPEDESTRIANPLANNINGSAFETYTRANSIT
DESIGNGOAL DOBJECTIVES D.1.aD.1.bD.1.cD.1.dPOLICIES D.2.aD.2.bD.2.cD.2.dD.2.eD.2.fD.2.gStrive for excellence in design <strong>of</strong> transportation projects to enhance safety, security, mobility, environmental stewardship, aestheticquality, and community livability.Improve safety for all users. (See Safety Section)Improve mobility by designing roadways that accommodate pedestrians, cyclists, and the mobility impaired as well as vehicular travel.Improve air and water quality. (See Environmental Section)Improve appearance, community livability, and business viability.Utilize context sensitive design solutions for roads and streets which respond to the environs in which they are located, while adheringto appropriate requirements for safety and capacity. These must be flexible to adapt to different situations and must consider bicycleand pedestrian accommodations where feasible.Emphasize effective and attractive signage that clearly conveys essential safety and directional information to travelers. Whereappropriate, employ gateway signage to distinguish regions and themes and to provide increased identification for transportationfacilities, business and civic centers, historic districts, institutions, tourist destinations, and natural features like rivers and watersheds.Enhance community livability and create inviting public spaces through traffic calming, pedestrian amenities, view corridors, andattractive landscaping, where appropriate.Manage vegetation in transportation rights-<strong>of</strong>-way for multiple objectives: safety, air and water quality, noise reduction, communityaesthetics, and natural habitat values.Encourage communities to identify design objectives (including bicycle, pedestrian, landscaping and aesthetic goals) for arterials,gateways, major intersections, and collector streets in local comprehensive plans, especially for designated scenic routes andconnection to appropriate business areas.Consider environmental enhancements, noise reduction, and energy efficiency in facility design and construction.Support reduction in the number <strong>of</strong> billboards and other outdoor advertising to enhance the visual quality <strong>of</strong> the transportation system.Ensure that electronic outdoor advertising is limited to avoid driver distraction.<strong>Transportation</strong> <strong>2035</strong> (2012 Update)<strong>State</strong> Guide Plan Element 611RI <strong>State</strong>wide <strong>Planning</strong> ProgramPage 5-10December 2012BICYCLEDESIGNECONOMICDEVELOPMENTEMERGENCYRESPONSEENVIRONMENTEQUITYFINANCEHIGHWAYINTERMODALLAND USE ANDCORRIDORSPEDESTRIANPLANNINGSAFETYTRANSIT
DESIGNSTRATEGIES D.3.aD.3.bD.3.cD.3.dD.3.eD.3.fD.3.gD.3.hD.3.iPromote the development and management <strong>of</strong> transportation corridors as greenways, that have the appearance <strong>of</strong> parkways andboulevards.Encourage the retention and use <strong>of</strong> vegetated buffers to reduce stormwater run<strong>of</strong>f from highways and parking lots, lessen air qualityimpacts, and to serve as noise barriers along high-volume highways and rail corridors.Encourage communities to require the reservation <strong>of</strong> planting strips <strong>of</strong> sufficient width for street trees in plans for new streets androads approved under local subdivision and land development review provisions.Redesign curb cuts and improve sidewalk conditions to facilitate movement <strong>of</strong> wheelchair-assisted travelers, particularly near transitstops. Insure compliance <strong>of</strong> “as built” conditions with ADA guidelines. Utilize the most effective crosswalk designs based on industryresearch.Work with communities to implement traffic-calming measures where appropriate to slow traffic speeds in built-up areas. Encourageparticipation <strong>of</strong> local residents in design <strong>of</strong> traffic calming measures which may include on-street parking, roundabouts, and restoration<strong>of</strong> two-way traffic on one-way streets.Continue to <strong>of</strong>fer 50% participation when replacing overhead utility lines underground when highway construction requires theirrelocation in "Main Street" areas or other areas <strong>of</strong> economic or natural significance.Urban parking garages should have ground floor retail, and urban parking lots should have "liner" buildings with retail activities tocreate more walkable environments.Utilize Best Management Practices and most current design standards in all areas <strong>of</strong> design.Continue to <strong>of</strong>fer opportunities for local governments and non-pr<strong>of</strong>it groups to implement non-traditional transportation projects throughthe <strong>Transportation</strong> Enhancement program funded and administered by RIDOT.<strong>Transportation</strong> <strong>2035</strong> (2012 Update)<strong>State</strong> Guide Plan Element 611RI <strong>State</strong>wide <strong>Planning</strong> ProgramPage 5-11December 2012BICYCLEDESIGNECONOMICDEVELOPMENTEMERGENCYRESPONSEENVIRONMENTEQUITYFINANCEHIGHWAYINTERMODALLAND USE ANDCORRIDORSPEDESTRIANPLANNINGSAFETYTRANSIT
ECONOMIC DEVELOPMENT | employment, freight, downtown, and tourismGOAL EDOBJECTIVES ED.1.aED.1.bED.1.cED.1.dPOLICIES ED.2.aED.2.bED.2.cED.2.dED.2.eED.2.fED.2.gED.2.hED.2.iSupport a vigorous economy by facilitating the multi-modal movement <strong>of</strong> freight and passengers within <strong>Rhode</strong> <strong>Island</strong> and the northeastregion.Move people efficiently to and from work and school.Move freight efficiently to, from, and within <strong>Rhode</strong> <strong>Island</strong> by all modes.Revitalize and maintain economically healthy “street-centric” downtown areas and village centers.Move tourists and conventioneers efficiently to, from, and within <strong>Rhode</strong> <strong>Island</strong>, especially through public transportation.Proactively work with state agencies and other stakeholders to determine needs <strong>of</strong> employers, employees, un- and under-employedindividuals, and students, and strive for transportation options that support full employment and educational opportunities.Provide viable and affordable transportation options.Support regional examination and planning <strong>of</strong> interstate transportation-related economic development issues.Ensure that freight rail continues to serve the region. Join with other New England states in participating in decision-making onchanges in regional rail service, such as changes in ownership, rate structure, maintenance <strong>of</strong> the network, and accommodatingintercity passenger rail service.Encourage provision <strong>of</strong> all appropriate transportation services and facilities at key freight locations including freight rail, highway, port,airport, transit, and commuter alternatives. Consider short sea shipping opportunities.Use transportation to support economic development that takes place in existing built-up areas or on prime sites suitable for intensivedevelopment. <strong>Transportation</strong> investments should support both intra and interstate regional economic development opportunities.Examples are development <strong>of</strong> prime industrial sites in Quonset Davisville, Cranston and East Providence; Warwick's proposed mixedusecenter near the airport; and the Blackstone Valley in a way that preserves its historic and natural character.Use transportation investments to support community economic development including village centers, “Main Streets”, centralbusiness districts, and brownfields.Utilize transportation investments to support tourism, one <strong>of</strong> the state's most important industries. Strengthen linkages between theProvidence metropolitan center, air and rail terminals, and tourist attractions in Newport, South County, and the Blackstone Valley.Recognize Narragansett Bay as a critical waterway and transportation asset for fuel transport and other freight.<strong>Transportation</strong> <strong>2035</strong> (2012 Update)<strong>State</strong> Guide Plan Element 611RI <strong>State</strong>wide <strong>Planning</strong> ProgramPage 5-12December 2012BICYCLEDESIGNECONOMICDEVELOPMENTEMERGENCYRESPONSEENVIRONMENTEQUITYFINANCEHIGHWAYINTERMODALLAND USE ANDCORRIDORSPEDESTRIANPLANNINGSAFETYTRANSIT
ECONOMIC DEVELOPMENT | employment, freight, downtown, and tourismSTRATEGIES ED.3.aED.3.bED.3.cED.3.dED.3.eED.3.fED.3.gED.3.hED.3.iED.3.jED.3.kED.3.lDevelop transportation strategies to implement welfare-to-work goals, as a cooperative effort among the Department <strong>of</strong> HumanServices, the Department <strong>of</strong> Labor and Training, RIEDC, RIPTA, RIDOT, and the <strong>State</strong>wide <strong>Planning</strong> Program. Utilize existingresources where feasible.Encourage dialogue with private businesses to design innovative transportation strategies that will help low-income residents andindividuals who do not own cars access employment, particularly jobs in suburban areas.Determine the needed transit, ridesharing, and bicycle/pedestrian facilities and services for the increased number <strong>of</strong> commuters.Provide these facilities and services, so as to maximize the efficiency <strong>of</strong> the transportation system.Continue transportation initiatives that enable low income workers and job seekers to access job opportunities and achieve economicindependence.Expand the Access to Jobs/Reverse Commute Program to include additional municipalities and welfare populations. Increasedfunding and program expansion will help ensure that additional unemployed populations experiencing transportation difficulties benefitfrom access to the program.Investigate HUD’s “Bridges to Work” model to involve employers in provision <strong>of</strong> transportation for low-income employees.Incorporate additional state agencies as partners in addressing transportation inequities in job access. The Department <strong>of</strong> Labor andTraining and the <strong>Rhode</strong> <strong>Island</strong> Economic Development Corporation should be included in discussions with transportation agencies.Provide incentives for employers to <strong>of</strong>fer transportation to low-income employees lacking reliable transportation options. An incentivebasedprogram for suburban employers who <strong>of</strong>fer transportation for low-income urban residents could increase the likelihood thaturban residents can access and maintain well-paying jobs.Consider options for car-sharing programs or car purchase assistance for low-income populations [North Carolina, Tennessee, andNew Jersey have experimented with programs to help low-income families purchase vehicles].Continue to evaluate a full interchange at Route 4 / Interstate 95, and complete the Relocated Route 403 to support the fulldevelopment <strong>of</strong> Quonset Davisville. Construct a new interchange subject to successful outcome <strong>of</strong> environmental and TIP processes.Work with RIDOT, AMTRAK and P&W Railroad to establish reasonable access fees and freight charges on the AMTRAK main line,especially on sections <strong>of</strong> track added through the FRIP. Support bridge clearance programs in other states that open up new marketsfor freight rail.Complete development <strong>of</strong> the Warwick Intermodal Rail Station, plan for rail shuttle service to provide a direct rail connection fromProvidence to T.F. Green <strong>State</strong> Airport, and support revitalization <strong>of</strong> the adjacent Warwick Station District.<strong>Transportation</strong> <strong>2035</strong> (2012 Update)<strong>State</strong> Guide Plan Element 611RI <strong>State</strong>wide <strong>Planning</strong> ProgramPage 5-13December 2012BICYCLEDESIGNECONOMICDEVELOPMENTEMERGENCYRESPONSEENVIRONMENTEQUITYFINANCEHIGHWAYINTERMODALLAND USE ANDCORRIDORSPEDESTRIANPLANNINGSAFETYTRANSIT
ECONOMIC DEVELOPMENT | employment, freight, downtown, and tourismSTRATEGIES(continued)PERFORMANCEMEASURESED.3.mED.3.nED.3.oED.3.pED.3.qED.3.rED.3.sED.3.tED.3.uED.3.vED.3.wED.4.aED.4.bED.4.cED.4.dStudy improved access to the Port <strong>of</strong> Providence from the Interstate system and rail improvements within the terminal area.Use transportation system investments strategically to support the economic vitality <strong>of</strong> historic “Main Streets” and similar traditionalvillage and business centers, as well as brownfields and mill villages.Encourage cities and towns to regulate maximum as well as minimum number <strong>of</strong> parking spaces in their development regulations togive incentives to use alternative modes. Encourage shared parking where differences in peak hour demand allows.Use the <strong>Transportation</strong> Enhancements Program funded and administered by RIDOT to encourage urban revitalization, such as “MainStreet <strong>Rhode</strong> <strong>Island</strong>” restoration activities.Continue to make traffic, construction, and lane closure information available on RIDOT's website.Utilize signs at "gateway" locations, to direct tourists to key destination points. Work with regional and local tourism organizations.Emphasize effective and attractive signage that clearly conveys essential safety and directional information to travelers. Whereappropriate, employ gateway signage to distinguish regions and themes and to provide increased identification for transportationfacilities, business and civic centers, historic districts, institutions, tourist destinations, and natural features like rivers and watersheds.Consider designating "scenic drives" throughout the state.Encourage state financing assistance to developments in areas that are transit accessible.Develop incentives to encourage employers to locate in older central city centers, where transit or other modes are available.Locate sites for new or expanded truck rest areas. Upgrade current rest areas to include electricity, lighting and other facilities asappropriate.Identify and map• Interstate and STRAHNET bridges and overpasses that do not meet 16’ federal defense clearance standard• <strong>State</strong> highway locations with high-wide clearance or weight restrictions• Rail locations with high-wide clearance or weight restrictionsRecruit one new college or university per year for 5 years for RIPTA’s University Pass Program.Freight [see Highway Performance Measures related to congestion and infrastructure condition].Increase Providence – Newport ferry ridership (almost exclusively leisure/tourism trips) from 38,576 in 2003 by 3% per year.Increase summer ridership on RIPTA Route 67 (Newport mansions). Set baseline when new farebox system is installed.<strong>Transportation</strong> <strong>2035</strong> (2012 Update)<strong>State</strong> Guide Plan Element 611RI <strong>State</strong>wide <strong>Planning</strong> ProgramPage 5-14December 2012BICYCLEDESIGNECONOMICDEVELOPMENTEMERGENCYRESPONSEENVIRONMENTEQUITYFINANCEHIGHWAYINTERMODALLAND USE ANDCORRIDORSPEDESTRIANPLANNINGSAFETYTRANSIT
EMERGENCY RESPONSEGOAL EROBJECTIVES ER.1.aER.1.bER.1.cPOLICIES ER.2.aER.2.bER.2.cER.2.dER.2.eER.2.fER.2.gER.2.hER.2.iER.2.jER.2.kDevelop transportation and communication systems that serve <strong>Rhode</strong> <strong>Island</strong>ers and the region in the event <strong>of</strong> natural disasters,accidents, and acts <strong>of</strong> terrorism in a manner that minimizes injury, loss <strong>of</strong> life, and disruption to the economy; facilitates evacuation <strong>of</strong>people; and allows emergency response and recovery activities to occur.Provide a functional system <strong>of</strong> hurricane evacuation routes.Provide functional diversion routes for Interstates and other major highways.Provide uncongested routes to hospitals with emergency care facilities.Projects that serve a dual purpose (such as congestion relief and emergency response) should be given greater consideration thansingle purpose projects.Invest transportation resources in infrastructure such as communications facilities that benefit the transportation system.Continue to improve and enhance interstate communication and cooperation through the I-95 Corridor Coalition and direct contact withagencies in Massachusetts and Connecticut.Employ prevention and mitigation strategies in design <strong>of</strong> new projects.Coordinate with US Coast Guard and others in assessing safety risks <strong>of</strong> transporting potentially hazardous cargo on Narragansett Bayand throughout the state on other modes.Promote redundancy in key transportation infrastructure (including highway, transit, rail, airports, pipeline, ports, and shippingchannels) to ensure continued passenger and freight service in case one or more modes becomes unavailable for any reason.Emphasize training for state and local <strong>of</strong>ficials as a means to maintain highest state <strong>of</strong> readiness and preparedness. Encouragetraining exercises with federal and regional partners.Emphasize the importance <strong>of</strong> communication and coordination between state and local governments to achieve effective responseand recovery.Disseminate information to the general public in a timely manner to improve preparedness and facilitate response and recovery.Ensure that RI’s 911 system remains functional and that dedicated funding streams are not diverted to other uses.Proactively plan for evacuation <strong>of</strong> transit dependent populations and people with disabilities.<strong>Transportation</strong> <strong>2035</strong> (2012 Update)<strong>State</strong> Guide Plan Element 611RI <strong>State</strong>wide <strong>Planning</strong> ProgramPage 5-15December 2012BICYCLEDESIGNECONOMICDEVELOPMENTEMERGENCYRESPONSEENVIRONMENTEQUITYFINANCEHIGHWAYINTERMODALLAND USE ANDCORRIDORSPEDESTRIANPLANNINGSAFETYTRANSIT
EMERGENCY RESPONSESTRATEGIES ER.3.aER.3.bER.3.cER.3.dER.3.eER.3.fER.3.gER.3.hER.3.iER.3.jER.3.kProject development should incorporate Best Management Practices and most recent design standards (such as blast-pro<strong>of</strong>ing,surveillance, fencing, hardening, seismic retr<strong>of</strong>itting, bicycle storage, jersey barrier breaks, traffic signal prioritization, fiber-optic cableinstallation in roadways, communication interoperability, etc.)Improve diversionary roads and alternate facilities to function in the event <strong>of</strong> an emergency. [Diversionary routes for Interstates andother major highways were identified in 2003.] Update as necessary and identify network deficiencies including ITS infrastructure.Monitor and update hurricane evacuation plan, and continue with operational planning for traffic control points and pre-positionedtowing and fuel trucks. Update evacuation plans for Providence in light <strong>of</strong> increased population in vulnerable downtown areas. Payspecial attention to populations without vehicles.Monitor traffic congestion near hospitals with emergency facilities and respond with appropriate traffic control measures as necessary.Continue to implement RI Tactical Emergency Response Network (statewide communication system).Continue to deploy ITS hardware as prescribed in "<strong>Rhode</strong>WAYS" and install fiber-optic cable conduit in all appropriate areas duringhighway reconstructions. Maintain and adhere to Incident Response Plan and continue to convene Incident Management Task Force.Coordinate early school and work dismissal due to heavy snow or other such events.Prepare Evacuation Plan for Kennedy Plaza and identify site for alternate transit hub.Encourage cities and towns to address homeland security and emergency response in the comprehensive planning process, andprovide necessary guidance.Utilize ITS and public transit to better manage travel during heavy snow and rain events.Conduct risk assessment for transportation <strong>of</strong> hazardous cargo over critical infrastructure and through densely populated areas.PERFORMANCEMEASURESER.4.aImprove incident clearance time on Interstate highways from an average time <strong>of</strong> 40 minutes in 2008 to 38 minutes in 2010, 35 minutesin 2020, and 30 minutes in 2030.ER.4.b Primary routes to all hospitals with emergency care facilities should function at Level <strong>of</strong> Service C or better by 2015.<strong>Transportation</strong> <strong>2035</strong> (2012 Update)<strong>State</strong> Guide Plan Element 611RI <strong>State</strong>wide <strong>Planning</strong> ProgramPage 5-16December 2012BICYCLEDESIGNECONOMICDEVELOPMENTEMERGENCYRESPONSEENVIRONMENTEQUITYFINANCEHIGHWAYINTERMODALLAND USE ANDCORRIDORSPEDESTRIANPLANNINGSAFETYTRANSIT
ENVIRONMENT | air, water, energy, community livabilityGOAL ENOBJECTIVES EN.1.aEN.1.bEN.1.cEN.1.dPOLICIES EN.2.aEN.2.bEN.2.cEN.2.dEN.2.eEN.2.fRecognize, protect and enhance the quality <strong>of</strong> the state’s environmental resources and the livability <strong>of</strong> its communities through welldesignedtransportation projects and effective operation <strong>of</strong> the transportation system.Improve air quality.Manage stormwater run<strong>of</strong>f from roadways to improve quality <strong>of</strong> receiving waters.Conserve energy.Enhance community livability and visual quality.Reduce emissions <strong>of</strong> air pollutants and greenhouse gases from mobile sources, and conserve energy by reducing vehicles milestraveled; reducing the number <strong>of</strong> single occupant vehicle trips; promoting increased usage <strong>of</strong> high efficiency vehicle technologies; andretaining vegetated buffers.Manage stormwater run<strong>of</strong>f from roadways and reduce pollutants through retr<strong>of</strong>it and maintenance <strong>of</strong> stormdrains, implementation <strong>of</strong>best management practices, retention <strong>of</strong> trees within rights-<strong>of</strong>-way to provide vegetated buffers for infiltration, limiting the use <strong>of</strong> deicingchemicals (consistent with safety), and other approaches, especially within the watersheds <strong>of</strong> impaired waters and overgroundwater aquifers. Promote the use <strong>of</strong> “grassy strips” for snow storage.Utilize transportation programs and projects to maintain and enhance environmental quality and community livability, by includingpractices such as historic and scenic preservation, open space acquisition, landscaping, streetscaping, and recycling to improveaesthetics, and contribute to water and air quality improvements.Ensure that the transportation planning and project programming embrace the principles <strong>of</strong> environmental stewardship throughmeasures to avoid, minimize, or mitigate cumulative environmental impacts on affected communities. Utilize existing and newenvironmental resource data to estimate the additional burdens or benefits projects will have on wildlife, air quality and water quality.Minimize conflicts between the transportation system and wildlife resources.Acknowledge that sea-level rise may threaten transportation facilities, and plan infrastructure improvements accordingly. (See PL.3.v)<strong>Transportation</strong> <strong>2035</strong> (2012 Update)<strong>State</strong> Guide Plan Element 611RI <strong>State</strong>wide <strong>Planning</strong> ProgramPage 5-17December 2012BICYCLEDESIGNECONOMICDEVELOPMENTEMERGENCYRESPONSEENVIRONMENTEQUITYFINANCEHIGHWAYINTERMODALLAND USE ANDCORRIDORSPEDESTRIANPLANNINGSAFETYTRANSIT
ENVIRONMENT | air, water, noise, energy, community livabilitySTRATEGIES EN.3.aEN.3.bEN.3.cEN.3.dEN.3.eEN.3.fEN.3.gEN.3.hEN.3.iReduce VMT’s and SOV’s through development and utilization <strong>of</strong> alternative travel modes (bus, rail, and ferry transit, bicycle, andpedestrian) and encouraging ride-sharing (carpools and vanpools).Promote adoption <strong>of</strong> municipal land development provisions that require integration <strong>of</strong> bicycle and pedestrian facilities (bikeways, bikelanes, and bicycle user facilities; paths, sidewalks, nature trails) as part <strong>of</strong> development and redevelopment.Retain and expand vegetated buffers and other landscape elements within transportation corridor rights <strong>of</strong> way and within privatedevelopments (especially those in urban areas or receiving public support) wherever possible to filter stormwater, improve air quality,act as a noise buffer, mitigate heat island effects, and improve the visual quality. (See related recommendations <strong>of</strong> the Urban ForestElement <strong>of</strong> the <strong>State</strong> Guide Plan.) Utilize BMP’s in mowing to avoid erosion and according to plant and flower self-seeding seasons.Remove non-native invasive species where feasible. Strive for a 2:1 wetland replacement ratio on site.Manage highway run<strong>of</strong>f as a system wide mitigation measure to improve water quality and maintain watershed integrity. To the extentpossible, retain stormwater in the rights <strong>of</strong> way <strong>of</strong> state highways. Implement the six Phase II minimum requirements under thefederal/state stormwater management programs. Fund and implement stormwater retr<strong>of</strong>its and best management practices in areasdesignated as priorities by DEM 303(d) list and where transportation corridors intersect bodies <strong>of</strong> water. Continue cooperation andconsultation with DEM and the Coastal Resources Management Council (CRMC), and coordinate with municipalities on the designand construction <strong>of</strong> efficient and environmentally friendly stormwater drainage systems, including the construction <strong>of</strong> stormwaterretr<strong>of</strong>it “best management practices” identified through DEM’s TMDL Program. Promote pre-treatment for stormwater for infiltrationand use <strong>of</strong> porous pavements over recharge areas. Ensure that maintenance <strong>of</strong> highway stormwater drainage systems (includingstreet sweeping) is a funded priority. Explore opportunities to test stormwater for possible use in irrigation.Continue to add alternative fuel technology vehicles to the state and local vehicle fleets while promoting diesel retr<strong>of</strong>itting <strong>of</strong> oldervehicles. Encourage greater use <strong>of</strong> hybrid electric / gasoline vehicles that do not require special fueling stations. Continue to replace orupgrade older transit vehicles with clean fuel vehicles. Implementation <strong>of</strong> school bus diesel retr<strong>of</strong>its should begin in urban schooldistricts where children are exposed to higher levels <strong>of</strong> air pollution.Support passage <strong>of</strong> legislation establishing a Vehicle Efficiency Incentive Program that provides rebates to purchasers <strong>of</strong> new fuelefficient vehicles, funded by fees charged to purchasers <strong>of</strong> inefficient vehicles.Effectively use Intelligent <strong>Transportation</strong> System technologies to reduce recurring and non-recurring congestion and thereby reducingidling emissions. Electrify major truck stops to provide shore power to vehicles during mandated rest periods. Support controls onunnecessary idling <strong>of</strong> diesel trucks and buses.Take prudent and cost effective measures to minimize noise pollution, such as quieter pavements and vegetation buffers.Continue to utilize the <strong>Transportation</strong> Enhancement, Congestion Mitigation / Air Quality, and Safe Routes To School Programs to fundprojects that benefit the environment.<strong>Transportation</strong> <strong>2035</strong> (2012 Update)<strong>State</strong> Guide Plan Element 611RI <strong>State</strong>wide <strong>Planning</strong> ProgramPage 5-18December 2012BICYCLEDESIGNECONOMICDEVELOPMENTEMERGENCYRESPONSEENVIRONMENTEQUITYFINANCEHIGHWAYINTERMODALLAND USE ANDCORRIDORSPEDESTRIANPLANNINGSAFETYTRANSIT
ENVIRONMENT | air, water, noise, energy, community livabilitySTRATEGIES(continued)PERFORMANCEMEASURESEN.3.jEN.3.kEN.3.lEN.3.mEN.3.nEN.3.oEN.4.aEN.4.bEN.4.cEN.4.dEN.4.eAccelerate replacement <strong>of</strong> incandescent bulbs in traffic and pedestrian signals with Light Emitting Diodes (LED’s)Develop an improved motor vehicle registration system to provide accurate and current data for use in air quality analyses.Accommodate wildlife populations along highways with such things as “critter crossings”, deer reflectors and animal friendly culvertdesigns.Encourage the use <strong>of</strong> solar energy, and “green” design and construction practices in transportation projects.Recognize culturally significant stone landscapes in EIS and EA process <strong>of</strong> transportation project development.Encourage state <strong>of</strong>ficials to work with the MBTA and other parties on future electrification <strong>of</strong> the commuter rail system.Mode split (as defined by US Census Journey to Work)Reduce “Drive Alone” from 80% in 2000 to 79% in 2010, 78% in 2020, and 77.1% in 2030.Increase “Carpool” from 10.4% in 2000 to 10.6% in 2010, 10.9% in 2020, and 11.1% in 2030.Increase “Walk or Work at Home” from 6.1% in 2000 to 6.4% in 2010, 6.6% in 2020 and 6.9% in 2030.Increase “Other” [includes bicycle] from 1.0% in 2000 to 1.2% in 2010, 1.5% in 2020, and 1.7% in 2030.Transit ridership (see Transit section).Meet reasonable further progress goals for VOC and NOx emissions; attain the 8-hour standard <strong>of</strong> 0.075 parts per million; andcontinue attainment <strong>of</strong> all other NAAQS.Reduce Greenhouse Gas emissions to 1990 levels by 2010 and to 90% <strong>of</strong> 1990 levels by 2020 consistent with New EnglandGovernors and Eastern Canadian Premiers pact.Attainment <strong>of</strong> goals established for water bodies in RIDEM’s 303d report.EN.4.f Reduce gallons <strong>of</strong> gasoline purchased from 400,000,000 gallons in 2002 to 379,000,000 gallons (1990 level) in 2010, 341,000,000(10% below 1990 level) in 2020, and 320,000,000 in 2030.<strong>Transportation</strong> <strong>2035</strong> (2012 Update)<strong>State</strong> Guide Plan Element 611RI <strong>State</strong>wide <strong>Planning</strong> ProgramPage 5-19December 2012BICYCLEDESIGNECONOMICDEVELOPMENTEMERGENCYRESPONSEENVIRONMENTEQUITYFINANCEHIGHWAYINTERMODALLAND USE ANDCORRIDORSPEDESTRIANPLANNINGSAFETYTRANSIT
EQUITYGOAL EQOBJECTIVES EQ.1.aEQ.1.bPOLICIES EQ.2.aEQ.2.bEQ.2.cSTRATEGIES EQ.3.aEQ.3.bEQ.3.cEQ.3.dEQ.3.eEnsure that the transportation system equitably serves all <strong>Rhode</strong> <strong>Island</strong>ers regardless <strong>of</strong> race, ethnic origin, income, age, mobilityimpairment, or geographic location.Provide equitable access to transportation services.Provide equitable distribution <strong>of</strong> transportation projects and improvements.Proactively work with state agencies and other stakeholders to determine needs <strong>of</strong> underrepresented population, and strive fortransportation options that encourage independence.Ensure that transportation projects do not place disproportionate adverse environmental or other impacts on any community orpopulation group.Avoid displacement or loss <strong>of</strong> transportation services to populations <strong>of</strong> concern. Work to improve transit and other transportationservices which directly benefit low income, minority, elderly, and disabled populations.Allocate resources through the <strong>Transportation</strong> Improvement Program to provide equitable service outcomes to all populations.Analyze location <strong>of</strong> TIP projects to ensure that various geographic areas and minority areas receive a fair number <strong>of</strong> projects.Give the public better information on transportation modes, such as the availability <strong>of</strong> different modes, the services provided, how theyare accessed, and their costs, through all media on a continuous basis. Seek ways to communicate with various ethnic groups.Emphasize public transportation, and include services for disabled people.Provide technical and financial assistance where feasible to private, non-pr<strong>of</strong>it, highly specialized transportation operators servingneeds <strong>of</strong> severely handicapped persons.Amend CMAQ criteria to award more points to projects improving air quality in areas close to freeways and encourage RIDEM toprioritize urban areas in their school bus diesel retr<strong>of</strong>it program.Identify schools within 250 feet <strong>of</strong> interstates and freeways. Conduct historical analysis for EJ populations potential exposure, anddiscourage construction <strong>of</strong> new housing within this zone.PERFORMANCEMEASURESEQ.4.aEQ.4.bIncrease percentage <strong>of</strong> Family Independence Program (FIP) recipients residing within ¼ mile <strong>of</strong> fixed transit route from 91% in 2000 to92% in 2010, 93% in 2020, and 94% in 2030.Maintain transportation spending levels and number <strong>of</strong> projects in minority and low-income census tracts at or above the percentage <strong>of</strong>that minority. [For example, in 2000, 8.9% <strong>of</strong> RI’s population was Hispanic. Fifty –five census tracts contained greater than the stateaverage <strong>of</strong> Hispanics. <strong>Transportation</strong> spending and number <strong>of</strong> projects in those 55 tracts should equal or exceed 8.9% in TIPcategories <strong>of</strong> Enhancements, Highway, Pavement Management, and Bicycle/Pedestrian.<strong>Transportation</strong> <strong>2035</strong> (2012 Update)<strong>State</strong> Guide Plan Element 611RI <strong>State</strong>wide <strong>Planning</strong> ProgramPage 5-20December 2012BICYCLEDESIGNECONOMICDEVELOPMENTEMERGENCYRESPONSEENVIRONMENTEQUITYFINANCEHIGHWAYINTERMODALLAND USE ANDCORRIDORSPEDESTRIANPLANNINGSAFETYTRANSIT
FINANCEGOAL FOBJECTIVES F.1.aF.1.bF.1.cF.1.dF.1.ePOLICIES F.2.aF.2.bF.2.cF.2.dF.2.eF.2.fF.2.gF.2.hProvide a sustainable financial base for the transportation system that is adequate for supporting needed infrastructure and serviceswith an emphasis on preservation and management <strong>of</strong> the existing system.Increase transportation fundingReduce level <strong>of</strong> transportation bondingProvide long term and sustainable financing for RIPTAEnsure responsible project programming and spendingMaintain sound accounting practicesAggressively seek additional financing sources and mechanisms for transportation projects, including joint development opportunities.Allocate existing user fees to transportation uses and explore new user fees.Phase out the use <strong>of</strong> general obligation bonds to match federal funds Repayment <strong>of</strong> bond debt is a burden on transportationresources. Projects and programs should be funded on a pay-as-you-go basis except for large projects with a long useful life.Support RIPTA with a long term dedicated and sustainable funded program to maintain and improve bus, trolley, and ferry service.Clarify and publicize the priorities for transportation investments and procedures for allocation <strong>of</strong> funds.Ensure that commitments to existing (approved) projects are met before initiating major new projects which require substantial newfunding commitments (except under extraordinary circumstances).Provide RIDOT and RIPTA with the necessary resources to track revenues, expenditures, cost increases, contracts, etc. and reportperiodically to the <strong>Transportation</strong> Advisory Committee.Congressional earmarks that result in the deferral <strong>of</strong> other TIP projects are discouraged.<strong>Transportation</strong> <strong>2035</strong> (2012 Update)<strong>State</strong> Guide Plan Element 611RI <strong>State</strong>wide <strong>Planning</strong> ProgramPage 5-21December 2012BICYCLEDESIGNECONOMICDEVELOPMENTEMERGENCYRESPONSEENVIRONMENTEQUITYFINANCEHIGHWAYINTERMODALLAND USE ANDCORRIDORSPEDESTRIANPLANNINGSAFETYTRANSIT
FINANCESTRATEGIES F.3.aF.3.bF.3.cF.3.dF.3.eF.3.fF.3.gF.3.hF.3.iF.3.jF.3.kF.3.lF.3.mConvert the remaining auto user fees into a transportation fund. This includes motor vehicle registration fees, driver's license fees,and inspection fees.Continue increased allocation <strong>of</strong> gasoline tax revenues to RIPTA and RIDOT and maintain a tax level appropriate to support thetransportation system’s needs. In order to maintain purchasing power, index the gas tax to the inflation rate.Consider tolls as another form <strong>of</strong> user fee where feasible. Study an automated cashless system <strong>of</strong> collection where toll facilities are orcould be used. Also, study variable toll structures based on time <strong>of</strong> day and vehicle weights.Use debt financing judiciously for major capital projects.Provide sufficient seed funding for the new <strong>Rhode</strong> <strong>Island</strong> <strong>State</strong> Infrastructure Bank.Consider Special Benefit Assessment Districts and Business Improvement Districts (BID). Property owners would be assessed fornew highway improvements that support an area. This type <strong>of</strong> designation may require legislation.Designate Transit Services Districts (TSD). Property owners would be assessed for transit service in lieu <strong>of</strong> creation <strong>of</strong> parkingfacilities in urban areas.Allow Infrastructure Equity Contributions by abutters, also known as stakeholders’ investments. Special “densification zoning” assiststhis undertaking.Consider the use <strong>of</strong> dedicated sales taxes (such as was done for Depositors Economic Protection Corporation [DEPCO]) to reducetransportation bond indebtedness.Phase out reliance on bonds to fund system preservation costs, by shifting to user fees and tax revenues.Recognize that even allocation <strong>of</strong> all gasoline tax revenues (at the current level) will not be sufficient to meet RIDOT and RIPTA needsfor operations, debt service, and match for federal capital funds. New financing sources must be developed as soon as possible, withthe intent to reduce reliance on bonding and debt service, while maintaining services.Develop a fare structure for paratransit service, and charge a fare for all paratransit services. (At present, fares are charged only toAmericans with Disabilities/ADA clients.) Give incentives to riders to use the less costly fixed-route bus system over paratransitservices to meet their basic transportation needs where applicable. Charge an administrative fee for paratransit services to coverRIde administrative costs. In accordance with the amount <strong>of</strong> services consumed, continue to use FTA Elderly and Persons withDisabilities Funding Program to purchase vehicles for RIde Program.Work to achieve RIPTA’s target for transit revenues as a percentage <strong>of</strong> operating costs, and promote early accomplishment. RIPTAhas set a goal (F.4.d) <strong>of</strong> recovering 35 percent <strong>of</strong> operating costs from farebox revenues.<strong>Transportation</strong> <strong>2035</strong> (2012 Update)<strong>State</strong> Guide Plan Element 611RI <strong>State</strong>wide <strong>Planning</strong> ProgramPage 5-22December 2012BICYCLEDESIGNECONOMICDEVELOPMENTEMERGENCYRESPONSEENVIRONMENTEQUITYFINANCEHIGHWAYINTERMODALLAND USE ANDCORRIDORSPEDESTRIANPLANNINGSAFETYTRANSIT
FINANCESTRATEGIES(continued)F.3.nF.3.oF.3.pF.3.qF.3.rF.3.sF.3.tF.3.uQuantify unfunded federal mandates, in particular ADA service, which is escalating each year.Work on development <strong>of</strong> a fare structure for human and educational services that purchase and/or provide transportation services inconjunction with their primary responsibilities.Establish a state-funded grant program for municipalities to help fund local road improvements (resurfacing and rehabilitation,sidewalks, bike routes, traffic calming, Safe Routes To School, etc.) Use a formula that includes factors such as road mileage,functional classification, and vehicle registrations.Continue to develop and distribute the <strong>Transportation</strong> Improvement Program (TIP) using an extensive public involvement process.Periodically review and revise the TIP project selection criteria to support the goals and objectives <strong>of</strong> this plan. Amend the TIP asnecessary pursuant to established procedures.Calculate and publicize the costs and benefits <strong>of</strong> major transportation investments.Select more projects that are lower in cost, faster to implement, and give more transportation performance for the dollar.Provide TIP status reports (including project and funding status) periodically to the <strong>Transportation</strong> Advisory Committee (TAC).Install an accounting system that can track all project costs, including design.PERFORMANCEMEASURESF.4.aThe transportation program should increase at least with inflation rate through 2030 to provide for a responsibly maintained systemthat is in a state <strong>of</strong> good repair and does not rely upon debt financing..F.4.b Phase out the use <strong>of</strong> general obligation bonds used to match federal funds by 2010.F.4.c Project cost overruns should not exceed 10%.F.4.dIncrease RIPTA’s fixed-route farebox recovery ratio until it reaches 35 percent. (Set baseline when one year <strong>of</strong> new farebox data isavailable.)<strong>Transportation</strong> <strong>2035</strong> (2012 Update)<strong>State</strong> Guide Plan Element 611RI <strong>State</strong>wide <strong>Planning</strong> ProgramPage 5-23December 2012BICYCLEDESIGNECONOMICDEVELOPMENTEMERGENCYRESPONSEENVIRONMENTEQUITYFINANCEHIGHWAYINTERMODALLAND USE ANDCORRIDORSPEDESTRIANPLANNINGSAFETYTRANSIT
HIGHWAYGOAL HOBJECTIVES H.1.aH.1.bH.1.cH.1.dH.1.ePOLICIES H.2.aH.2.bH.2.cH.2.dH.2.eH.2.fMaintain the highway and bridge network in a safe, attractive, and less congested condition to carry passenger vehicles, commercialvehicles, government vehicles, and transit vehicles, as well as bicycles and pedestrians. Recognize roadways as vital public spacesthat accommodate travel, commerce, community activities, and utility infrastructure.Maintain infrastructure.Improve deficiencies.Minimize congestion.Manage growth in vehicular travel demand.Increase safety.Give priority to preserving and managing the transportation system. Follow regularly scheduled programs <strong>of</strong> pavement and bridgemanagement to prevent highway structures from premature deterioration, resulting in safety hazards and the need for more frequentand costly full rehabilitation or replacement.Address deficiencies in the transportation system (safety, condition, capacity, sidewalks, etc.).Minimize recurring and non-recurring congestion through increased use <strong>of</strong> other travel modes, effective incident management andaccess management, and traffic flow improvements.Encourage alternatives to single-occupant auto travel, such as transit, carpools, vanpools, and bicycle and pedestrian travel to helpreduce vehicle-miles <strong>of</strong> travel, conserve energy, improve air quality, benefit the environment in other ways, and support the economy.Consider expansion <strong>of</strong> capacity on key regional transportation facilities where it is shown to be cost-effective and justified by long termsystem benefits, and following evaluation <strong>of</strong> alternate modes and community impacts.Continue support <strong>of</strong> RIDOT’s Incident Management Program and <strong>Transportation</strong> Management Center (TMC). Aggressively implementIntelligent <strong>Transportation</strong> Systems to all limited access highways and appropriate state routes. Encourage private sector participationin deployment <strong>of</strong> hardware. Evaluate the effectiveness <strong>of</strong> the TMC before any major expansion is approved.<strong>Transportation</strong> <strong>2035</strong> (2012 Update)<strong>State</strong> Guide Plan Element 611RI <strong>State</strong>wide <strong>Planning</strong> ProgramPage 5-24December 2012BICYCLEDESIGNECONOMICDEVELOPMENTEMERGENCYRESPONSEENVIRONMENTEQUITYFINANCEHIGHWAYINTERMODALLAND USE ANDCORRIDORSPEDESTRIANPLANNINGSAFETYTRANSIT
HIGHWAYSTRATEGIES H.3.aH.3.bH.3.cH.3.dH.3.eH.3.fH.3.gH.3.hH.3.iH.3.jH.3.kH.3.lH.3.mH.3.nEstablish a regularly funded program to preserve the condition and safety <strong>of</strong> existing roads and bridges, drainage systems, andculverts, both state and local.Regularly maintain highway-safety features such as signing, guardrails, lighting, striping, and pavement markings; and pedestrianfacilities such as signals and crosswalks.Replace the Sakonnet River Bridge, and complete Interstate 195 relocation (including the east-bound span <strong>of</strong> the Washington Bridge)as vital links in the Interstate and National Highway Systems.Continue to evaluate a full interchange at Route 4 / Interstate 95 and complete the Relocated Route 403 to support the fulldevelopment <strong>of</strong> Quonset Davisville. Construct a new interchange subject to successful outcome <strong>of</strong> environmental and TIP processes.Provide necessary resources to strengthen enforcement <strong>of</strong> truck weight laws to reduce early deterioration <strong>of</strong> roads.Continue to utilize pavement and bridge management systemsContinue RIDOT’s bridge washing program to reduce bridge corrosion and maintain bridge life.Keep up with repair and scheduled replacement <strong>of</strong> facilities, vehicles, and equipment.Work with cities and towns to provide more visible signage (particularly at night) to identify major arterial routes. Signage identifyingthe main route is needed in addition to identification <strong>of</strong> major cross-streets.Create a statewide Access Management Program beginning with a pilot program, to be monitored through the CongestionManagement Process.Work with private employers to provide incentive programs (parking cash-out credits) for public transit usage, bicycle usage,carpooling, and other alternatives to single occupancy vehicle usage. Encourage private sector and government participation in EPA'sCommuter Choice Leadership Initiative and Best Workplaces for Commuters.Develop a program for state government, as a major employer leading by example, to encourage alternative modes. For example,the existing policy <strong>of</strong> providing free parking for state employees does not encourage transit use. Promote greater use <strong>of</strong> financialincentives, similar to those provided by the private sector. Develop a telecommuting policy as an option to reduce travel demand.Establish safe satellite parking lots in conjunction with shuttle services to promote transit to special events, tourist attractions, anddowntown areas. Provide commuter parking in prime commuting corridors and areas.Integrate the <strong>State</strong>’s Congestion Management and Air Quality planning process within the travel corridor planning process.<strong>Transportation</strong> <strong>2035</strong> (2012 Update)<strong>State</strong> Guide Plan Element 611RI <strong>State</strong>wide <strong>Planning</strong> ProgramPage 5-25December 2012BICYCLEDESIGNECONOMICDEVELOPMENTEMERGENCYRESPONSEENVIRONMENTEQUITYFINANCEHIGHWAYINTERMODALLAND USE ANDCORRIDORSPEDESTRIANPLANNINGSAFETYTRANSIT
HIGHWAYSTRATEGIES(continued)H.3.oH.3.pH.3.qH.3.rH.3.sH.3.tH.3.uH.3.vH.3.wH.3.xH.3.yGive greater priority to implementing systems for the prioritization <strong>of</strong> traffic signals to reduce bus travel time in congested corridors.Manage traffic incidents with the TMC's Incident Management Program.Promote lower volume highways as alternatives to high-volume routes (for example, I-295 instead <strong>of</strong> I-95, US-1 instead <strong>of</strong> RI-138 insouthern <strong>Rhode</strong> <strong>Island</strong>), for long-distance trips and when destinations are reasonably accessible from the circumferential route.Should the navy determine that Burma Road is excess to their needs, study its potential to relieve congestion on Routes 114 and 138consistent with the West Side Management Plan prepared by the Aquidneck <strong>Island</strong> <strong>Planning</strong> Commission.Improve traffic flow and safety, through motorist information systems; parking enforcement; well-managed highway construction; andprojects such as synchronized signals, left-turn lanes and signals, and reconfiguration <strong>of</strong> intersections. Trucking, school buses, andtourism are particularly sensitive to severe traffic congestion.Manage traffic incidents (such as breakdowns, accidents, and disruption due to special events) which are a major cause <strong>of</strong> traveldelay. Both rapid response to emergencies and restoration <strong>of</strong> normal flow are essential.Begin planning to address current and potential future congestion on the Interstate system by evaluating alternatives – including modeshift potential for passengers and freight, capacity expansion options, and ITS enhancements. Congested conditions already exist onI-295 between Routes 6 and 37 and this roadway may also benefit from short-term solutions such as truck climbing lanes. Futurecongestion is a concern for the two-lane segment <strong>of</strong> I-95 from RI-4 south to the CT border.Consider the role <strong>of</strong> signage readability and placement for congestion alleviation.Give the public better information on transportation. Include educational and promotional materials. Institute user-friendlycommunication technologies for the traveling public, such as the “511” program. Continue to improve web sites.Mainstream the consideration <strong>of</strong> future ITS infrastructure needs in corridor studies and within the design phase <strong>of</strong> major reconstructionprojects involving state arterials. Consider fiber optic cable conduit for all state roads when work is planned in TIP.Reevaluate all aspects <strong>of</strong> parking. Consider changing policies that favor auto travel over alternative modes including provision <strong>of</strong> freeor low cost parking by public entities, minimum parking space requirements for various activities, and tax treatment. Enforcehandicapped parking regulations.Consider modern roundabouts as a viable option in all intersection improvement projects.<strong>Transportation</strong> <strong>2035</strong> (2012 Update)<strong>State</strong> Guide Plan Element 611RI <strong>State</strong>wide <strong>Planning</strong> ProgramPage 5-26December 2012BICYCLEDESIGNECONOMICDEVELOPMENTEMERGENCYRESPONSEENVIRONMENTEQUITYFINANCEHIGHWAYINTERMODALLAND USE ANDCORRIDORSPEDESTRIANPLANNINGSAFETYTRANSIT
HIGHWAYPERFORMANCEMEASURESH.4.aMaintain the Interstate and National Highway Systems at “good” or better pavement condition. Maintain other systems at “fair” orbetter condition.H.4.b Decrease percentage <strong>of</strong> NHS Bridge structural deficiencies from 21% to 15% in 2010 and 10% in 2020 and 5% in 2030.H.4.cMode split: Reduce percentage <strong>of</strong> “Drive Alone” to work from 80% in 2000 to 79% in 2010, 78% in 2020, and 77.1% in 2030. [USCensus]H.4.dH.4.eH.4.fReduce incident clearance time on the interstate highways from an average <strong>of</strong> 40 minutes in 2008 to 38 minutes in 2010, 35 minutesin 2020, and 30 minutes in 2030.Interstate highway system should operate at posted speed limits 80% <strong>of</strong> each 24 hour period.Limit increase in travel time to work to 12% (25.2 minutes) between 2000 and 2010, 10% (27.7 minutes) between 2010 and 2020 and8% (29.9 minutes) in 2030. [Travel time increased 17.2% between 1990 and 2000 to 19.2 minutes.]H.4.g Reduce delay from 21 hours annually per person (in 2001) by 10% in 2015 and 20% in 2030.H.4.hH.4.iVehicle Miles Traveled: Annual growth limited to 1.5% (2.0% is the current projected growth rate used in model).Refer to additional performance measures in the Safety section.<strong>Transportation</strong> <strong>2035</strong> (2012 Update)<strong>State</strong> Guide Plan Element 611RI <strong>State</strong>wide <strong>Planning</strong> ProgramPage 5-27December 2012BICYCLEDESIGNECONOMICDEVELOPMENTEMERGENCYRESPONSEENVIRONMENTEQUITYFINANCEHIGHWAYINTERMODALLAND USE ANDCORRIDORSPEDESTRIANPLANNINGSAFETYTRANSIT
INTERMODALGOAL IProvide convenient intermodal facilities and services <strong>of</strong>fering seamless connections for passengers and freight.OBJECTIVES I.1.aI.1.bI.1.cI.1.dI.1.ePOLICIES I.2.aI.2.bI.2.cI.2.dIncrease use <strong>of</strong> Park and Ride lots.Increase number <strong>of</strong> bicycles on buses.Maintain ferry service and accommodations for bicycles.Expand use <strong>of</strong> freight rail.Facilitate movement between modes.Provide convenient and attractive intermodal connections for passengers between all modes, especially to encourage greater use <strong>of</strong>public transit and non-motorized transportation.Provide ample infrastructure for intermodal movement <strong>of</strong> freight to grow business and sustain residences at reasonable costs.Work with the private sector to improve intermodal connections.Improve coordination with the private sector in freight planning.<strong>Transportation</strong> <strong>2035</strong> (2012 Update)<strong>State</strong> Guide Plan Element 611RI <strong>State</strong>wide <strong>Planning</strong> ProgramPage 5-28December 2012BICYCLEDESIGNECONOMICDEVELOPMENTEMERGENCYRESPONSEENVIRONMENTEQUITYFINANCEHIGHWAYINTERMODALLAND USE ANDCORRIDORSPEDESTRIANPLANNINGSAFETYTRANSIT
INTERMODALSTRATEGIES I.3.aI.3.bI.3.cI.3.dI.3.eI.3.fI.3.gI.3.hI.3.iI.3.jCreate a shared vision for Kennedy Plaza (including Providence Station) as a major intermodal terminal to connect local bus service tointercity bus and rail, commuter rail, paratransit and taxi services, and pedestrian and bicycle routes.Continue existing commuter rail service to Providence through the Pilgrim Partnership. Extend Boston-Providence commuter railservice south in incremental steps to T.F. Green <strong>State</strong> Airport and Wickford Junction under a Phase I start-up service. Additional sitesin Cranston, East Greenwich, Kingston, Pawtucket/Central Falls, Westerly, and West Davisville should be considered and evaluatedbased on demand, operations, infrastructure requirements, site availability, economic development opportunities, community support,and cost. Long term passenger rail opportunities may include Blackstone Valley and Aquidneck <strong>Island</strong>. Support extension <strong>of</strong> MBTAcommuter service to Fall River. Use the FRIP track for passenger rail service.Consider additional "mini transit hubs" (similar to Pawtucket and Newport) at the Pastore Complex, Quonset Davisville, all stateairports, and at other appropriate locations.Maintain and improve connections and amenities at existing terminals, including Point Street Landing, Block <strong>Island</strong> (Old and NewHarbor) Newport Gateway, the Port <strong>of</strong> Galilee, Kingston Station, Westerly Station, and Woonsocket Depot.Maintain, improve, and expand network <strong>of</strong> Park and Ride lots. Add capacity to lots when they reach 80% usage.Utilize existing ferry docks and landings (Point Street, Waterplace Park, Galilee, Block <strong>Island</strong>, Newport Gateway, Fort Adams, QuonsetDavisville, Bristol, Portsmouth, Prudence <strong>Island</strong>, East Greenwich) to their full potential and add new facilities as demand warrants inEast Providence, Warwick (Rocky Point), and other Bay communities. Locate docking facilities for various water transportation modesin Newport. Accommodate high-speed ferry, other ferry services, cruise ship docking, harbor shuttles, and other tourist waterservices.Overcome regulatory barriers to providing RIPTA service to rail stations and Park and Ride lots in Attleboro and Franklin, MA, andStonington, CT. Enhance RIPTA bus service to <strong>Rhode</strong> <strong>Island</strong> train stations.Promote bike/bus/train intermodal connections; for example, by marketing the availability <strong>of</strong> bike racks on RIPTA buses and byproviding bicycle facilities at major intermodal centers.Work with Amtrak, private ferry service operators, and the travel industry to develop streamlined procedures for carrying bicycles ontrains and ferries, and to provide integrated route and schedule information and reservation services oriented toward touring bicyclists.Promote the concept <strong>of</strong> “Complete Streets” in which roadways are designed to function as intermodal corridors for motorists, as wellas pedestrians, bicyclists, and transit users. Features may include spaces for buses to pull <strong>of</strong> the road, wider sidewalks toaccommodate transit shelters, ATIS, enhanced pedestrian features, and bike lanes.<strong>Transportation</strong> <strong>2035</strong> (2012 Update)<strong>State</strong> Guide Plan Element 611RI <strong>State</strong>wide <strong>Planning</strong> ProgramPage 5-29December 2012BICYCLEDESIGNECONOMICDEVELOPMENTEMERGENCYRESPONSEENVIRONMENTEQUITYFINANCEHIGHWAYINTERMODALLAND USE ANDCORRIDORSPEDESTRIANPLANNINGSAFETYTRANSIT
INTERMODALSTRATEGIES(continued)PERFORMANCEMEASURESI.3.jI.3.kI.3.lI.3.mI.3.nI.3.oI.4.aI.4.bThrough RIPTA, provide information on all forms <strong>of</strong> transportation available to the public regardless <strong>of</strong> mode. Information shouldinclude how to access services, costs (if known), and where tickets may be purchased. Provide travel training and information to helppassengers (e.g., elderly, disabled individuals) access and use the fixed-route system and other transportation services.Encourage private employers to provide shuttle service to intermodal facilities.Preserve sufficient acreage along freight rail lines and at key freight terminals (including Port <strong>of</strong> Providence, Quonset Davisville, T.F.Green, and Port <strong>of</strong> Galilee to accommodate intermodal transfers.Study improved access to the Port <strong>of</strong> Providence from the Interstate system and rail improvements within the terminal area.Coordinate and support efforts to consolidate baggage and passenger security screening for multi-modal trips where feasible.Integrate and pursue the recommendations from the following studies: Rail Corridor Study, Waterborne Passenger <strong>Transportation</strong>Study, Aquidneck <strong>Island</strong> West Side <strong>Transportation</strong> Guide Plan and Passenger Rail / Bike Path Study, RIPTA study on coordination <strong>of</strong>fixed-route and paratransit services, South County Commuter Rail Study, and Commercial Vehicle Parking Needs Study.Increase use <strong>of</strong> Park and Ride lots from a system-wide average <strong>of</strong> 62% in 2007 by 3% per year.Note: Park and Ride lots are also used by individuals who are carpooling. They are not used strictly by bus passengers. 30% usagein 2002.Maintain 100% <strong>of</strong> bus fleet with bike racks.<strong>Transportation</strong> <strong>2035</strong> (2012 Update)<strong>State</strong> Guide Plan Element 611RI <strong>State</strong>wide <strong>Planning</strong> ProgramPage 5-30December 2012BICYCLEDESIGNECONOMICDEVELOPMENTEMERGENCYRESPONSEENVIRONMENTEQUITYFINANCEHIGHWAYINTERMODALLAND USE ANDCORRIDORSPEDESTRIANPLANNINGSAFETYTRANSIT
LAND USE AND TRAVEL CORRIDORSGOAL LUOBJECTIVES LU.1.aLU.1.bLU.1.cLU.1.dPOLICIES LU.2.aLU.2.bLU.2.cLU.2.dContinue to integrate land use and transportation planning using a travel corridor framework and promote responsible developmentpractices in the public and private sectors.Emphasize growth in existing or planned centers <strong>of</strong> developmentPreserve open space, scenic corridors, and viewshedsPreserve functionality <strong>of</strong> transportation corridorsReserve land for transportation useAchieve more concentrated development patterns, emphasizing growth in existing urban places -- older cities and their downtowns,historic town centers, and other built-up areas. Promote higher housing densities and greater mix <strong>of</strong> land uses, within the limits <strong>of</strong>basic compatibility. Support and stimulate this development pattern with multi-modal transportation investments and other essentialservices.Support the preservation <strong>of</strong> open space within transportation corridors to maintain the character <strong>of</strong> rural areas <strong>of</strong> the state, to protectcritical resources, provide recreational opportunities, and enhance and reinvigorate urbanized areas.Organize transportation planning in <strong>Rhode</strong> <strong>Island</strong> around a travel corridor framework. Encourage the state and cities and towns towork together to control land development along arterial highways so as to preserve their function, capacity, safety, and appearance.Coordinate land use and congestion management planning and strengthen the state's role in access management and corridorpreservation through corridor plans developed in close cooperation with cities and towns.Promote protection <strong>of</strong> property and rights <strong>of</strong> way to secure the long term transportation needs <strong>of</strong> the state.<strong>Transportation</strong> <strong>2035</strong> (2012 Update)<strong>State</strong> Guide Plan Element 611RI <strong>State</strong>wide <strong>Planning</strong> ProgramPage 5-31December 2012BICYCLEDESIGNECONOMICDEVELOPMENTEMERGENCYRESPONSEENVIRONMENTEQUITYFINANCEHIGHWAYINTERMODALLAND USE ANDCORRIDORSPEDESTRIANPLANNINGSAFETYTRANSIT
LAND USE AND TRAVEL CORRIDORSSTRATEGIES LU.3.aLU.3.bLU.3.cLU.3.dLU.3.eLU.3.fUtilize appropriate transportation investments to implement the goals and policies <strong>of</strong> the state’s land use and transportation planswhich seek to concentrate growth within or adjoining existing built-up areas, avoid urban sprawl, reduce air and water pollution, andencourage greater use <strong>of</strong> transit and other alternative modes <strong>of</strong> transportation. Work with state agencies, cities and towns, privateinterests, and citizens to:• Target transportation system investments, and provide other incentives to encourage the concentration <strong>of</strong> growth within “growthcenters” such as transit-oriented developments which have, or are planned to have, services and infrastructure necessary to supportintensive development, and are planned for well-designed, higher density, mixed use, transit and pedestrian-friendly land uses;• Make it a priority to evaluate the effects <strong>of</strong> the existing property tax system on growth patterns and support revisions that willencourage growth and development within existing urban centers;• Provide leadership, incentives, and the information and technical training needed by communities to update the land use andtransportation elements <strong>of</strong> their comprehensive plans and their land development, subdivision, and zoning regulations to attain moreconcentrated development patterns, where appropriate; and• Educate the public concerning the (transportation, environmental, energy-efficiency, service-cost savings, and other) benefits <strong>of</strong> moreconcentrated development, as compared to diffuse, low density “sprawl” patterns.Achieve more concentrated development patterns including infill and mixed use development, and higher residential and employmentdensities near transit stops. It is desirable to have schools, libraries, parks, and other public services within walking distance <strong>of</strong>residential areas and town centers.Work with affected communities to plan for and mitigate growth impacts accompanying expansion <strong>of</strong> commuter rail service to SouthCounty and Fall River. Investigate Transit Oriented Development and other land management strategies to accommodate growth.Give special attention to assure that housing and social facilities are located in developed areas and designed to be accessible andfriendly to pedestrians and transit. This issue is particularly important in the siting <strong>of</strong> housing for low income, elderly and/or disabledhouseholds.Use <strong>State</strong> economic development programs and incentives to encourage major employers, particularly those which employ urbanpopulations, to locate in transit-accessible, urban areas. Major developments should encourage the use <strong>of</strong> alternative transportationmodes.Encourage communities to adopt subdivision and land development regulations that provide flexibility in local street design to facilitatecompact development patterns and minimize the land area devoted to roadways and parking. Advance municipal understanding <strong>of</strong>and reliance upon technical guidance available from the American <strong>Planning</strong> Association, Center for Watershed Protection, and othernational sources aimed at the integration <strong>of</strong> modern model standards requiring compact development into local development codes.<strong>Transportation</strong> <strong>2035</strong> (2012 Update)<strong>State</strong> Guide Plan Element 611RI <strong>State</strong>wide <strong>Planning</strong> ProgramPage 5-32December 2012BICYCLEDESIGNECONOMICDEVELOPMENTEMERGENCYRESPONSEENVIRONMENTEQUITYFINANCEHIGHWAYINTERMODALLAND USE ANDCORRIDORSPEDESTRIANPLANNINGSAFETYTRANSIT
LAND USE AND TRAVEL CORRIDORSSTRATEGIES(continued)LU.3.hLU.3.iLU.3.jLU.3.kLU.3.lLU.3.mLU.3.nLU.3.oLU.3.pLU.3.qSupport the preservation <strong>of</strong> open space and rural character, and the creation <strong>of</strong> greenways called for in the state’s Greenspace andGreenways Plan, and in local comprehensive plans. Encourage pursuit <strong>of</strong> open space priorities <strong>of</strong> regional and watershed greenspaceplans via incorporation <strong>of</strong> appropriate strategies in municipal comprehensive plans and other local actions. Preserve agricultural landthrough various zoning techniques and property acquisition. Continue the partnership among federal, state, local and private agenciesand groups to provide funding for open space preservation and greenway creation as mitigation for transportation project impacts.Work with cities and towns on their comprehensive plans and their land development, subdivision, and zoning regulations to supportthe preservation <strong>of</strong> open space and rural character, and promote the creation <strong>of</strong> greenways.Maintain vegetated buffers along Interstate Corridors, especially in rural areas.Organize transportation planning in <strong>Rhode</strong> <strong>Island</strong> around a travel corridor planning approach. Work with regional planningcommissions, municipalities, and the URITC to ensure that local comprehensive plans incorporate, and become consistent with,recommendations <strong>of</strong> the corridor plan(s). Corridor planning will enable transportation planning to go beyond the municipal boundaries.Continue the scenic roadways program. Work with communities to adopt land management requirements that preserve the characterand scenic resources within the corridors <strong>of</strong> designated scenic roads.Recognizing that transportation and land uses are intrinsically intertwined so that one cannot be planned for properly without the other,undertake as part <strong>of</strong> transportation corridor planning coordinated, cooperative, and proactive land use/land management planningeffort by the <strong>State</strong> and city and towns located in transportation corridors.Encourage communities to exert more control over development along arterials; for example, by combining access points wherepossible and eliminating duplicate curb cuts. Encourage circulation between adjacent commercial areas, especially largedevelopments, that allow direct access between properties. Provide for model zoning to allow more home-based occupations.Other Access Management techniques include signal and driveway spacing, frontage roads, and access from rear or side streets.Require developers to pay for highway improvements where increased traffic from new development degrades traffic flow orintersection level <strong>of</strong> service. Consider adopting legislation similar to Massachusetts.Preserve state-owned land located within and adjacent to roadway ROW’s for use as vegetated buffers (with multiple benefits), futureroadway improvements, and to preserve the functionality <strong>of</strong> the corridor.Acquire and preserve active and abandoned rail rights-<strong>of</strong>-way for future transportation use. These include the East Junction, WarwickIndustrial (Cranston), and the Providence and Worcester main line if passenger rail is feasible in the Blackstone Valley. They canhave multiple uses over the long term.<strong>Transportation</strong> <strong>2035</strong> (2012 Update)<strong>State</strong> Guide Plan Element 611RI <strong>State</strong>wide <strong>Planning</strong> ProgramPage 5-33December 2012BICYCLEDESIGNECONOMICDEVELOPMENTEMERGENCYRESPONSEENVIRONMENTEQUITYFINANCEHIGHWAYINTERMODALLAND USE ANDCORRIDORSPEDESTRIANPLANNINGSAFETYTRANSIT
LAND USE AND TRAVEL CORRIDORSSTRATEGIES(continued)LU.3.rLU.3.sLU.3.tReserve vacant industrial land along freight rail lines for rail dependent uses. Reserve sufficient land for future terminals andintermodal facilities. Reserve waterfront land at the state’s ports to meet future shipping and passenger transportation needs.Reserve airport land for aviation related development and/or expansion as identified in the <strong>State</strong> Airport System Plan. Avoidincompatible development around the airport that will constrain or hinder aviation. Communities located within close proximity to astate airport must adopt Airport Overlay Zoning provisions to ensure future compatibility.Preserve historically-significant transportation structures such as rail stations.PERFORMANCEMEASURESLU.4.aLU.4.bUrbanized area (as defined by US Census) to increase no more than the rate <strong>of</strong> population growth.Complete one corridor study per year.<strong>Transportation</strong> <strong>2035</strong> (2012 Update)<strong>State</strong> Guide Plan Element 611RI <strong>State</strong>wide <strong>Planning</strong> ProgramPage 5-34December 2012BICYCLEDESIGNECONOMICDEVELOPMENTEMERGENCYRESPONSEENVIRONMENTEQUITYFINANCEHIGHWAYINTERMODALLAND USE ANDCORRIDORSPEDESTRIANPLANNINGSAFETYTRANSIT
PEDESTRIANGOAL PEOBJECTIVES PE.1.aPE.1.bPOLICIES PE.2.aPE.2.bPE.2.cCreate and maintain safe and attractive walkable communities to encourage more walking trips, enhance transit usage, improve publichealth, and reduce auto congestion and dependency.Improve walking environment.Increase walking mode share.Elevate pedestrian transportation to a priority level. Every trip involves walking, making it the most pervasive form <strong>of</strong> transportation.According equal status to pedestrian transportation will require a fundamental change in the way state and local agencies do business.This will not be a quick change, but rather, an evolutionary process.Ensure that all pedestrian facilities accommodate the needs <strong>of</strong> the physically challenged.Recognize pedestrian planning considerations as a priority to be fully integrated in all transportation and land use planning processes.<strong>Transportation</strong> <strong>2035</strong> (2012 Update)<strong>State</strong> Guide Plan Element 611RI <strong>State</strong>wide <strong>Planning</strong> ProgramPage 5-35December 2012BICYCLEDESIGNECONOMICDEVELOPMENTEMERGENCYRESPONSEENVIRONMENTEQUITYFINANCEHIGHWAYINTERMODALLAND USE ANDCORRIDORSPEDESTRIANPLANNINGSAFETYTRANSIT
PEDESTRIANSTRATEGIES PE.3.aPE.3.bPE.3.cPE.3.dPE.3.ePE.3.fPE.3.gPE.3.hDedicate at least $1 million in TIP resources annually to sidewalk construction and rehabilitation, and develop a prioritization systemfor sidewalk projects to improve walkability. Effectively utilize Safe Routes To School funding for projects in communities that improvesafety and increase the number <strong>of</strong> children walking.Encourage municipalities to address pedestrian needs through their comprehensive plans with an inventory <strong>of</strong> their walkinginfrastructure and prioritized list <strong>of</strong> new projects. Encourage communities to provide local matching funds for sidewalk projects.Use the travel corridor process, and other channels to provide input on local and regional planning issues and initiatives to improvewalking facilities. Offer technical assistance to cities and towns and other groups on detailed planning and design standards toeffectively integrate pedestrian considerations into the development process.Ensure that transportation facility design, construction, operational and maintenance procedures respond to pedestrian travel needsand promote community walkability wherever possible, by the following steps:•Examine existing pedestrian facilities to determine that they meet current minimum standards.•Assess signal pedestrian cycles in light <strong>of</strong> the aging population to provide adequate timing for safe crossing.•Employ traffic calming strategies where warranted to enhance pedestrian safety.•Increase the width <strong>of</strong> existing sidewalks or relocate obstructions where obstructions reduce walking space, and reduce streetpavement width where possible to reduce crossing length (neck-down).Encourage communities to promote walkability through their zoning and land development ordinances by zoning for a pedestrian scale<strong>of</strong> development, by including requirements and/or incentives for linking new development to adjoining developments via sidewalks orpathways and transit stops (as applicable), and limiting/reducing the number <strong>of</strong> driveways along a roadway to improve pedestriansafety.Provide sidewalks within school areas and address pedestrian safety concerns. Encourage city and town planning and public worksdepartments to initiate school trip safety committees as part <strong>of</strong>, or independently <strong>of</strong> the Safe Routes To School Program. UtilizeDepartment <strong>of</strong> Education guidelines in selecting sites for new schools and in choosing to retain schools that are within walkingdistance to the school population.Continue to improve pedestrian crash data reporting including modifications to make the reporting form more suitable to computerizedinformation systems. Develop a system for ongoing data reporting and distribution.Encourage private sector developments (particularly where public funding participation is sought) to provide safe, accessible andconvenient walking facilities to better accommodate pedestrians in highway-oriented commercial development.<strong>Transportation</strong> <strong>2035</strong> (2012 Update)<strong>State</strong> Guide Plan Element 611RI <strong>State</strong>wide <strong>Planning</strong> ProgramPage 5-36December 2012BICYCLEDESIGNECONOMICDEVELOPMENTEMERGENCYRESPONSEENVIRONMENTEQUITYFINANCEHIGHWAYINTERMODALLAND USE ANDCORRIDORSPEDESTRIANPLANNINGSAFETYTRANSIT
PEDESTRIANSTRATEGIES(continued)PERFORMANCEMEASURESPE.3.iPE.3.jPE.3.kPE.3.lPE.3.mPE.3.nPE.3.oPE.3.pPE.4.aPE.4.bPE.4.cCooperate with public health and education agencies to develop and disseminate information encouraging the public to walk more fortransportation and recreation. Information to be provided should include: maps and signs showing the best walking routes to majordestinations; traffic safety education, including pedestrian and bicycle safety principles and practices, for school-aged children, andinformation directed at parents on specific traffic risks children are subject to and steps to increase their safety.Integrate bicycling and walking options into new development and redevelopment.Give greater priority to traffic-calming and pedestrian features (such as street furniture) in community planning and development.Ensure that state highway projects enhance opportunities for walking and bicycling wherever possible.Target pedestrian and bicycling improvements in neighborhoods with significant low income and minority populations.Include sidewalks in both directions and appropriate street crossing facilities for bus stop shelters.Convert the west end <strong>of</strong> the old Jamestown Bridge to pedestrian and fishing use, or provide equivalent facilities elsewhere.Modify existing sidewalks to achieve ADA compliance, especially along transit corridors.Construct 2 miles <strong>of</strong> sidewalk per year; rehabilitate 20 miles <strong>of</strong> sidewalk per year; install 500 wheelchair ramps per year (through the<strong>Transportation</strong> Improvement Program).Mode split (as defined by US Census Journey to Work)Increase “Walk or Work at Home” from 6.1% in 2000 to 6.4% in 2010, 6.6% in 2020, and 6.9% in 2030.Increase number <strong>of</strong> children walking to school in SRTS funded communities. Set target when baseline data becomes available.<strong>Transportation</strong> <strong>2035</strong> (2012 Update)<strong>State</strong> Guide Plan Element 611RI <strong>State</strong>wide <strong>Planning</strong> ProgramPage 5-37December 2012BICYCLEDESIGNECONOMICDEVELOPMENTEMERGENCYRESPONSEENVIRONMENTEQUITYFINANCEHIGHWAYINTERMODALLAND USE ANDCORRIDORSPEDESTRIANPLANNINGSAFETYTRANSIT
PLANNINGGOAL PLOBJECTIVES PL.1.aPL.1.bPOLICIES PL.2.aPL.2.bPL.2.cPL.2.dPL.2.ePL.2.fPL.2.gPL.2.hConduct a comprehensive, cooperative and continuing planning process that responds to public interests and concerns, strives tomeet the needs <strong>of</strong> underserved communities, and fosters productive relationships with elected and appointed <strong>of</strong>ficials from all levels <strong>of</strong>government and the private sector.Maintain federally certified transportation planning process.Ensure that community comprehensive plans are consistent with the <strong>Transportation</strong> Plan and other <strong>State</strong> Guide Plan elements.Participate as necessary at the federal level in policy development and authorization legislation, and maintain good relationships withfederal agency staff and Congressional delegation.Continue integrating a regional perspective into the planning process for all aspects <strong>of</strong> the state's development across both functionaland jurisdictional lines. Obtain a high level <strong>of</strong> <strong>of</strong>ficial commitment to, and a high degree <strong>of</strong> public participation in, this process.Maintain contact with counterparts at various regional levels (North Atlantic, Northeast, New England, I-95 Corridor), especiallythrough pr<strong>of</strong>essional associations. Support efforts to establish a regional transportation authority.Support state planning efforts and maintain good working relationships with sister state agencies, quasi-public entities, highereducation, and the General Assembly.Improve and expand corridor level planning to ensure connections to land use planning and congestion management as well ascoordination among local jurisdictions, regional planning agencies, neighboring MPO’s and transit authorities.Continue to work with cities, towns, and the Narragansett Indian Tribe, on their comprehensive plans; land development, subdivision,and zoning regulations; and design standards and guidelines to ensure consistency with and implementation <strong>of</strong> state policies andplans.Support inclusive transportation planning and resource allocation processes that are accessible to, understood by, and constructivelyengage all population groups and interests in defining and addressing transportation needs.Actively engage the private sector, interest groups, non-pr<strong>of</strong>its, and transportation providers in the planning process.Periodically monitor plans and transportation system performance to assess progress made and identify deficiencies.<strong>Transportation</strong> <strong>2035</strong> (2012 Update)<strong>State</strong> Guide Plan Element 611RI <strong>State</strong>wide <strong>Planning</strong> ProgramPage 5-38December 2012BICYCLEDESIGNECONOMICDEVELOPMENTEMERGENCYRESPONSEENVIRONMENTEQUITYFINANCEHIGHWAYINTERMODALLAND USE ANDCORRIDORSPEDESTRIANPLANNINGSAFETYTRANSIT
PLANNINGSTRATEGIES PL.3.aPL.3.bPL.3.cPL.3.dPL.3.ePL.3.fPL.3.gPL.3.hPL.3.iPL.3.jPL.3.kWork through <strong>Rhode</strong> <strong>Island</strong>’s congressional delegation and pr<strong>of</strong>essional associations (APA, NARC, AMPO, AASHTO) to participate innational policy deliberations regarding transportation.Continue addressing regional transportation issues, including high-speed rail, bus/rail/air connections, intercity bus, interstatetransit/paratransit connections, and commuter rail service to Boston as well as to Connecticut locations. Support a “North-South RailLink” in Boston to improve regional passenger rail connections. Work directly with other states to coordinate regional changes infreight/passenger rail service. Support bridge clearance projects in other states that open up new markets for freight rail.Integrate <strong>Rhode</strong> <strong>Island</strong>’s transportation planning into the interstate regional transportation systems <strong>of</strong> New England and thenortheastern United <strong>State</strong>s, especially through the I-95 Corridor Coalition and other regional associations.Provide adequate staffing and training in the transportation section <strong>of</strong> the <strong>State</strong>wide <strong>Planning</strong> Program to conduct the federallymandated planning process.Maintain planning tools, such as RI Geographic Information Systems, and the travel demand model with latest s<strong>of</strong>tware applicationsand data. Share data among RIPTA, RIDOT, the <strong>State</strong>wide <strong>Planning</strong> Program, and others.Continue staff support to the <strong>State</strong> <strong>Planning</strong> Council, the Technical Committee, the <strong>Transportation</strong> Advisory Committee, and theGrowth <strong>Planning</strong> Council. Participate on other committees (such as ITS, Accessible <strong>Transportation</strong>, T2, etc.) as necessary and asresources allow.Compress the time between planning and implementation <strong>of</strong> transportation projects, so they are completed when needed and performproactive, not just reactive, functions. Institute procedures to streamline the review process as projects go forward to design andconstruction.Coordinate transportation planning with other Metropolitan <strong>Planning</strong> Organizations (MPO’s) and regional planning entities such as theAquidneck <strong>Island</strong> <strong>Planning</strong> Commission, Blackstone Valley Corridor Commission, and Washington County <strong>Planning</strong> Commission.Enhance corridor planning efforts with scenario development and alternatives analysis using RI Geographic Information System(RIGIS) and the state travel model.Work with municipalities to insure that local comprehensive plans incorporate, and become consistent with, the recommendations <strong>of</strong>the Corridor plan(s) for which they are a component. Corridor planning will enable transportation planning to go beyond the municipalboundaries.Provide assistance to regional planning agencies, communities, and non-pr<strong>of</strong>its in the form <strong>of</strong> pass-through funding to enable theirparticipation in cooperative planning efforts and corridor planning studies.<strong>Transportation</strong> <strong>2035</strong> (2012 Update)<strong>State</strong> Guide Plan Element 611RI <strong>State</strong>wide <strong>Planning</strong> ProgramPage 5-39December 2012BICYCLEDESIGNECONOMICDEVELOPMENTEMERGENCYRESPONSEENVIRONMENTEQUITYFINANCEHIGHWAYINTERMODALLAND USE ANDCORRIDORSPEDESTRIANPLANNINGSAFETYTRANSIT
PLANNINGSTRATEGIES(continued)PL.3.lPL.3.mPL.3.nPL.3.oPL.3.pPL.3.qPL.3.rPL.3.sPL.3.tPL.3.uPL.3.vMaintain current standards and guidance for comprehensive plans to ensure that all pertinent elements and modes <strong>of</strong> thetransportation system are addressed and that municipalities are planning a balanced transportation system.Support the University <strong>of</strong> <strong>Rhode</strong> <strong>Island</strong> <strong>Transportation</strong> Center (URITC) and the Technology Transfer Center efforts in disseminatinginformation to local public works departments.Continue to evaluate and improve the transportation planning processes’ outreach measures to attain greater inclusiveness andaccessibility for all population groups and interests.Educate local planning boards and the public concerning the benefits <strong>of</strong> more concentrated development, as compared to diffuse, lowdensity “sprawl” patterns (transportation, environmental, energy-efficiency, service-cost savings, and other).Begin discussions and implement a pilot project to integrate education-based transportation programs with public systems to providefor more efficient and effective use <strong>of</strong> existing resources.Institute outreach guidelines and processes to involve all <strong>Rhode</strong> <strong>Island</strong>ers (urban, suburban, rural) in the transportation planningprocess, giving particular emphasis to measures needed to engage lower-income residents, recent immigrants, and minority groups.Provide updated guidance to cities and towns on circulation elements <strong>of</strong> local comprehensive plans.Work with cities and towns to ensure that local transportation planning and project development reflect community needs.Provide staff training in air quality, finance, modeling, context sensitive design, scenario planning, and other current planning topics.Assess progress on performance measures and strategies as part <strong>of</strong> quadrennial updates <strong>of</strong> the <strong>Transportation</strong> Plan.Obtain best available digital elevation data on sea-level rise and assess impact to state and local transportation infrastructure.PERFORMANCEMEASURESPL.3.wPL.4.aPromote public education about about environmental and economic benefits <strong>of</strong> transit as well as “travel training” that teaches peoplehow to use the bus system.Pass certification review by federal funding agencies in 2009. (Extent <strong>of</strong> SAFETEA-LU).PL.4.b All cities and towns have state approved comprehensive plans by 2009.<strong>Transportation</strong> <strong>2035</strong> (2012 Update)<strong>State</strong> Guide Plan Element 611RI <strong>State</strong>wide <strong>Planning</strong> ProgramPage 5-40December 2012BICYCLEDESIGNECONOMICDEVELOPMENTEMERGENCYRESPONSEENVIRONMENTEQUITYFINANCEHIGHWAYINTERMODALLAND USE ANDCORRIDORSPEDESTRIANPLANNINGSAFETYTRANSIT
SAFETYGOAL SImprove the safety <strong>of</strong> all transportation modes through education, enforcement, and engineering solutions.OBJECTIVES S.1.aS.1.bS.1.cS.1.dPOLICIES S.2.aS.2.bS.2.cS.2.dS.2.eReduce fatalities and serious injuriesReduce crashesReduce bicycle and pedestrian injuriesIncrease seatbelt and motorcycle helmet useSupport educational efforts directed toward all population groups regarding safe use <strong>of</strong> all modes <strong>of</strong> transportation.Strengthen safety laws and programs and improve enforcement, including more stringent driver training, licensing, and re-licensing;seat belt and motorcycle helmet requirements; and drunk driving penalties.Improve the operating characteristics <strong>of</strong> the transportation system through safety improvements to the right <strong>of</strong> way includingpavement, signage, signalization, lighting, sight distances, sidewalks, traffic calming, access management, etc.Improve crash reporting system and data analysis.Integrate safety considerations into all transportation planning documents.<strong>Transportation</strong> <strong>2035</strong> (2012 Update)<strong>State</strong> Guide Plan Element 611RI <strong>State</strong>wide <strong>Planning</strong> ProgramPage 5-41December 2012BICYCLEDESIGNECONOMICDEVELOPMENTEMERGENCYRESPONSEENVIRONMENTEQUITYFINANCEHIGHWAYINTERMODALLAND USE ANDCORRIDORSPEDESTRIANPLANNINGSAFETYTRANSIT
SAFETYSTRATEGIES(continued)S.3.aS.3.bS.3.cS.3.dS.3.eS.3.fS.3.gS.3.hS.3.iS.3.jS.3.kS.3.lS.3.mS.3.nImprove the safety <strong>of</strong> all drivers and passengers through driver education, alcohol awareness, and other safety education programs.Increase the safety <strong>of</strong> children in motor vehicles through education programs, and public awareness programs including alcoholawareness, the Department <strong>of</strong> Health’s child safety seat checkups, and distribution <strong>of</strong> child safety seats.Expand pedestrian, pedacycle and motorcycle safety educational efforts for all transportation system users.Continue to implement Safe Routes to Schools programs through infrastructure and non-infrastructure (education, encouragement,and enforcement) projects.Improve the safety <strong>of</strong> motorists, pedalcyclists, and pedestrians when operating/walking within the vicinity <strong>of</strong> trucks and buses through“share the road” education including commercial motor vehicle limitations and safe driving practices.Institute higher standards for driver licensing and license renewals, including graduated license for younger drivers. Consider reversegraduated licenses for older drivers.Strengthen safety laws and programs including stricter enforcement and penalties for unsafe vehicles, drunk driving, speeding andaggressive driving.Support the passage <strong>of</strong> a <strong>Rhode</strong> <strong>Island</strong> primary seatbelt law and increase seatbelt usage through public education and awarenessprograms such as “Click It or Ticket.”Support the passage <strong>of</strong> a <strong>Rhode</strong> <strong>Island</strong> motorcycle helmet law and increase helmet usage through public education programs.Provide continuing in-service training to law enforcement personnel on changes in traffic laws, including laws pertaining to pedestrianand pedalcycle safety.Encourage communities to adopt and enforce snow removal ordinances to improve conditions <strong>of</strong> pedestrian and non-motorized travel.Improve transit rider safety both on and <strong>of</strong>f <strong>of</strong> buses in order to maintain an atmosphere that ensures customer safety during allphases <strong>of</strong> transit operations. RIPTA should enforce control policies including removal <strong>of</strong> unruly passengers when appropriate.Improve highway lighting on high-volume roads and interchanges by using “full cut-<strong>of</strong>f” fixtures and reduced glare lights. Designhighway lighting systems and facilities to consider the needs <strong>of</strong> <strong>Rhode</strong> <strong>Island</strong>'s aging population, and minimize environmental andaesthetic impacts on surrounding areas. Improve the safety <strong>of</strong> transit users, pedestrians and pedalcyclists in urban areas by providingand maintaining appropriate lighting.Improve crossing safety at, or eliminate, rail-highway grade crossings.<strong>Transportation</strong> <strong>2035</strong> (2012 Update)<strong>State</strong> Guide Plan Element 611RI <strong>State</strong>wide <strong>Planning</strong> ProgramPage 5-42December 2012BICYCLEDESIGNECONOMICDEVELOPMENTEMERGENCYRESPONSEENVIRONMENTEQUITYFINANCEHIGHWAYINTERMODALLAND USE ANDCORRIDORSPEDESTRIANPLANNINGSAFETYTRANSIT
SAFETYSTRATEGIES(continued)S.3.oS.3.pS.3.qS.3.rS.3.sS.3.tS.3.uS.3.vS.3.wS.3.xS.3.yImprove the safety <strong>of</strong> highway travel through the use <strong>of</strong> improved lane markings and highway edge marking including wider markings,retroreflective permanent raised pavement lane and edge markings, edge grooving, and retroreflective signage.Improve the safety <strong>of</strong> roadsides through the use <strong>of</strong> clear zones, relocation <strong>of</strong> sign supports and traffic control devices, and use <strong>of</strong>breakaway sign, utility and light supports consistent with the character <strong>of</strong> the roadway.Provide and maintain crosswalks, sidewalks, crossing signals, well defined pedalcycle lanes, and separate <strong>of</strong>f-road trails to improvepedestrian and pedalcycle safety.Continue to improve emergency response time to, the clearing <strong>of</strong>, and driver notification <strong>of</strong>, highway accidents in order to minimizetraffic delays and secondary crashes.Develop information on the problems senior adults face as pedestrians and drivers, and formulate strategies to improve their personalsafety and mobility. Utilize design treatments (signage and lighting in particular) that make driving safer and more comfortable.Follow best management practices to reduce red light running and improve safety at signal controlled intersections including LEDlenses, black backplates, appropriate number and placement <strong>of</strong> signal heads, adequate warning for traffic lights, improved signaltiming, coordinated signal systems, and removing unnecessary traffic signals.Improve driver information through the use <strong>of</strong> standard signs and lettering, retroreflective signs, and a replacement program for worn,damaged or missing signs. Signs should comply with Manual for Uniform Traffic Control Devices (MUTCD).Improve worker safety and driver information and safety through the proper use <strong>of</strong> MUTCD standards in the setting up and operating<strong>of</strong> work zones and efficient use <strong>of</strong> law enforcement personnel.Continue to expand and improve the crash reporting system by:•Using crash and traffic data to identify high-hazard intersections and corridors with the highest occurrences and rate <strong>of</strong> vehicular andpedestrian or pedalcycle crashes.•Investigating the expansion <strong>of</strong> the “Other” category in reporting the cause <strong>of</strong> collisions with non-motor vehicles.•Investigating the inclusion <strong>of</strong> collisions with pedestrians and pedalcycles in the reporting <strong>of</strong> collisions with non-motor vehicles.Employ in appropriate settings traffic calming techniques such as narrowed lanes, speed tables, raised crosswalks, trafficroundabouts, and chicanes to reduce speed and enhance safety.Improve highway operations and safety through the use <strong>of</strong> Road Safety Audits (RSA) conducted by independent, multi-disciplinaryteams.<strong>Transportation</strong> <strong>2035</strong> (2012 Update)<strong>State</strong> Guide Plan Element 611RI <strong>State</strong>wide <strong>Planning</strong> ProgramPage 5-43December 2012BICYCLEDESIGNECONOMICDEVELOPMENTEMERGENCYRESPONSEENVIRONMENTEQUITYFINANCEHIGHWAYINTERMODALLAND USE ANDCORRIDORSPEDESTRIANPLANNINGSAFETYTRANSIT
SAFETYPERFORMANCEMEASURESS.4.a Reduce crash rate per 100 million Vehicle Miles Traveled (VMT) from 588 in 2001 to 470 in 2015, 400 in 2025 and 375 in 2030.[Note: Data collected by RI Department <strong>of</strong> <strong>Transportation</strong> (RIDOT).]S.4.b Reduce crash rate per 10,000 licensed drivers aged 75 and over from 60 in 2001 to 54 in 2015, 49 in 2025, and 47 in 2030.[Note: Data collected by RIDOT.]S.4.c Reduce number <strong>of</strong> fatalities (based on a 3 year average) from 81 in 2001 to 72 in 2015, 66 in 2025, and 63 in 2030.[Note: Data collected by RIDOT. Target is consistent with RI Department <strong>of</strong> Health (RIDOH) goal for 2010 and extrapolated to 2015.]S.4.d Reduce fatality rate per 100 million Vehicle Miles Traveled (VMT) from 0.90 in 2001 to 0.79 in 2015, 0.65 in 2025, and 0.60 in 2030.[Note: Data collected by RIDOT. National rate for 2002 is 1.50.]S.4.e Reduce number <strong>of</strong> alcohol related fatalities from 48 in 2001 to 35 in 2015, 26 in 2025, and 21 in 2030.[Note: Data collected by National Highway Traffic Safety Administration (NHTSA).]S.4.f Reduce alcohol related fatality rate per 100 million VMT from 0.60 in 2001 to 0.48 in 2015, 0.40 in 2025, and 0.38 in 2030.[Note: Data collected by NHTSA. National rate for 2002 is 0.61]S.f.g Reduce number <strong>of</strong> crashes involving commercial vehicles from 328 in 2003 to 297 in 2015, 266 in 2025, and 250 in 2030.[Note: Data collected by Federal Motor Carrier Safety Administration (FMCSA).]S.4.h Reduce the number <strong>of</strong> serious pedestrian injuries from 94 in 2001 to 88 in 2015, 83 in 2025, and 80 in 2030.[Note: “Serious” is defined as admitted to hospital. Data collected by RIDOH.]S.4.i Reduce the number <strong>of</strong> serious bicycle injuries from 80 in 2001 to 75 in 2015, 71 in 2025 and 69 in 2030.[Note: “Serious” is defined as admitted to hospital. Data collected by RIDOH.]S.4.j Increase seatbelt use from 74% in 2003 to 85% in 2015, 92% in 2025, and 94% in 2030.[Note: Data collected by RIDOT. Based on passage <strong>of</strong> RI Primary Seatbelt Law.]S.4.kIncrease motorcycle helmet use to 98% in 2015 and beyond. Current data not available.[Note: Based on passage <strong>of</strong> RI Motorcycle Helmet Law.]<strong>Transportation</strong> <strong>2035</strong> (2012 Update)<strong>State</strong> Guide Plan Element 611RI <strong>State</strong>wide <strong>Planning</strong> ProgramPage 5-44December 2012BICYCLEDESIGNECONOMICDEVELOPMENTEMERGENCYRESPONSEENVIRONMENTEQUITYFINANCEHIGHWAYINTERMODALLAND USE ANDCORRIDORSPEDESTRIANPLANNINGSAFETYTRANSIT
TRANSITGOAL TOBJECTIVES T.1.aT.1.bT.1.cPOLICIES T.2.aT.2.bT.2.cT.2.dT.2.eT.2.fProvide a safe, robust, and convenient network <strong>of</strong> transit and shared ride services with seamless intermodal connections in support <strong>of</strong>increased employment opportunities, improved environmental quality, and reduced congestion and auto dependency.Increase transit ridership.Increase carpooling and vanpooling.Maintain transit vehicles, equipment, and facilities.Improve the present overall level <strong>of</strong> RIPTA Service. RIPTA is a public investment that is crucial to the economy, contributes to thefabric and strength <strong>of</strong> urban areas, provides a means <strong>of</strong> transportation for people who can not or choose not to drive (whethercommuters, shoppers, low-income, elderly, students, disabled, or others), improves the environment, and conserves energy.Continue existing commuter rail service to Providence through the Pilgrim Partnership. Extend Boston-Providence commuter railservice south in incremental steps to T.F. Green <strong>State</strong> Airport and Wickford Junction under a Phase I start-up service. Additional sitesin Cranston, East Greenwich, Kingston, Pawtucket/Central Falls, Westerly, and West Davisville should be considered and evaluatedbased on demand, operations, infrastructure requirements, site availability, economic development opportunities, community support,and cost. Long term passenger rail opportunities may include Blackstone Valley and Aquidneck <strong>Island</strong>. Support extension <strong>of</strong> MBTAcommuter service to Fall River. Use the FRIP track for passenger rail service.Study growth impacts <strong>of</strong> new rail service and work with affected cities and towns to implement growth management measures inconcert with extension <strong>of</strong> rail service. This includes areas <strong>of</strong> RI along the northeast corridor as well communities impacted by railservice outside the state (such as New London, CT; Fall River, MA; and Franklin, MA)Maintain water transportation between Providence, Newport, and other Bay communities, and consider expansion to other activitycenters as appropriate.Adjust transit operations to the changing needs <strong>of</strong> a dynamic population -- the increasing proportion <strong>of</strong> elderly people, the largenumber <strong>of</strong> people with limited capability in English, the requirements that welfare recipients find work, the increasing number <strong>of</strong>disabled people seeking to travel, the number <strong>of</strong> students on evening schedules and the prospects for a twelve-month school year,and the dispersed location <strong>of</strong> many critical facilities and services. Consider routes, time <strong>of</strong> service, and other operationalcharacteristics in selecting equipment. This is particularly important for low-income individuals, transitional housing or shelterresidents, and the homeless.Market transit services conscientiously and efficiently to all segments <strong>of</strong> the public as a convenient and reliable alternative to theautomobile. Make the transit system and intermodal connections user-friendly for all members <strong>of</strong> the riding public.<strong>Transportation</strong> <strong>2035</strong> (2012 Update)<strong>State</strong> Guide Plan Element 611RI <strong>State</strong>wide <strong>Planning</strong> ProgramPage 5-45December 2012BICYCLEDESIGNECONOMICDEVELOPMENTEMERGENCYRESPONSEENVIRONMENTEQUITYFINANCEHIGHWAYINTERMODALLAND USE ANDCORRIDORSPEDESTRIANPLANNINGSAFETYTRANSIT
TRANSITPOLICIES(continued)T.2.gT.2.hDevelop state policy on using the least-cost, most efficient mode <strong>of</strong> travel for state-funded programs (e.g., transit over paratransit withrates structured to give priority to transit usage, and service to the nearest service outlet). Provide that all agencies purchasingparatransit services contract with RIde and that social service agencies be located along transit routes.Coordinate all state and municipal-funded transportation services, and consolidate operations where feasible. This includes fixedroute,paratransit, school districts, Head Start, temporary employment agencies, and human service agencies outside <strong>of</strong> the Rldesystem. There should be no fare-free service unless supported by a third-party payee. RIPTA should be the custodian <strong>of</strong> theCoordinated Plan for Public Transit - Human Services (a plan required by SAFETEA-LU).STRATEGIES T.3.aT.3.bT.3.cT.3.dT.3.eT.3.fGive RIPTA the responsibility <strong>of</strong> “mobility manager” in <strong>Rhode</strong> <strong>Island</strong>. Include transit, paratransit, park-and-ride lots, vanpools,carpools, and other shared-ride alternatives as options to the single-occupant automobile. RIPTA could be the “one-stop shop” forinformation on intercity bus and rail, commuter rail, water transportation, and supporting bicycle and pedestrian modes for tourism andrecreational travel. Pursue means to tie the various modes more closely, including shared ticketing and trip chaining opportunities.Develop a program for improving coordination <strong>of</strong> transportation alternatives to single occupancy vehicles. As the designated mobilitymanager for the state, RIPTA will be responsible for providing direction to this program.Maintain an up-to-date bus system map and schedules showing transfer points to connecting lines. Consider publishing an electroniccommuter guide (similar to CommuterRegister.com in Connecticut). Research insurance obstacles to affordable vanpool programs.Focus on comfort, convenience, and reliability when improving transit. Implement service that reduces overall door-to-door travel time.Integrate scheduling, including centralized dispatch for real-time dispatching capability, through a PC-based Global Positioning System(GPS) program. Integrate vehicle location systems for both fixed-route and paratransit, to enable timely intermodal connections.Improve the flow <strong>of</strong> data from transmittal <strong>of</strong> manifests to carriers, to actual data on trips provided and transmitted back to RIde frombilling and statistical purposes. Automated data collection should provide for less manual effort at the driver level. Automate alltransactions, including fare collection, through an automated data collection system and a fare media reader system. Review andinstitute where feasible a cash-less fare collection system. Install automated stop announcements, passenger counters, and vehiclelocation systems on transit vehicles and integrate it with visual readouts. Enhance and expand the use <strong>of</strong> ITS in the Ride Program,and continually improve RIPTA’s website.Provide fixed-route transit utilizing large buses in the urbanized areas <strong>of</strong> the state. For suburban areas, provide a mix <strong>of</strong> servicesincluding fixed routes, point deviation, demand-response, carpooling, vanpooling, etc. Private employers are encouraged to provideshuttle service to fixed route public transit.Improve the present overall level <strong>of</strong> RIPTA transit and demand response service and better integrate with fixed route service.Make public transit safe and convenient for all kinds <strong>of</strong> trips. Cleanliness, maintenance <strong>of</strong> lighting and signage, and graffiti removalare important in attracting and maintaining ridership.<strong>Transportation</strong> <strong>2035</strong> (2012 Update)<strong>State</strong> Guide Plan Element 611RI <strong>State</strong>wide <strong>Planning</strong> ProgramPage 5-46December 2012BICYCLEDESIGNECONOMICDEVELOPMENTEMERGENCYRESPONSEENVIRONMENTEQUITYFINANCEHIGHWAYINTERMODALLAND USE ANDCORRIDORSPEDESTRIANPLANNINGSAFETYTRANSIT
TRANSITSTRATEGIES(continued)T.3.gT.3.hT.3.iT.3.jT.3.kT.3.lT.3.mT.3.nT.3.oT.3.pTarget specific travel markets for RIPTA’s array <strong>of</strong> services.• Continue and expand U Pass Program to colleges and universities.• Provide reverse-commuting options, utilizing various methodologies and models to enable urban low-income workers to accessemployment in the suburbs, including Massachusetts and Connecticut residents who work in <strong>Rhode</strong> <strong>Island</strong>.• Integrate RIPTA and human service agencies efforts with an enhanced and expanded ITS Senior Mobility Program, while ensuringsensitivity to clients’ specialized needs.• Integrate transportation <strong>of</strong> students with public transit to avoid duplication <strong>of</strong> service. Establish contracts between RIPTA and schooldistricts to provide transit services to students, particularly at the high school level (similar to the arrangement in the City <strong>of</strong>Providence).Continue to purchase buses that provide a balance between the need for efficient boardings, low cost <strong>of</strong> operation, and seatingcapacity to meet transit demand.Install new on-board vehicle communications technologies in <strong>Rhode</strong> <strong>Island</strong> for visually impaired passengers.Improve public transportation to and between suburban communities. Circumferential transit routes and routes facilitating reversecommuting are essential to serve employers who are located in the suburbs and inner-city, lower-income people who need jobs.Provide alternative modes <strong>of</strong> transportation for short-distance, high- traffic situations, perhaps including water taxi, light rail, streetcars,tramways, and bus rapid transit. Private operators are encouraged to provide such service. Design alternative transportation optionsfor short-distance, high-volume traffic areas, especially when congestion, cost, and other obstacles constrain movement. Examplesinclude links for major passenger terminals to destinations/attractions (e.g., Newport, downtown Providence, tourist areas).Continually seek to improve the “on-time” performance <strong>of</strong> the transit system. Require drivers to check-in at stops. Revise schedules iftimes between stops are impractical or unattainable as a result <strong>of</strong> traffic or increased use.Work with towns in suburban and rural areas to expand demand response and flex route systems to improve access by poor, elderly,and mobility-impaired residents to jobs, medical facilities, and social services.Expand mid-day, evening, and weekend hours <strong>of</strong> all regular RIPTA routes. Use <strong>of</strong> vans or trolleys may help <strong>of</strong>fset costs <strong>of</strong> operatinglarge buses during <strong>of</strong>f-peak times.Expand RIPTA’s trolley service into additional Providence neighborhoods as funding permits.Coordinate transit hours <strong>of</strong> service with social service agencies, medical facilities, major employers, and supermarkets/shoppingcenters. Consider <strong>of</strong>fering flexible alternatives for residents using transit for activities such as grocery shopping. Similar to flexservice in other communities, provide a van to pick up passengers after they have completed grocery shopping.<strong>Transportation</strong> <strong>2035</strong> (2012 Update)<strong>State</strong> Guide Plan Element 611RI <strong>State</strong>wide <strong>Planning</strong> ProgramPage 5-47December 2012BICYCLEDESIGNECONOMICDEVELOPMENTEMERGENCYRESPONSEENVIRONMENTEQUITYFINANCEHIGHWAYINTERMODALLAND USE ANDCORRIDORSPEDESTRIANPLANNINGSAFETYTRANSIT
TRANSITSTRATEGIES(continued)T.3.qT.3.rT.3.sT.3.tT.3.uT.3.vT.3.wT.3.xT.3.yT.3.zProvide multilingual (Spanish and predominant Southeast Asian languages) printed transit information on buses, and at bus stops andbusinesses along bus routes.Provide cultural sensitivity and customer service training for RIPTA drivers and other customer care personnel. Require drivers toannounce stops and route information. Provide comments cards for RIPTA customer feedback.Assure that transit services consider the special needs <strong>of</strong> disabled and elderly customers and support the goal <strong>of</strong> independent living.Regularly inspect to insure the operability <strong>of</strong> lifts for handicapped accessibility on buses. Enforce restricted seating for elderly andhandicapped riders.Strive to make transit use affordable for low-income residents. Advertise existing programs that benefit economically disadvantagedresidents. Develop more convenient options for Rite Care recipients to access free bus passes. Consider a transportation fund toassist income- eligible individuals with the cost <strong>of</strong> bus passes.Establish a regular review schedule for existing bus routes, using performance measures. Eliminate or modify poorly performingroutes.Review all transportation services available in the state and address duplication <strong>of</strong> efforts, including equipment. Services include:fixed-route transit, RIde paratransit services, other paratransit operations (including municipal), school buses (including specialeducation), Head Start, day care, and recreational programs.Reevaluate all aspects <strong>of</strong> parking. Expand alternative means <strong>of</strong> transportation to colleges and universities. Reduce the availability <strong>of</strong>free and/or low-cost parking available on or near campuses.Keep up with repair and scheduled replacement <strong>of</strong> buses, maintenance vehicles, terminals, and other equipment and facilities. Makeneeded safety improvements, and maintain cleanliness and attractive appearance. Give special attention to maintenance <strong>of</strong>specialized equipment such as wheelchair lifts, bus shelters, and signage for detours and special events.Recognize that transit operators represent assets with capacity to expand. Use their underutilized capabilities; and simplify access forusers by building expanded services on existing operators, rather than creating new organizations.Encourage communities to promote walkability through their zoning and land development ordinances by zoning for a pedestrian scale<strong>of</strong> development, by including requirements and/or incentives for linking new development to adjoining developments via sidewalks orpathways and transit stops (as applicable), and limiting/reducing the number <strong>of</strong> driveways along a roadway to improve pedestriansafety.<strong>Transportation</strong> <strong>2035</strong> (2012 Update)<strong>State</strong> Guide Plan Element 611RI <strong>State</strong>wide <strong>Planning</strong> ProgramPage 5-48December 2012BICYCLEDESIGNECONOMICDEVELOPMENTEMERGENCYRESPONSEENVIRONMENTEQUITYFINANCEHIGHWAYINTERMODALLAND USE ANDCORRIDORSPEDESTRIANPLANNINGSAFETYTRANSIT
TRANSITPERFORMANCEMEASUREST.4.a Increase transit mode share <strong>of</strong> work trips from 2.5% in 2000 to 2.8% in 2010, 3.0% in 2020 and 3.2% in 2030. [US Census]T.4.b Increase carpool mode share <strong>of</strong> work trips from 10.4% in 2000 to 10.6% in 2010, 10.9% in 2020, and 11.1% in 2030. [US Census]T.4.c Increase bus ridership from 25.9 million in 2007 to 27 million in 2010, 29 million in 2020, and 31 million in 2030.T.4.dIncrease RIPTA’s number <strong>of</strong> passengers per hour <strong>of</strong> fixed route service from 39.01 in 2007 to 40.5 in 2010. [Note: This was 34.1 in2003 and may fluctuate with the provision <strong>of</strong> rural service.] Increase number <strong>of</strong> passengers per hour <strong>of</strong> Ride service from 2.2 to 2.8.T.4.e Increase the Mean Distance Between Failure (MDBF) <strong>of</strong> RIPTA’s fleet from 3539 miles in 2003 to 3800 in 2010.T.4.fMaintain 100% ADA compliance for transit system.T.4.g Begin commuter rail service in Warwick by 2012 and Wickford by 2012.<strong>Transportation</strong> <strong>2035</strong> (2012 Update)<strong>State</strong> Guide Plan Element 611RI <strong>State</strong>wide <strong>Planning</strong> ProgramPage 5-49December 2012BICYCLEDESIGNECONOMICDEVELOPMENTEMERGENCYRESPONSEENVIRONMENTEQUITYFINANCEHIGHWAYINTERMODALLAND USE ANDCORRIDORSPEDESTRIANPLANNINGSAFETYTRANSIT
Appendix A to E
December 2012APPENDIX A – CONGESTION MANAGEMENT PROCESSINTRODUCTIONMoving Ahead for Progress in the 21 st Century or MAP 21 requires that the transportation planning processaddress congestion management through a process that provides for effective management and operation, basedon a cooperatively developed and implemented metropolitan-wide strategy, <strong>of</strong> new and existing transportationfacilities eligible for funding under this title and chapter 53 <strong>of</strong> title 49 through the use <strong>of</strong> travel demand reductionand operational management strategies. This Metropolitan <strong>Transportation</strong> Plan (the Plan) includes such strategiesto improve the performance <strong>of</strong> the existing transportation facilities to relieve vehicular congestion and maximizesafety and mobility for people and goods. In addition, the previous legislation, SAFETEA-LU, required the sameprocess to address congestion management. These two provisions <strong>of</strong> federal law establish a clear and continuingdirective to incorporate such strategies into the long-range planning for a region and to ensure ongoing dialogue toensure that these strategies are carried out in a meaningful way.CONGESTED FACILITIES<strong>Rhode</strong> <strong>Island</strong> is the second most densely populated state in the nation and suffers from congestion as do mostmedium and large metropolitan areas. Until recently, planners have been concerned primarily with highwaycongestion; however, in the last couple years, certain public transit routes have become congested as well.Congested facilities are discussed briefly below.CORRIDORS AND ROAD SEGMENTSAlong road segments, congestion is expressed as a volume to capacity ratio (v/c). The v/c ratio is a measure <strong>of</strong> aroad's traffic, on a numerical scale, where a zero ratio equals no traffic and a ratio above 1.0 exceeds capacity. Av/c ratio above 0.8 is considered congested in the <strong>Rhode</strong> <strong>Island</strong> region. The region’s travel demand forecastingmodel is used to evaluate the volume to capacity ratios for all road segments in the network in future years. Theresults <strong>of</strong> the effort are on the two maps below that show the state’s highway system that are currently orexpected to be congested through the year <strong>2035</strong>.• Congested Highways 2012• Congested Highways <strong>2035</strong><strong>Transportation</strong> <strong>2035</strong> (2012 Update)<strong>State</strong> Guide Plan Element 611<strong>Rhode</strong> <strong>Island</strong> <strong>State</strong>wide <strong>Planning</strong> ProgramA-1
December 2012CONGESTED HIGHWAYS 2012<strong>Transportation</strong> <strong>2035</strong> (2012 Update)<strong>State</strong> Guide Plan Element 611<strong>Rhode</strong> <strong>Island</strong> <strong>State</strong>wide <strong>Planning</strong> ProgramA-2
December 2012CONGESTED HIGHWAYS <strong>2035</strong><strong>Transportation</strong> <strong>2035</strong> (2012 Update)<strong>State</strong> Guide Plan Element 611<strong>Rhode</strong> <strong>Island</strong> <strong>State</strong>wide <strong>Planning</strong> ProgramA-3
December 2012PUBLIC TRANSIT BUS ROUTESThe <strong>Rhode</strong> <strong>Island</strong> Public Transit Authority (RIPTA) serves 34 <strong>of</strong> 39 <strong>of</strong> the <strong>State</strong>’s cities and towns. As <strong>of</strong> September2012 RIPTA operates 3,105 daily weekday trips on 54 statewide fixed bus routes 5 days a week. The followingweekday transit routes are considered congested by RIPTA due to passengers being forced to stand andpassengers being left behind to wait for the next bus, mostly during peak hours.RIPTA’s heaviest weekday routes in terms <strong>of</strong> ridership are:• Route 11 Broad Street• Route 60 Providence/Newport• Route 31 Cranston Street• Route 99 North Main Street / Pawtucket• Route 56 Chalkstone AvenueRIPTA operates 1,799 Saturday trips on 46 statewide fixed bus routes that serve 28 <strong>of</strong> the <strong>State</strong>’s cities and towns.On Sundays, RIPTA operates 1,168 trips on 36 statewide fixed bus routes that serve 26 cities and towns.PARK N’ RIDE LOTSParking facilities for commuters,such as park and ride lots along busroutes and parking lots forcommuter rail, serve an importantfunction in travel. <strong>Rhode</strong> <strong>Island</strong> has28 park and ride lots (serving bustransit as well as carpooling andintercity bus service), some <strong>of</strong> whichare monitored periodically forutilization. Conditions areconsidered congested at parkingfacilities where spaces in use exceed85 percent (practical capacity) <strong>of</strong> thetotal number <strong>of</strong> spaces. Four <strong>of</strong> thelots are at or above 85 percentcapacity (Congregational Church inBarrington, Routes 2 & 102 in NorthKingstown, Lincoln Mall, and Routes138 & US 1 in South Kingstown) asindicated in the table to the rightand should be consideredcandidates for expansion. RIDOTIntermodal <strong>Planning</strong> and RIPTA areresponsible for the siting andplanning <strong>of</strong> new commuter park andLocationMunicipalityVehicleCapacityPercentUse 2010RIDOT OperatedCongregational Church, County Road Barrington 93 97%Police Cove Park Barrington 18 N/AFrenchtown Road & Route 4 East Greenwich 79Routes 2 & 4 East Greenwich 65 83%Route 44 (Taunton Avenue at MA <strong>State</strong> Line) East Providence 76 30%Route 3 & I-95 at Exit 1 Hopkinton 106 41%Routes 138 & 1A North Kingstown 150 27%Routes 2 & 102 North Kingstown 89 94%Grace & Pine Streets Pawtucket 20Grace & George Streets Pawtucket 21 57%Boyds Lane & Route 24 Portsmouth 20Routes 138 & I-95 at Exit 3 Richmond 46 9%Smithfield Commons, Routes 5 & 44 Smithfield 65 49%Kingston Train Station, Route 138 South Kingstown 170Fish Road & Route 24 Tiverton 92 44%Franklin Street Warren 85 31%Airport Road Warwick 133Routes 117 & I-95 at Exit 10 Warwick 200 52%Exit 7 & I-95 West Greenwich 107 60%Hopkins Hill Road, Exit 6A & I-95 West Greenwich 126Westerly Train Station, Railroad Avenue & High Street Westerly N/A N/ARIPTA OperatedGarden City at Midway Avenue/Post Office Cranston 100Route 122, Chimney Hill Apartments Cumberland 15Lincoln Mall, Route 116 & Route 146 Lincoln 33 85%Newport Gateway <strong>Transportation</strong> & Visitors Center Newport N/ARoutes 138 & US 1 at the Tower South Kingstown 25 154%Wakefield Mall, Tower Hill Road South Kingstown 36Park Square, Park Avenue at Shelter Woonsocket 40 N/ASource: RIDOT & RIPTA 2010<strong>Rhode</strong> <strong>Island</strong> Park n' Ride Lotsride locations. New sites are evaluated based on highway proximity, environmental constraints, right-<strong>of</strong>-way, andcost.<strong>Transportation</strong> <strong>2035</strong> (2012 Update)<strong>State</strong> Guide Plan Element 611<strong>Rhode</strong> <strong>Island</strong> <strong>State</strong>wide <strong>Planning</strong> ProgramA-4
December 2012RIPTA BUS ROUTES, SEPTEMBER 2012<strong>Transportation</strong> <strong>2035</strong> (2012 Update)<strong>State</strong> Guide Plan Element 611<strong>Rhode</strong> <strong>Island</strong> <strong>State</strong>wide <strong>Planning</strong> ProgramA-5
December 2012COMMUTER RAIL LOTSThe Massachusetts Bay Area <strong>Transportation</strong> Authority (MBTA) conducts vehicle counts at their South Attleboroand Attleboro stations for the commuter rail lots that utilize the rail service to Boston. The latest count for dailyvehicles was completed on June 22, 2010.StationVehicle CountSouth Attleboro 746Attleboro 698It is important to note that a majority <strong>of</strong> the vehicles parked at the South Attleboro commuter rail lot have <strong>Rhode</strong><strong>Island</strong> registration plates. The MBTA did not account for vehicle registration plate state origin in their June 2010survey. However in previous surveys, upwards <strong>of</strong> 90 percent <strong>of</strong> the vehicles parked at the South Attleborocommuter rail station contain <strong>Rhode</strong> <strong>Island</strong> registrations.In an agreement with the MBTA, <strong>Rhode</strong> <strong>Island</strong> extended MBTA commuter rail service to/from Boston south <strong>of</strong>Providence to T.F. Green Airport in 2010. The service was further expanded south in 2012 to the WickfordJunction Station in North Kingstown. The daily vehicles in <strong>Rhode</strong> <strong>Island</strong>’s commuter rail parking garages forpassengers most likely utilizing the MBTA service consist <strong>of</strong> the following:Station Vehicle Count TimeProvidence Train Station 306 September 14, 2012 at 11:00 a.m.Warwick Interlink 80 Daily Average for August 2012Wickford Junction 70 Daily Average for July 2, 2012 to July 20, 2012DEFINING CAUSES OF CONGESTIONRECURRING CONGESTIONRecurring congestion is fairly predictable and occurs primarily in the normal morning and late afternoon peakperiods when the traffic volumes on the roads approach or exceed the design capacity <strong>of</strong> the highway. This ismostly associated with commutation to work; however, schools also generate many trips and commuting traffic isnoticeably less when schools are not in session. Afternoon peak hour congestion is usually greater than morningpeak hour because <strong>of</strong> the additional volume <strong>of</strong> non-work trips (medical, social, retail, etc.) Bus routes may alsosuffer from recurring congestion during peak hours. Another type <strong>of</strong> recurring congestion is seasonal tourist <strong>of</strong>traffic. <strong>Rhode</strong> <strong>Island</strong> has a robust tourist economy, and summer weekend traffic in Newport and near the beachesin South County can be very challenging.Recurring congestion is monitored on <strong>Rhode</strong> <strong>Island</strong> interstate highways principally through the TrafficManagement Center (TMC) and Traffic.com. An extensive Intelligent <strong>Transportation</strong> System (ITS) detectscongestion and broadcasts traffic alerts to motorists using various means <strong>of</strong> communication.NON-RECURRING CONGESTIONThis type <strong>of</strong> congestion is event related – sometimes anticipated, sometimes not, but which is estimated by FHWAto be responsible for nearly half <strong>of</strong> traveler delays. Examples <strong>of</strong> event traffic that are anticipated includeconstruction work zones, special events (conventions, festivals, etc), and some weather events (hurricanes, snow,and heavy rains). Unanticipated events may include crashes and certain types <strong>of</strong> weather (summerthunderstorms).<strong>Transportation</strong> <strong>2035</strong> (2012 Update)<strong>State</strong> Guide Plan Element 611<strong>Rhode</strong> <strong>Island</strong> <strong>State</strong>wide <strong>Planning</strong> ProgramA-6
December 2012<strong>Rhode</strong> <strong>Island</strong>’s Incident Management Task Force (IMTF) is a process that has been in place for several years to planfor, monitor, and de-brief from non-recurring congestion due to incidents. The RIDOT/TMC supports this TaskForce, members <strong>of</strong> which include state and local police <strong>of</strong>ficers, E-911 staff, RIEMA staff and others. The goal is toclear incidents as quickly as possible and restore normal flow <strong>of</strong> traffic.DATASources <strong>of</strong> speed and volume data are now readily available from the TMC to reliably measure and quantify thetravel conditions from day to day. These continuous data sets, along with Traffic.com, and other non-recurringcongestion measures (number and duration <strong>of</strong> construction activities, the number <strong>of</strong> incidents such asbreakdowns and accidents, and the average clearance time for incidents), these measures can give some insightsto the extent <strong>of</strong> both recurring and non-recurring congestion. In 2011 RIDOT went live with real time travel timesdisplayed on some <strong>of</strong> the Dynamic Message Signs (DMS) that are located at strategic geographic points on theinterstate and major highways. The TMC collects travel times on over a dozen segments <strong>of</strong> I-95 in <strong>Rhode</strong> <strong>Island</strong>for both north and south bound traffic.Travel times collected for I-95 southbound include:From: Exit 30 (Middle Street, Pawtucket)To: Exit 22 (Downtown Providence)Exit 19 (I-195 EB) to Exit 13 (T.F. Green Airport)Exit 9 (RT 4, North Kingstown)Exit 5 (RT 102, West Greenwich)Exit 1 (RT 3, Hopkinton)From: Exit 26 (Lonsdale Ave, Pawtucket)To: Exit 22 (Downtown Providence)Exit 19 (I-195 EB)Exit 13 (Airport)Exit 9 (RT 4, North Kingstown)Exit 5 (RT 102, West Greenwich)Exit 1 (RT 3, Hopkinton)From: Exit 22 (Memorial Blvd, Downtown Providence)To: Exit 13 (Airport)Exit 9 (RT 4, North Kingstown)Exit 5 (RT 102, West Greenwich)Exit 1 (RT 3, Hopkinton)From: Exit 16 (RT 10, Cranston)To: Exit 13 (Airport)Exit 9 (RT 4, North Kingstown)Exit 5 (RT 102, West Greenwich)Exit 1 (RT 3, Hopkinton)From: Exit 10 (RT 117, Warwick)To: Exit 5 (RT 102, West Greenwich)Exit 1 (RT 3, Hopkinton)From: Exit 6 (RT 3, West Greenwich)To: Exit 5 (RT 102, West Greenwich)Exit 1 (RT 3, Hopkinton)<strong>Transportation</strong> <strong>2035</strong> (2012 Update)<strong>State</strong> Guide Plan Element 611<strong>Rhode</strong> <strong>Island</strong> <strong>State</strong>wide <strong>Planning</strong> ProgramA-7
December 2012Travel times collected for I-95 northbound include:From: Exit 1 (RT 3, Hopkinton)To: Exit 8 (RT 2, West Warwick)Exit 11 (I-295 NB)Exit 13 (Airport)Exit 19 (I-195 EB)Exit 22 (Downtown Providence)Exit 30 (Pawtucket)From: Exit 8 (RT 2, West Warwick)To: Exit 11 (I-295 NB)Exit 13 (Airport)Exit 19 (I-195 EB)Exit 22 (Downtown Providence)Exit 30 (Pawtucket)From: Exit 10 (RT 117, Warwick)To: Exit 19 (I-195 EB)Exit 22 (Downtown Providence)Exit 30 (Pawtucket)From: Exit 16 (RT 10, Cranston)To: Exit 19 (I-195 EB)Exit 22 (Downtown Providence)Exit 30 (Pawtucket)From: Exit 22 (Memorial Blvd, Downtown Providence)To: Exit 30 (Pawtucket)PERFORMANCE MEASURESIn addition to the data collection efforts, the TMC’s consultant Jacobs Engineering Inc. hired a subconsultantTrafInfo, Inc. to develop performance measures for the Interstate Highway System.The measures include the following Travel Time Reliability Measures:• Average Travel Time• 95th Percentile Travel Time• <strong>Planning</strong> Index• Buffer Index• Incident Clearance Time• Crash Rate• ITS Equipment UptimeThese performance measures were chosen by RIDOT with input from <strong>State</strong>wide <strong>Planning</strong>. The selection criteriaincluded:1. Follow FHWA/AASHTO recommendations2. Allow assessment <strong>of</strong> TMC functions3. Help improve safety and traffic operations4. Demonstrate the benefits derived from ITS5. Data must be• Reliable• Consistent• Readily Available<strong>Transportation</strong> <strong>2035</strong> (2012 Update)<strong>State</strong> Guide Plan Element 611<strong>Rhode</strong> <strong>Island</strong> <strong>State</strong>wide <strong>Planning</strong> ProgramA-8
December 2012• Ability to compute periodicallyThe Congestion Management Task Force will apply these performance measures to expand the significance andutility <strong>of</strong> the Congestion Management Process. The performance measures will be used to examine alternativesand to connect the CMP to long-term planning goals. The performance measures will also assist in identifying,analyzing, and evaluating the causes <strong>of</strong> congestion. The measures will assist RIDOT and the CMP in evaluating theeffect <strong>of</strong> strategies implemented to improve safety and congestion.<strong>Transportation</strong> <strong>2035</strong> (2012 Update)<strong>State</strong> Guide Plan Element 611<strong>Rhode</strong> <strong>Island</strong> <strong>State</strong>wide <strong>Planning</strong> ProgramA-9
December 2012PERFORMANCE MEASURES BASE MAP: HIGHWAY SEGMENTS, 2012<strong>Transportation</strong> <strong>2035</strong> (2012 Update)<strong>State</strong> Guide Plan Element 611<strong>Rhode</strong> <strong>Island</strong> <strong>State</strong>wide <strong>Planning</strong> ProgramA-10
December 2012ESTABLISHING A PROCESS TO MANAGE CONGESTIONPURPOSEA Congestion Management Process identifies, analyzes, and evaluates the causes <strong>of</strong> congestion within the majorcorridors <strong>of</strong> <strong>Rhode</strong> <strong>Island</strong>'s roadways, and evaluates the effect <strong>of</strong> implemented strategies to improve theseroadways.CONGESTION MANAGEMENT TASK FORCE (CMTF)The CMTF is the primary vehicle for the implementation <strong>of</strong> <strong>Rhode</strong> <strong>Island</strong>’s Congestion Management Process (CMP).It combines resources currently used to monitor both recurring and non-recurring congestion, and supplementsthat with staff from RIPTA, <strong>State</strong>wide <strong>Planning</strong>, and RIDOT’s Maintenance and Design <strong>Division</strong>s as partners andcollaborators.MEMBERSHIPThe Task Force is a multi-disciplinary group <strong>of</strong> federal, state, and local <strong>of</strong>ficials consisting <strong>of</strong> the followingrepresentatives, each with a particular area <strong>of</strong> expertise as noted in the table.Congestion Management Task ForceAgency Expertise Expectations BenefitsRIDOT / TMC<strong>State</strong>wide <strong>Planning</strong>RIPTARIDOT / DesignRIDOT / Intermodal<strong>Planning</strong>Incident managementCommunication with responders.Communication with generalpublic.Traffic data collection.ITS.Travel demand modelingLand use.Corridor planning.TDM strategies.Transit operations (bus).Rideshare.Site design for bus accessibility.Design for access management,roundabouts, and intersectioncapacity enhancements.Traffic safety.Park n’ Ride lot planning andmonitoringCoordinate/liaison with RIPTA onRIDOT construction projectsServe on RIPTA Strategic <strong>Planning</strong>CommitteeCommuter Rail Program ManagerTOD funding grantsCo-chair and convenemeetings. Report TMC data.Provide update on IncidentManagement Task Force.Co-chair meetings.Run TRANSCAD based traveldemand model in response torequest from CMTF.Provide route and ridershipinformation for Task Force invicinity <strong>of</strong> projects, congestedcorridors.Present project designsolutions.Supply relevant PhysicalAlteration Permit Applicationsfor CMTF input.Provide regular Park n’ Ride lotdataProvide commuter rail lotinformation and usage dataTMC assumes proactive role incongestion relief and showsincreased return oninvestment and greater valueto the taxpayer.Plan, TIP, and CMP connectivityand operational compatibility.Better information on futureconstruction activities. Greaterridership.Feedback loop on completedprojects. Have improvementsproduced the desired results?Minimize impacts on RIPTAservice due to congestion.Siting <strong>of</strong> new or expanded Parkn’ Ride lotsExpansion <strong>of</strong> commuter railsystemRIDOT / Upcoming projects and activities Provide specific days, dates, Improved operational<strong>Transportation</strong> <strong>2035</strong> (2012 Update)<strong>State</strong> Guide Plan Element 611<strong>Rhode</strong> <strong>Island</strong> <strong>State</strong>wide <strong>Planning</strong> ProgramA-11
December 2012Construction andMaintenanceFHWALocal Governmentrequiring use <strong>of</strong> travel surface.Safe Work Zone requirements.Best practices.Federal requirements for CMP.Local area knowledge. Land useand zoning controls. Subdivisionregulations.times, and location <strong>of</strong> lane androad closures.Contribute knowledge or casestudies <strong>of</strong> other state/MPOefforts in CM.Present results <strong>of</strong> local accessmanagement or corridorstudies undertaken.performance and a betterinformed motoring public.Positive return on federalinvestments.Feedback on plans andprojects. Forum to reach state<strong>of</strong>ficials.CMTF STRUCTURE AND FUNCTIONThe Task Force generally meets on a quarterly basis and discusses a variety <strong>of</strong> issues related to recurring and nonrecurringcongestion, as well as monitoring and reporting out the status <strong>of</strong> <strong>Rhode</strong> <strong>Island</strong>’s management <strong>of</strong>transportation congestion. The MPO and the RIDOT/TMC co-chair this Task Force. Its activities are part <strong>of</strong> theTMC budget.As part <strong>of</strong> the process, the Congestion Management Task Force identifies <strong>Rhode</strong> <strong>Island</strong>'s congested roadways andmay recommend the undertaking <strong>of</strong> detailed corridor plans to address congestion causes and prioritize solutionswithin those corridors. Using the strategies <strong>of</strong> congestion mitigation is particularly important for <strong>Rhode</strong> <strong>Island</strong>'sroadways because most <strong>of</strong> the corridors are physically and politically constrained from major capacity expansions(such as adding travel lanes). Accordingly, congestion mitigation strategies must focus on expanding travel choicesin the corridor to improve operation <strong>of</strong> the transportation system and encourage the use <strong>of</strong> other transportationmodes without promoting the use <strong>of</strong> single-occupant vehicles. The process examines and evaluates existing trafficuse, present and projected land use and socioeconomic information, accident data, and trends within the studyarea to identify the location, causes, and severity <strong>of</strong> congestion.The effectiveness <strong>of</strong> the CMTF relies on the system <strong>of</strong> data collection, data monitoring and travel forecasting toidentify the existing locations <strong>of</strong> congestion in the region and to forecast the locations where congestion is likely toexist in the future. The CMTF also identifies and helps determine the severity <strong>of</strong> and causes <strong>of</strong> the congestion.CMTF STRATEGIES AND RECOMMENDATIONSThis group makes recommendations to be implemented immediately through the TMC, short term through RIPTAor active design <strong>of</strong> projects, or long term through TIP projects and land use regulations. The universe <strong>of</strong> potentialrecommendations or strategies is presented in the next section. The graphic below describes the inputs andoutputs <strong>of</strong> this process anddemonstrates that the solutions get fedback into the process for performanceand evaluation.The following table presents congestionmitigation strategies and technologiesthat will be considered, deployed, orcontinued based on the characteristics<strong>of</strong> the subject corridor.<strong>Transportation</strong> <strong>2035</strong> (2012 Update)<strong>State</strong> Guide Plan Element 611<strong>Rhode</strong> <strong>Island</strong> <strong>State</strong>wide <strong>Planning</strong> ProgramA-12
December 2012Congestion Mitigation Strategies & TechnologiesStrategy (based onhierarchy developedin 2004 CMS)RecurringCongestionNon-RecurringAgencyData RequiredPerformanceMeasure1. Improve OperationsDetectionI-95 CorridorCoalition VehicleProbe Project *PublicInformation /ATIS 1IncidentClearanceTrafficSignalizationRIDOT/TMCRIDOT, I-95CorridorCoalition MOURIDOT/TMCRIDOT / TMC /IMTFRIDOT, Cities&Towns (C&T)Speed andVolumeSpeedEquipment andcommunication logIncident logsIntersection CapacityStudyNumber <strong>of</strong> incidentsdetectedTravel timeNumber <strong>of</strong>Signs/MessagesIncident Clearance TimeLevel <strong>of</strong> ServiceAccessManagement 2 RIDOT, C&T Crash Data, Volume Level <strong>of</strong> Service,Number <strong>of</strong> CrashesConstructionSchedulingIntersectionImprovementsStorm PlansCongestionPricing2. Mode Shift (TCM) 3RIDOTProject Dates andLocationsLength <strong>of</strong> DelayRIDOT Intersection Study Level <strong>of</strong> ServiceRIEMA / RIDOTNumber Evacuating,Speed and VolumeNumber Stranded, LaneMiles Free flowingRIDOT Volume, travel time Length <strong>of</strong> DelayTransit - Bus RIPTA Farebox RidershipTransit - Rail RIDOT Passenger Counts RidershipAPTS 4 RIPTA Farebox/Ticketing RidershipCarpool RIPTA Survey/Census Mode SplitBike RIDOT, C&T Survey/Census/Counts Mode SplitPedestrian RIDOT, C&T Survey/Census Mode SplitCommuterResource RIRIPTA Number <strong>of</strong> Contacts Number <strong>of</strong> Customers*Project objective is to develop and maintain a corridor wide traffic monitoring system to deliver travel times and speeds on freeways andarterials. Please see “Operational Improvements” on following page for more detailed information.1 The Advanced Traveler Information System (ATIS) is devoted to the real-time distribution <strong>of</strong> current traffic, weather and other travel relatedinformation to cars, drivers and other Smart Travelers.2 Please see “Recommendations <strong>of</strong> the Access Management Task Force,” 20083<strong>Transportation</strong> Control Measure (TCM). A strategy to reduce driving or smooth traffic. They are also used to reduce emissions. Examples <strong>of</strong>TCM's include new or increased rail transit service, or a program to promote carpools and vanpools.4 Advanced Public <strong>Transportation</strong> Systems (APTS). May consist <strong>of</strong> digital radio communications, global positioning systems, smart card readers,automated passenger counting, automated vehicle systems monitoring, and automated transit information (travel time, wayside, in terminal, invehicle and pre-trip).<strong>Transportation</strong> <strong>2035</strong> (2012 Update)<strong>State</strong> Guide Plan Element 611<strong>Rhode</strong> <strong>Island</strong> <strong>State</strong>wide <strong>Planning</strong> ProgramA-13
December 2012Strategy (based onhierarchy developedin 2004 CMS)RecurringCongestion Mitigation Strategies & Technologies (cont.)CongestionNon-RecurringAgencyData RequiredPerformanceMeasureFlex Time Private Survey Length <strong>of</strong> DelayTelecommute Private Survey VMT saved4. Land UseComp <strong>Planning</strong> /Zoning / ModelOrdinancesTransit OrientedDevelopmentGrowth Centers /Urban ServiceAreaAccessManagementCorridor Plans5. Add CapacityCommuterParkingRail (Warwick,Wickford andothers)SPP, C&TSPP, C&TSPP, C&TFuture Land Use andZoning MapsCensus, Building Permits,Certificate <strong>of</strong> OccupancyCensus, Building Permits,Certificate <strong>of</strong> OccupancyAcreage zoned HDRPopulation Density,Number <strong>of</strong> UnitsPopulation Density,Number <strong>of</strong> UnitsSPP, C&T Crash Data, Volume Level <strong>of</strong> Service,Number <strong>of</strong> CrashesRIDOT, C&TRIDOT / RIPTA Vehicle Counts Lot UsageRIDOT Passenger Counts Ridership, VMT saved,On-time performanceBus Service RIPTA Ridership, Speed andVolumeHighway (exit 6 I-295 to I-95 @ CTborder)Ridership, VMT savedRIDOT Speed and Volume Level <strong>of</strong> ServiceHOV lanes RIDOT Speed and Volume Level <strong>of</strong> ServiceOPERATIONAL IMPROVEMENTSThe I-95 Corridor Coalition’s Vehicle Probe Project (VPP) enables member agencies to monitor and manage theirtransportation network, provide accurate traffic information to their users, and assess network performance. Theproject’s objective is to develop and maintain a corridor -wide traffic monitoring system to deliver travel times andspeeds on freeways and arterials.Of the 16 states in the I-95 Corridor Coalition, 10 (ten) states are now receiving and using real-time data to powertheir 511 systems, provide travel time statewide and comply with the forthcoming interstate traffic monitoringrequirements <strong>of</strong> 23 CFR 511. This is the result <strong>of</strong> the multi-state collaborative effort among the I-95 Coalition,University <strong>of</strong> Maryland, and INRIX. Coverage is continuous from New Jersey to Florida.Continuing under Operational Improvements, the <strong>Rhode</strong> <strong>Island</strong> Strategically Targeted Affordable RoadwaySolutions (RISTARS) has become a key program for the congestion management process. Administered out <strong>of</strong> theRIDOT’s Traffic Management and Highway Safety Unit, this program identifies critical safety and congestion<strong>Transportation</strong> <strong>2035</strong> (2012 Update)<strong>State</strong> Guide Plan Element 611<strong>Rhode</strong> <strong>Island</strong> <strong>State</strong>wide <strong>Planning</strong> ProgramA-14
December 2012locations. RIDOT then works with local governments and planning bodies to develop a detailed improvement planfor the selected locations focused on delivering low-cost and high benefit safety and mobility improvements.RISTARS first major initiative centered on Aquidneck <strong>Island</strong> and was based on the recommendations <strong>of</strong> theAquidneck <strong>Island</strong> <strong>Transportation</strong> Corridor Study. RISTARS was selected to commence design work on selectrecommended improvements to problem areas related to congestion and safety identified from the Aquidneck<strong>Island</strong> Corridor Study. The corridor study was funded through a FHWA and RIDOT administered by <strong>State</strong>wide<strong>Planning</strong> and directed by the Aquidneck <strong>Island</strong> <strong>Planning</strong> Commission. RISTARS is now focusing on data scanning forcongestion and traffic safety problems in other travel corridors <strong>of</strong> the state. In addition, the program will begearing up to conduct similar corridor studies in other regions <strong>of</strong> <strong>Rhode</strong> <strong>Island</strong>.Finally, RIDOT has deployed Road Safety Audit (RSA) teams to several corridors and selected roadways around thestate to address high hazard and other safety and intersection operational improvements. A Road Safety Audit(RSA) is the formal safety performance examination <strong>of</strong> an existing or future road or intersection by anindependent, multidisciplinary team. A RSA qualitatively estimates and reports on potential road safety issues andidentifies opportunities for improvements in safety for all road users. The FHWA works with state and localjurisdictions and Tribal Governments to integrate RSAs into the project development process for new roads andintersections, and also encourages RSAs on existing roads and intersections.The aim <strong>of</strong> an RSA is to answer the following questions:• What elements <strong>of</strong> the road may present a safety concern: to what extent, to which road users, and underwhat circumstances?• What opportunities exist to eliminate or mitigate identified safety concerns?Road Safety AuditPerformed by a team independent <strong>of</strong> the projectPerformed by a multi-disciplinary teamConsiders all potential road usersAccounting for road user capabilities and limitations is an essential element <strong>of</strong> an RSAAlways generates a formal RSA reportA formal response report is an essential element <strong>of</strong> an RSAAquidneck <strong>Island</strong>, the Warwick Interlink area, Atwells Avenue in Providence, and the I-95 corridor in <strong>Rhode</strong> <strong>Island</strong>are the most recent RSA study areas. The RSA is a new tool which will be a staple <strong>of</strong> the RIDOT and the CMP.LAND USE MANAGEMENTACCESS MANAGEMENT TASK FORCEUnder the charge and leadership <strong>of</strong> the state’s Congestion Management Task Force, the Access Management TaskForce was formed to review and formulate recommendations for RIDOT and local governments to improve thePhysical Alteration Permit Process (PAP) regulations and process, and in turn, existing conditions on stateroadways through the application <strong>of</strong> best practices in access management.<strong>Transportation</strong> <strong>2035</strong> (2012 Update)<strong>State</strong> Guide Plan Element 611<strong>Rhode</strong> <strong>Island</strong> <strong>State</strong>wide <strong>Planning</strong> ProgramA-15
December 2012PLANNING CHALLENGE GRANTS<strong>Planning</strong> Challenge Grants are administered by the <strong>State</strong>wide <strong>Planning</strong> Program and funded with Federal HighwayAdministration (FHWA) Metropolitan <strong>Planning</strong> funds received by the <strong>State</strong> <strong>of</strong> <strong>Rhode</strong> <strong>Island</strong> and allocated to the<strong>State</strong>wide <strong>Planning</strong> Program. The purpose <strong>of</strong> the grant program is to provide funding for statewide, regional, andlocal planning studies leading to the implementation <strong>of</strong> the <strong>State</strong> Guide Plan, particularly Land Use 2025 and<strong>Transportation</strong> <strong>2035</strong>. The studies must have a transportation planning focus, for example, multi-modaltransportation system issues or the interaction between transportation and other aspects <strong>of</strong> communitydevelopment including land use. These grants must result in products that lead to or further implement andadvance solutions to the issues proposed for study. To be eligible for a grant, an applicant must demonstratemunicipal government support and a commitment to implementation. Grants for the towns <strong>of</strong> Bristol, Smithfield,and Warren enabled the recent completion <strong>of</strong> studies with corridor access management components.<strong>Transportation</strong> <strong>2035</strong> (2012 Update)<strong>State</strong> Guide Plan Element 611<strong>Rhode</strong> <strong>Island</strong> <strong>State</strong>wide <strong>Planning</strong> ProgramA-16
December 2012APPENDIX BSURVEY RESULTSFor twelve months beginning in 2007 and ending in 2008, RI <strong>State</strong>wide <strong>Planning</strong>’s <strong>Transportation</strong> Section conducted a <strong>Transportation</strong> 2030 survey. The surveylink was posted on the website and administered online through SurveyMonkey. In addition, staff received written responses obtained through public outreachevents that were incorporated into this analysis. A total <strong>of</strong> 135 responses were received.Almost one half <strong>of</strong> the respondents were 25 to 39 years <strong>of</strong> age with most <strong>of</strong> the remaining balance older. Over seventy percent (70%) have incomes above themedian. Sixty-six percent (66%) were male and almost all white (93%). Only two percent (2%) indicated some kind <strong>of</strong> mobility related disability. Sixty-fivepercent (65%) own two or more vehicles. Thirty-three percent (33%) have one vehicle. Most use their private automobiles as their primary means <strong>of</strong>transportation. They also indicated that they drive alone up to 20 miles per day because it is the most convenient form <strong>of</strong> transportation and the least timeconsuming.For the people who have indicated they use transit, it is a fifty percent split for work and recreation as the purpose (which could possibly be attributable to theProvidence Newport Ferry). Affordability and environmental friendliness are the major reasons for utilizing this mode. Most <strong>of</strong> their trips begin with a fiveminutewalk to the bus stop, and the ride for fifty-eight percent (58%) <strong>of</strong> them takes 15 to 45 minutes. The three top vote getters in what would get them touse transit more <strong>of</strong>ten: 1. transit ran more <strong>of</strong>ten, 2. commuter rail from outlying points to Providence, 3. did not have to transfer.Eighty-nine percent (89%) <strong>of</strong> walkers are doing so for recreation and fitness, but eleven percent (11%) are actually going somewhere. The majority walks 1 to 3miles per day, predominantly for exercise. Cyclists are riding for recreation or fitness (ninety-five percent <strong>of</strong> the respondents) for two miles or less, and theyare riding on a bike trail or around a neighborhood.We asked people to rank funding priorities for the future while showing them a pie chart <strong>of</strong> where the monies are invested now. They chose the followingranking.1. Commuter rail and sidewalks (tied).2. Bus, trolley, and special needs services.3. Bike paths and lanes.4. Pavement management.5. Bridge maintenance.<strong>Transportation</strong> <strong>2035</strong> (2012 Update)<strong>State</strong> Guide Plan Element 611<strong>Rhode</strong> <strong>Island</strong> <strong>State</strong>wide <strong>Planning</strong> Program B-1
December 20126. Interstate and highway maintenance.7. Air quality projects.8. Safety related projects.9. Ferry service.10. Park-and-ride lots.11. ITS and landscaping.With that said, sixty-seven percent (67%) favored increasing the gas tax, and are also in favor <strong>of</strong> the proposal to increase the registration fees on SUVs andtrucks (39%), especially if that funding is used for transportation (49%).When we asked them how should we improve our roadways, they answered, with:1. more sidewalks and bike lanes2. roundabouts3. more signage.Then we asked how to improve the appearance <strong>of</strong> our roads. They said,1. more landscaping2. fewer billboardsFinally we asked respondents why they live were they live. Their neighborhood was the primary attraction, with affordability and proximity to work comingsecond and third.A land use question and future living location rounded out this section. People who chose to answer said that commercial and residential growth should bedirected to urban or downtown locations with villages and mixed-use locations second. This includes existing and new centers. We asked where they wouldmove to next given the choices <strong>of</strong> 1. rural, large lot suburban, 2. traditional small lot neighborhood, 3. village with mixed use or 4. downtown or urban? Theresults were thirty-three percent (33%) to a downtown or urban setting and twenty-nine percent (29%) to a village with mixed use. The remainder was splitevenly between the choices <strong>of</strong> suburban and rural living.The survey instrument and results (in red) appear below.<strong>Transportation</strong> <strong>2035</strong> (2012 Update)<strong>State</strong> Guide Plan Element 611<strong>Rhode</strong> <strong>Island</strong> <strong>State</strong>wide <strong>Planning</strong> Program B-2
December 2012APPENDIX C - TRANSPORTATION FUNDING SCENARIOS<strong>Transportation</strong> <strong>2035</strong> (2012 Update)<strong>State</strong> Guide Plan Element 611<strong>Rhode</strong> <strong>Island</strong> <strong>State</strong>wide <strong>Planning</strong> Program C-1
December 2012TRANSPORTATION FUNDING SCENARIOSannual costs in millions <strong>of</strong> dollars<strong>Transportation</strong> Elements Sink Units Tread Water Units Swim UnitsWin theRaceUnits AssumptionsRIDOT OperationsRIDOT Central Management $3.60 $4.50 $4.50 $5.00RIDOT Management & Budget $3.43 $5.00 $5.00 $6.00RIDOT Engineering $3.72 $5.00 $5.00 $5.00 RIDOT Engineering should be 100% state fundedRIDOT Maintenance OperationsMaintenance $25.00 $35.00 $40.00 $50.00Maintenance currently funded based on limited budget after debt service andwinter maintenance needs met. Ideally, to properly maintain maintain statefacilities, double the amount <strong>of</strong> funding is required.Winter Maintenance $6.22 $12.00 $12.00 $15.00Vehicle Maintenance $3.33 $5.00 $5.00 $5.00Stormdrain Cleaning $0.00 $2.00 $2.00 $2.00SUBTOTAL $45.30 $68.50 $73.50 $88.00Capital Program Labor $0.00 $40.00 $40.00 $40.00TOTAL Operations $45.30 $108.50 $113.50 $128.00Capital MaintenanceBridge Inspection $1.50 1 $3.00 20 $5.00 20 $7.50 25Bridge Painting $0.30 $6.00 $6.00 $7.50Bridge Preventive Maintenance $2.00 $5.00 $10.00 $20.00Bridge Washing $0.50 1.25 $1.00 2 $2.00 6 $5.00 10Drainage $0.62 $5.50 $8.50 18 $18.00Thin Overlays $3.50 $5.00 $7.50 $10.00Crack Sealing $1.00 $1.50 1,000 $2.00 1,500 $2.00 2,000Repair Lighting $0.00 $0.50 $0.75 $1.00Repair Damaged Hardware $1.00 $2.00 $2.00 $3.00Sign Replacement $1.50 12 $3.00 25 $4.00 32 $6.00 48Signal Construction $0.90 9 $2.00 20 $5.00 50 $8.00 80Striping $6.24 2,580 $7.50 3,200 $15.00 6,400 $20.00 8,500Deck Joints $0.20 8 $2.50 100 $2.50 100 $2.50 100Traffic Monitoring $0.31 $0.50 $1.00 $2.00$19.57 $45.00 $71.25 $112.50HighwayImplementing a realistic capital maintenance program with state funds willenable RIDOT to reduce costs for road and bridge reconstruction andreplacements over the long term.Reconstruction/New Sidewalks $0.38 $36.00 4 $36.00 4 $36.004 miles per year, does not increase due to better scheduled 1R projects, 144 miles <strong>of</strong> sidewalk rehabilitation is included. RIDOT personnel costs areremoved from projects and funded at 100% state cost.Resurfacing (1R) $2.61 $50.00 100 $72.00 $72.00Includes sidewalks with repaving on a 15 year cycle, and personnel costs areremoved from projects and funded at 100% state cost.Major Highway Projects $15.63 $50.00 $50.00 $50.00Projects include: I-95/RI-4 interchange, Waterfront Drive, Apponaug Circulator,RI146/RI-116 interchange, RI-4/US-1 interchange, Pell BridgeInterstate $18.60 $25.00 $40.00 $50.00Projects include: (Swim) Third lane on I-95: from I-295 to I-95 Exit 6 and on I-295 from I-95 to RI-37; (Win) Third lane on I-95: from I-95 Exit 6 to CT <strong>State</strong>line and on I-295: RI-37 to US-6.Local <strong>Transportation</strong> Assistance $0.00 $0.00 $25.00 $100.00 Establish a new local transportation road and bridge funding source.Landscape $1.87 $6.00 100 $7.50 $10.00Stormdrain System Upgrades $0.85 $4.00 $4.00 $4.00Access Management $0.00 $3.00 $5.00 $10.00 Begin a new access management program<strong>Transportation</strong> <strong>2035</strong> (2012 Update)<strong>State</strong> Guide Plan Element 611<strong>Rhode</strong> <strong>Island</strong> <strong>State</strong>wide <strong>Planning</strong> Program C-2
December 2012<strong>Transportation</strong> Elements Sink Units Tread Water Units Swim Units Win the Race Units AssumptionsADA $2.34 $3.00 $5.00 $10.00$42.28 $177.00 204 $244.50 $342.00Traffic SafetyHigh Hazard Intersections $4.56 18 $10.00 40 $15.00 40 $25.00 50Arterials $1.25 16 $7.50 50 $10.00 50 $15.00 60$5.81 $17.50 $25.00 $40.00BridgeReplacements/Rehabilitations $60.51 16 $78.00 26 $78.00 26 $78.00 26Major Bridge Projects $6.64 2 $50.00 5 $50.00 5 $50.00 5 Projects include: Providence Viaduct, Bridge #550, Henderson Bridge$67.15 $128.00 $128.00 $128.00Bike/PedestrianRecreational Trails $0.60 $0.75 $0.75 $0.75New Sidewalks $2.10 4 $4.00 8 $6.00 12 $8.00 15 New sidewalks not included in the highway reconstruction and 1R programsIncludes on- and <strong>of</strong>f-road bike paths, and ROW acquisitions: (Tread) finishBike Paths $5.00 4 $10.00 12 $15.00 12 $20.00 15 system in TIP; (Swim) complete connections between various legs <strong>of</strong> thesystem; (Win) rehabilitate and build major bridges.Safe Routes to School $0.82 10 $1.00 10 $2.00 20 $3.00 30$8.52 $15.75 $23.75 $31.75SPR/PL $5.00 $8.00 $8.00 $8.00Enhancements<strong>Transportation</strong> $2.22 8 $12.75 16 $15.00 16 $25.00 20Non-<strong>Transportation</strong> $1.78 $0.00 $0.00 $0.00$4.00 $12.75 $15.00 $25.00CMAQRIDOT $5.68 $7.00 $8.00 $8.00RIPTA $3.08 $6.00 $7.00 $7.00RIDEM $0.75 $1.00 $1.50 $1.50Other $0.24 $2.00 $3.50 $3.50$9.75 $16.00 $20.00 $20.00Labor Charges transferred toOperations$0.00 ($40.00) ($40.00) ($40.00)Commuter RailCapital $3.00 $10.00 $25.00 $30.00Operations $2.37 $3.50 $7.00 $30.00$5.37 $13.50 $32.00 $60.00Warwick Train Station $15.00 $0.00 $0.00 $0.00ROW $0.25 $0.50 $5.00 $10.00Design $20.50 $25.00 $40.00 $60.00RIPTA BusCapital $24.00 $30.00 $35.00 $50.00Operations $88.00 $125.00 $140.00 $175.00$112.00 $155.00 $175.00 $225.00Total $360.50 $682.50 $861.00 $1,150.25(Swim) includes Providence to Westerly service, Aquidneck <strong>Island</strong> service; (Win)includes Blackstone Valley service, Providence metro area streetcars, busways orother fixed guideway systems. Subject to change based on RIPTA transit study.Tread provides regular replacement <strong>of</strong> buses, vans and non-revenue vehicles. Swimrelieves overcrowding and provides for modest increase in service. Win includesexpanded flex service, addition <strong>of</strong> 1 major transit hub in Providence and a new satellitehub in the suburbs. Figures subject to change.<strong>Transportation</strong> <strong>2035</strong> (2012 Update)<strong>State</strong> Guide Plan Element 611<strong>Rhode</strong> <strong>Island</strong> <strong>State</strong>wide <strong>Planning</strong> Program C-3
December 2012<strong>Transportation</strong> Elements Sink Units Tread Water Units Swim Units Win the Race Units AssumptionsGARVEE* 58.00 $0.00 $0.00 GARVEE debt service will be complete by 2026.Other debt service** 35.00Total with debt service 453.50 *Ends in 2022 at $16.5m per year (peaks 2017-2019 at $51m).**Increases from $41m in 2009 to $63m in 2023 per year if this practice continues.There will be a transition period between scenarios in which old debt must be paid down.Debt service covered by gasoline tax is scheduled to increase dramaticallyunless a new source <strong>of</strong> match funding is found. The assumption is that a newsource will be found and that RIDOT will pay a declining amount <strong>of</strong> debtservice until the principle balance is paid.STATE REVENUE SOURCES Sink Units Tread Water Units Swim Units Win the Race UnitsGAS TAX 132.00 0.30 205.00 0.45 273.00 0.60 341.00 0.75 Each penny yields 4.55 millionREGISTRATION FEES 0.00 50.00 75.00 100.00 Requires diversion <strong>of</strong> current revenue in Tread; increase in Swim and WinVEHICLE SALES TAX 0.00 80.00 7% 80.00 7% 80.00 7% Requires diversion <strong>of</strong> current revenueTOLLS 0.00 30.00 50.00 60.00 Does not include Newport Bridge tollsGAS SALES TAX 0.00 0.00 0.00 80.00 7% 4.55 million gallons, $2.50 per gallon, 7% taxGEN OBLIGATION BONDS 40.00 0.00 0.00 0.00FAREBOX 20.00 35.00 40.00 55.00 25% farebox recovery <strong>of</strong> bus and rail operationsOTHER 12.00 15.00 17.00 20.00 Advertising, land sales, other miscellaneous revenueSTATE Subtotal 204.00 415.00 535.00 736.00FEDERAL REVENUEFHWA 200.00 210.00 250.00 310.00NHTSA 6.00 2.00 2.00 5.00FTA 45.00 55.00 75.00 100.00TOTAL 455.00 682.00 862.00 1151.00ALTERNATIVE FUNDINGMILEAGE TAX 423.00 5.1 632.00 7.6 805.00 9.7 1076.00 13.0Pennies per mile tax to replace all state and federal revenue except Fareboxand Other. 8.3 Billion VMT per year in RI.<strong>Transportation</strong> <strong>2035</strong> (2012 Update)<strong>State</strong> Guide Plan Element 611<strong>Rhode</strong> <strong>Island</strong> <strong>State</strong>wide <strong>Planning</strong> Program C-4
December 2012APPENDIX D – GLOSSARY, ACRONYMS, AND LINKSGLOSSARYAnnual Average Daily Traffic (AADT) – Actual or estimated typical daily traffic on a road segment for all days <strong>of</strong> the week, Sunday through Saturday, over theperiod <strong>of</strong> one year. Estimates may be derived from partial count data.Average Daily Traffic (ADT) – Actual or estimated typical daily traffic on a road segment for one day, usually either a weekday or a weekend day. Estimatesmay be derived from partial count data.Access – The facilities and services that make it possible to get to any destination, measured by the availability <strong>of</strong> physical connections (roads, sidewalks, etc.),travel options, ease <strong>of</strong> movement, and nearness <strong>of</strong> destinations.Clean Air Act and its Amendments (CAAA) - The federal law that requires urban areas not meeting air quality standards to modify transportation policies inorder to reduce emissions. This law makes air quality a primary concern in transportation decision-making.Congestion Mitigation and Air Quality (CMAQ) - A special provision <strong>of</strong> the Intermodal Surface <strong>Transportation</strong> Efficiency Act that directs funds towards projectsin Clean Air Act Non-Attainment areas for ozone and carbon monoxide.Congestion Management System (CMS) - A systematic process, which provides information on transportation system performance and alternative strategiesto alleviate congestion and enhance the mobility <strong>of</strong> persons and goods. A CMS includes methods to monitor and evaluate performance, identify alternativeactions, access and implement cost-effective actions, and evaluate the effectiveness <strong>of</strong> implemented actions.Conformity – An assessment <strong>of</strong> the compliance <strong>of</strong> any transportation plan, program, or project with air quality improvement plans. The Clean Air Act definesthe conformity process.East Coast Greenway – A proposed 3,000 mile traffic free path from Calais, Maine to Key West, Florida.Environmental Protection Agency (EPA) – The federal regulatory agency responsible for administrating and enforcing federal environmental laws including theClean Air Act.Federal Highway Administration (FHWA) – The agency <strong>of</strong> the U. S. Department <strong>of</strong> <strong>Transportation</strong> that funds surface transportation planning and programs.<strong>Transportation</strong> <strong>2035</strong> (2012 Update)<strong>State</strong> Guide Plan Element 611<strong>Rhode</strong> <strong>Island</strong> <strong>State</strong>wide <strong>Planning</strong> Program D-1
December 2012Financial Plan - TEA 21 requires that Plan recommendations are actually affordable. There should be a reasonable certainty that funding sources will beadequate for implementation.Functional Classification – A hierarchical system <strong>of</strong> categorizing streets and roads on the basis <strong>of</strong> the way they are used, the volumes <strong>of</strong> traffic they carry, andthe way they function within the context <strong>of</strong> the overall transportation system.Federal Transit Administration (FTA) – An agency <strong>of</strong> the U.S. Department <strong>of</strong> <strong>Transportation</strong> that funds public transportation planning and programs.High Occupancy Vehicle (HOV) Lanes - Lanes on heavily congested roadways that are used exclusively by carpools, vanpools, buses or any vehicle thattransports multiple passengers.Intelligent <strong>Transportation</strong> Systems (ITS) - Technologies that improve the management and efficiency <strong>of</strong> our transportation system, such as electronic tollcollection, timed traffic signals, onboard navigation systems, traffic monitoring devices, and driver information systems.Intermodal – The term “mode” refers to and distinguishes the various forms <strong>of</strong> transportation, such as automobile, transit, ship, bicycling and walking.Intermodal refers specifically to the connections between modes.Intramodal - See ‘Intermodal’ (above) for definition <strong>of</strong> “mode”. Intermodal refers specifically to the connections within a single mode.Intermodal Surface <strong>Transportation</strong> Efficiency Act (ISTEA) – The federal transportation authorization bill <strong>of</strong> 1991, landmark legislation that restructuredprograms for all methods <strong>of</strong> transportation. (Reauthorized as TEA-21 in 1998.)Land Use – Activities conducted on the land, such as housing, shopping centers, farms, and <strong>of</strong>fice buildings.Level <strong>of</strong> Service (LOS) – A rating <strong>of</strong> the performance <strong>of</strong> a highway segment or intersection using the letters A (no delays) through F (failing).Metropolitan <strong>Planning</strong> Organization (MPO) – The organization required by the federal government, designated by states, and operated by local <strong>of</strong>ficials fordeveloping transportation programs in urban areas <strong>of</strong> 50,000 or more people. The MPO for our region is the <strong>State</strong> <strong>Planning</strong> Council.Mobility – The movement <strong>of</strong> people or goods throughout our communities and across the region. Mobility is measured in terms <strong>of</strong> travel time, comfort,convenience, safety and cost.Multimodal – A transportation system that considers and provides facilities for all modes (auto, bus, bike, pedestrian, rail).Park-and-Ride – Parking lots in outlying areas for people who use transit, carpools, or vanpools for trips.<strong>Transportation</strong> <strong>2035</strong> (2012 Update)<strong>State</strong> Guide Plan Element 611<strong>Rhode</strong> <strong>Island</strong> <strong>State</strong>wide <strong>Planning</strong> Program D-2
December 2012Plan – A blueprint to guide the region’s transportation for the next 25 years. Federal law requires the Plan be updated every three years (in areas that do notmeet air quality standards) to ensure that the plan remains current and effective at achieving the goals. Sometimes referred to as Regional <strong>Transportation</strong> Plan(RTP) or Long Range Plan (LRP).Safe, Accountable, Flexible, Efficient <strong>Transportation</strong> Equity Act – A Legacy for Users (SAFETEA-LU) - SAFETEA-LU authorizes the Federal surface transportationprograms for highways, highway safety, and transit for the 5-year period 2005-2009. It was signed into effect in august 2005 and replaced and expanded onthe previous TEA-21 authorization bill.<strong>State</strong>wide Implementation Plan (SIP) – Documents prepared by states and submitted to the EPA for approval, which identify actions and programs to carry outthe requirements <strong>of</strong> the Clean Air Act.<strong>State</strong>wide Travel Demand Model: The model is an effective tool for determining changes or redistribution <strong>of</strong> traffic flows associated with changes orimprovements to the network. The model is also used in projecting future traffic on the networks due to changes in demographics, or the development <strong>of</strong>special trip generators such as new businesses or stadiums. Computerized demand models are sophisticated and provide additional data such as system wideVMT’s or VHT’s (vehicle miles <strong>of</strong> travel and vehicle hours <strong>of</strong> travel). A model can also provide estimates <strong>of</strong> travel speeds on a link-by-link basis. The speeds arenormally predicted as an average 24-hour speed; however, they can be adjusted to provide an average hourly speed.<strong>Transportation</strong> Advisory Committee (TAC) – An advisory committee to the RI <strong>State</strong> <strong>Planning</strong> Council that represents a diverse group <strong>of</strong> organizations. Themission <strong>of</strong> the TAC is to advise the Council on public participation strategies, the Plan, and the TIP, and to provide a forum for public input.<strong>Transportation</strong> Equity Act for the 21st Century (TEA-21) – The acronym for the 1998 federal transportation authorization bill. Replaced ISTEA, but continuedand expanded ISTEA’s restructured programs for all modes <strong>of</strong> transportation. It provides guidelines to authorize federal funding <strong>of</strong> transportation projects.(Reauthorized as SAFETEA-LU in 2005)<strong>Transportation</strong> <strong>2035</strong> (2012 Update)<strong>State</strong> Guide Plan Element 611<strong>Rhode</strong> <strong>Island</strong> <strong>State</strong>wide <strong>Planning</strong> Program D-3
December 2012Texas <strong>Transportation</strong> Institute (TTI) – Research institution.<strong>Transportation</strong> Improvement Program (TIP) – A program that lists all federally funded projects and services in the MPO region, covering a period <strong>of</strong> threeyears. It is developed annually in cooperation with RIDOT and affected transit operators.Traffic Calming Techniques – Design techniques to decrease the speed <strong>of</strong> vehicle traffic on streets, while still providing vehicle circulation in an area.Techniques include speed bumps, landscaping, and roundabouts.Transit – Passenger service provided to the public along established routes. Paratransit is a demand - response service serving the needs <strong>of</strong> persons thatstandard fixed route transit would serve with difficulty or not at all.Transit-Oriented Development (TOD) - Characterized by a layout that encourages use <strong>of</strong> public transit service and walking or bicycling instead <strong>of</strong> automobileuse for many trip purposes. Typically, it places higher density development within an easy walking distance (¼ to ½ mile) <strong>of</strong> a public transit station or stop andis mixed-use and accessible by other modes. It is compact, pedestrian friendly, and has a transit stop or station as an activity center.Unified <strong>Planning</strong> Work Program (UPWP) – A plan, developed by MPO, that guides alltransportation planning activities for agencies in the MPO region.Vehicle Miles <strong>of</strong> Travel (VMT) – A standard area-wide measure <strong>of</strong> travel activity, calculated by multiplying average trip length by the total number <strong>of</strong> trips.ACRONYMSText that is underlined is a web link to that organization or subjectA text definition that is followed by an asterisk “*” is further defined in the glossaryAADTAASHTOADAADTAMPOAPAAnnual Average Daily Traffic*American Association <strong>of</strong> <strong>State</strong> Highway and <strong>Transportation</strong> OfficialsAmericans with Disabilities ActAverage Daily Traffic*Association <strong>of</strong> Metropolitan <strong>Planning</strong> OrganizationsAmerican <strong>Planning</strong> Association<strong>Transportation</strong> <strong>2035</strong> (2012 Update)<strong>State</strong> Guide Plan Element 611<strong>Rhode</strong> <strong>Island</strong> <strong>State</strong>wide <strong>Planning</strong> Program D-4
December 2012AQ/ TBIDBTSCAACAAACBDCMAQAir Quality/<strong>Transportation</strong> Sub Committee <strong>of</strong> the TAC (<strong>Rhode</strong> <strong>Island</strong>)Business Improvement DistrictBureau <strong>of</strong> <strong>Transportation</strong> StatisticsClean Air ActClean Air Act AmendmentsCentral Business DistrictCongestion Management and Air Quality (pronounced “see mac”)*CMSCNGCNUCongestion Management System*Compressed Natural GasCongress for New UrbanismCO Carbon Monoxide Environmental Protection Agency – Carbon MonoxideCONEGCoalition <strong>of</strong> Northeastern GovernorsCRMCCoastal Resources Management Council (<strong>Rhode</strong> <strong>Island</strong>)DEMDepartment <strong>of</strong> Environmental Management (<strong>Rhode</strong> <strong>Island</strong>)DMVDMSEPAEJFAAFHWAFMCSAFRAFTAGARVEEGISGO BondsHCHOVHPMSHUD<strong>Division</strong> <strong>of</strong> Motor Vehicles (<strong>Rhode</strong> <strong>Island</strong>)Dynamic Message SignsUnited <strong>State</strong>s Environmental Protection AgencyEnvironmental JusticeFederal Aviation AdministrationFederal Highway AdministrationUnited <strong>State</strong>s Federal Motor Carrier Safety AdministrationFederal Railroad AdministrationFederal Transit AdministrationGrant Anticipation Revenue VehicleGeographic Information SystemGeneral Obligation BondsHydrocarbon Environmental Protection Agency – HydrocarbonsHigh Occupancy Vehicle*Highway Performance Monitoring SystemHousing and Urban Development<strong>Transportation</strong> <strong>2035</strong> (2012 Update)<strong>State</strong> Guide Plan Element 611<strong>Rhode</strong> <strong>Island</strong> <strong>State</strong>wide <strong>Planning</strong> Program D-5
December 2012ISTEAITSJTWLOSLRPMADDMBTAMPOMSAMUTCDNAAQSNARCNCBWNCHRPNEPANETCNH 3NHSNHTSANONO 2NO XNPTSNTIO3PMRIDEMRIDOHRIDOTIntermodal Surface <strong>Transportation</strong> Act (replaced by TEA-21, which was replaced by SAFETEA-LU)Intelligent <strong>Transportation</strong> System*Journey to WorkLevel <strong>of</strong> Service*Long Range PlanMothers Against Drunk DrivingMassachusetts Bay Transit AuthorityMetropolitan <strong>Planning</strong> Organization*Metropolitan Statistical AreaManual <strong>of</strong> Uniform Traffic Control DevicesNational Ambient Air Quality StandardsNational Association <strong>of</strong> Regional CouncilsNational Center for Bicycling & WalkingNational Cooperative Highway Research ProgramNational Environmental Protection ActNew England <strong>Transportation</strong> ConsortiumAmmonia or AmmoniumNational Highway SystemNational Highway Traffic Safety AdministrationNitric OxideNitrogen Dioxide Environmental Protection agency – Nitrogen DioxideNitrogen Oxide Environmental Protection agency – Nitrogen OxideNational Personal <strong>Transportation</strong> SurveyNational Transit InstituteOzone Environmental Protection agency -- OzoneParticulate Matter. Often followed by a subscript number (usually 10 or 2.5) indicating particulatematter <strong>of</strong> a certain size in microns Environmental Protection agency – Particulate Matter<strong>Rhode</strong> <strong>Island</strong> Department <strong>of</strong> Environmental Management<strong>Rhode</strong> <strong>Island</strong> Department <strong>of</strong> Health<strong>Rhode</strong> <strong>Island</strong> Department <strong>of</strong> <strong>Transportation</strong><strong>Transportation</strong> <strong>2035</strong> (2012 Update)<strong>State</strong> Guide Plan Element 611<strong>Rhode</strong> <strong>Island</strong> <strong>State</strong>wide <strong>Planning</strong> Program D-6
December 2012RIEDCRIEMARIGISRIPTARISMRISPPRITBAROWRPASCORPSCPWGSIPSO 2SO 3SOVSO XSRTSSTPSTIPSTPPSTRAHNETT2TACTDMTEA-21TIPTMCTOD<strong>Rhode</strong> <strong>Island</strong> Economic Development Corporation<strong>Rhode</strong> <strong>Island</strong> Emergency Management Agency<strong>Rhode</strong> <strong>Island</strong> Geographic Information System<strong>Rhode</strong> <strong>Island</strong> Public Transit Authority<strong>Rhode</strong> <strong>Island</strong> state model<strong>Rhode</strong> <strong>Island</strong> <strong>State</strong>wide <strong>Planning</strong> Program<strong>Rhode</strong> <strong>Island</strong> Turnpike and Bridge AuthorityRight <strong>of</strong> WayRegional <strong>Planning</strong> Authorities<strong>State</strong> Comprehensive Outdoor Recreational PlanSafety Conscious <strong>Planning</strong> Working Group (a TRB group) now known as the <strong>Transportation</strong>Safety <strong>Planning</strong> Working Group (TSPWG),<strong>State</strong> Implementation Plan for Air Quality*Sulfur Dioxide Environmental Protection Agency – Sulfur DioxideSulfur TrioxideSingle Occupancy VehicleSulfur Oxide Environmental Protection Agency – Sulfur OxideSafe Routes to SchoolSurface <strong>Transportation</strong> Plan<strong>State</strong> <strong>Transportation</strong> Improvement ProgramSurface <strong>Transportation</strong> Policy PartnershipStrategic Highway NetworkTechnology Transfer<strong>Transportation</strong> Advisory Committee (<strong>Rhode</strong> <strong>Island</strong>)*Travel Demand Model<strong>Transportation</strong> Efficiency Act for the 21st Century (Replaced by SAFETEA-LU)<strong>Transportation</strong> Improvement Program*<strong>Transportation</strong> Management CenterTransit Oriented Development*<strong>Transportation</strong> <strong>2035</strong> (2012 Update)<strong>State</strong> Guide Plan Element 611<strong>Rhode</strong> <strong>Island</strong> <strong>State</strong>wide <strong>Planning</strong> Program D-7
December 2012TRBTSDTSPWGTTIURITCUSDOTUVVMSVMTVOC<strong>Transportation</strong> Research BoardTransit Service District<strong>Transportation</strong> Safety <strong>Planning</strong> Working GroupTexas <strong>Transportation</strong> InstituteUniversity <strong>of</strong> <strong>Rhode</strong> <strong>Island</strong> <strong>Transportation</strong> CenterUnited <strong>State</strong>s Department <strong>of</strong> <strong>Transportation</strong>Ultraviolet Radiation Environmental Protection Agency Ultraviolet RadiationVariable Message SignsVehicle Miles <strong>of</strong> Travel *Volatile Organic Compounds Environmental Protection Agency VOCLINKSHURRICANE EVACUATION MAPShttp://www.riema.ri.gov/hazards/hurricane_evac.phpHAZARD QUICK LINKShttp://www.riema.ri.gov/hazards/hurricane.phpDEM: TMDL DOCUMENTSDEM 303dhttp://www.dem.ri.gov/programs/benviron/water/quality/rest/reports.htmhttp://www.dem.ri.gov/pubs/303d/index.htm<strong>Transportation</strong> <strong>2035</strong> (2012 Update)<strong>State</strong> Guide Plan Element 611<strong>Rhode</strong> <strong>Island</strong> <strong>State</strong>wide <strong>Planning</strong> Program D-8
December 2012APPENDIX EPUBLIC REVIEW OF THE PLANConsistent with the Public Participation Guide, the Public Hearing Notice and copy <strong>of</strong> the draft Plan was mailed to the following prior to the public hearing:• <strong>Transportation</strong> Advisory Committee• Technical Committee• <strong>State</strong> <strong>Planning</strong> CouncilThe Public Hearing Notice was mailed to the following on October 12, 2012:• Town Planners• Chief Elected Officials (cities and towns)• Public Works Directors• Council Presidents• <strong>Transportation</strong> List• <strong>Transportation</strong> Providers• General Assembly leadership• Congressional Delegation• Social Advocacy Groups• Public Hearing ListThe Public Notice was also e-mailed to the <strong>Rhode</strong> <strong>Island</strong> <strong>State</strong>wide <strong>Planning</strong> e-News list and the Environmental Justice list. It was also posted atwww.planning.ri.gov for 34 days.The following items are included in the Appendix.• Public Notice, published in the Providence Journal on Friday, October 12, 2012• Summary <strong>of</strong> comments received and responses to commentsThe full public hearing report, including all written comments, is on file at the <strong>Rhode</strong> <strong>Island</strong> <strong>State</strong>wide <strong>Planning</strong> Program <strong>of</strong>fice.<strong>Transportation</strong> <strong>2035</strong> (2012 Update)<strong>State</strong> Guide Plan Element 611<strong>Rhode</strong> <strong>Island</strong> <strong>State</strong>wide <strong>Planning</strong> Program E-1
MAPS
December 2012MAP 1-1 REGIONAL MAP<strong>Transportation</strong> <strong>2035</strong> (2012 Update)<strong>State</strong> Guide Plan Element 611RI <strong>State</strong>wide <strong>Planning</strong> Program
December 2012MAP 1-2 STATE LAND USE PLAN<strong>Transportation</strong> <strong>2035</strong> (2012 Update)<strong>State</strong> Guide Plan Element 611RI <strong>State</strong>wide <strong>Planning</strong> Program
December 2012MAP 1-3 HURRICANE EVACUATION ROUTES, 2008<strong>Transportation</strong> <strong>2035</strong> (2012 Update)<strong>State</strong> Guide Plan Element 611RI <strong>State</strong>wide <strong>Planning</strong> Program
December 2012MAP 1-4 EMPLOYMENT SHIFT BY PLACE OF WORK, 2000-2012IncreaseIncreaseIncreaseIncrease<strong>Transportation</strong> <strong>2035</strong> (2012 Update)<strong>State</strong> Guide Plan Element 611RI <strong>State</strong>wide <strong>Planning</strong> Program
MAP 1-5 POPULATION CHANGE, 2000-2010December 2012IncreaseIncreaseIncreaseIncreaseIncreaseIncreaseIncreaseIncrease<strong>Transportation</strong> <strong>2035</strong> (2012 Update)<strong>State</strong> Guide Plan Element 611RI <strong>State</strong>wide <strong>Planning</strong> Program
December 2012MAP 1-6 CENSUS TRACT MEAN TRAVEL TIME TO WORK, 2010<strong>Transportation</strong> <strong>2035</strong> (2012 Update)<strong>State</strong> Guide Plan Element 611RI <strong>State</strong>wide <strong>Planning</strong> Program
December 2012MAP 1-7 CONGESTED HIGHWAYS 2012<strong>Transportation</strong> <strong>2035</strong> (2012 Update)<strong>State</strong> Guide Plan Element 611RI <strong>State</strong>wide <strong>Planning</strong> Program
December 2012MAP 1-8 CONGESTED HIGHWAYS <strong>2035</strong><strong>Transportation</strong> <strong>2035</strong> (2012 Update)<strong>State</strong> Guide Plan Element 611RI <strong>State</strong>wide <strong>Planning</strong> Program
December 2012MAP 2-1 TRANSPORTATION FACILITIES SYSTEM MAP, 2012<strong>Transportation</strong> <strong>2035</strong> (2012 Update)<strong>State</strong> Guide Plan Element 611RI <strong>State</strong>wide <strong>Planning</strong> Program
December 2012MAP 2-2 SOUTHERN NEW ENGLAND FREIGHT LINES, 2008<strong>Transportation</strong> <strong>2035</strong> (2012 Update)<strong>State</strong> Guide Plan Element 611RI <strong>State</strong>wide <strong>Planning</strong> Program
December 2012MAP 4-1 WATER SUPPLY AND WELLHEAD PROTECTION AREAS, 2008<strong>Transportation</strong> <strong>2035</strong> (2012 Update)<strong>State</strong> Guide Plan Element 611RI <strong>State</strong>wide <strong>Planning</strong> Program
December 2012MAP 4-2 WETLANDS, 2008<strong>Transportation</strong> <strong>2035</strong> (2012 Update)<strong>State</strong> Guide Plan Element 611RI <strong>State</strong>wide <strong>Planning</strong> Program
December 2012MAP 4-3 RARE SPECIES HABITATS, 2008<strong>Transportation</strong> <strong>2035</strong> (2012 Update)<strong>State</strong> Guide Plan Element 611RI <strong>State</strong>wide <strong>Planning</strong> Program
December 2012MAP 4-3 PROTECTED CONSERVATION AND PARK LANDS, 2008<strong>Transportation</strong> <strong>2035</strong> (2012 Update)<strong>State</strong> Guide Plan Element 611RI <strong>State</strong>wide <strong>Planning</strong> Program
MAP 4-5 DESIGNATED SCENIC AREAS, 2008December 2012<strong>Transportation</strong> <strong>2035</strong> (2012 Update)<strong>State</strong> Guide Plan Element 611RI <strong>State</strong>wide <strong>Planning</strong> Program
MAP 4-6 HISTORIC SITES AND DISTRICTS, 2008December 2012<strong>Transportation</strong> <strong>2035</strong> (2012 Update)<strong>State</strong> Guide Plan Element 611RI <strong>State</strong>wide <strong>Planning</strong> Program
December 2012MAP 4-7 ROADS THREATENED BY DAM FAILURE, 2008<strong>Transportation</strong> <strong>2035</strong> (2012 Update)<strong>State</strong> Guide Plan Element 611RI <strong>State</strong>wide <strong>Planning</strong> Program
MAP 4-8 SEA LEVEL RISE (1-3 METERS), 2008December 2012<strong>Transportation</strong> <strong>2035</strong> (2012 Update)<strong>State</strong> Guide Plan Element 611RI <strong>State</strong>wide <strong>Planning</strong> Program
December 2012MAP 4-9A MINORITY POPULATION PERCENTAGE, 2010<strong>Transportation</strong> <strong>2035</strong> (2012 Update)<strong>State</strong> Guide Plan Element 611RI <strong>State</strong>wide <strong>Planning</strong> Program
December 2012MAP 4-9 HISPANIC POPULATION, 2010<strong>Transportation</strong> <strong>2035</strong> (2012 Update)<strong>State</strong> Guide Plan Element 611RI <strong>State</strong>wide <strong>Planning</strong> Program
December 2012MAP 4-10 AFRICAN AMERICAN POPULATION, 2010<strong>Transportation</strong> <strong>2035</strong> (2012 Update)<strong>State</strong> Guide Plan Element 611RI <strong>State</strong>wide <strong>Planning</strong> Program
December 2012MAP 4-11 ASIAN POPULATION, 2010<strong>Transportation</strong> <strong>2035</strong> (2012 Update)<strong>State</strong> Guide Plan Element 611RI <strong>State</strong>wide <strong>Planning</strong> Program
December 2012MAP 4-12 AMERICAN INDIAN POPULATION, 2010<strong>Transportation</strong> <strong>2035</strong> (2012 Update)<strong>State</strong> Guide Plan Element 611RI <strong>State</strong>wide <strong>Planning</strong> Program
MAP 4-13 LOW INCOME POPULATION, 2010December 2012<strong>Transportation</strong> <strong>2035</strong> (2012 Update)<strong>State</strong> Guide Plan Element 611RI <strong>State</strong>wide <strong>Planning</strong> Program
December 2012MAP 4-14 DISABLED POPULATION, 2000<strong>Transportation</strong> <strong>2035</strong> (2012 Update)<strong>State</strong> Guide Plan Element 611RI <strong>State</strong>wide <strong>Planning</strong> Program
December 2012MAP 4-15 ENVIRONMENTAL JUSTICE POPULATIONS AND SCHOOLS WITHIN 250’ OF INTERSTATESAND HIGHWAYS, 2010<strong>Transportation</strong> <strong>2035</strong> (2012 Update)<strong>State</strong> Guide Plan Element 611RI <strong>State</strong>wide <strong>Planning</strong> Program
December 2012MAP 4-16 CASE STUDY: MINORITY POPULATIONS WITHIN ¼ MILE OF RIPTA SERVICE AREA, 2010<strong>Transportation</strong> <strong>2035</strong> (2012 Update)<strong>State</strong> Guide Plan Element 611RI <strong>State</strong>wide <strong>Planning</strong> Program
December 2012MAP 5-1 FUTURE TRANSPORTATION SYSTEM “SWIM SCENARIO” 2008<strong>Transportation</strong> <strong>2035</strong> (2012 Update)<strong>State</strong> Guide Plan Element 611RI <strong>State</strong>wide <strong>Planning</strong> Program
December 2012FUTURE TRANSPORTATION SYSTEM “WIN SCENARIO” 2008<strong>Transportation</strong> <strong>2035</strong> (2012 Update)<strong>State</strong> Guide Plan Element 611RI <strong>State</strong>wide <strong>Planning</strong> Program
December 2012EMERGENCY RESPONSE NETWORK MAP, 2008<strong>Transportation</strong> <strong>2035</strong> (2012 Update)<strong>State</strong> Guide Plan Element 611RI <strong>State</strong>wide <strong>Planning</strong> Program
December 2012MAP 5-4 INTELLIGENT TRANSPORTATION SYSTEMS, 2012<strong>Transportation</strong> <strong>2035</strong> (2012 Update)<strong>State</strong> Guide Plan Element 611RI <strong>State</strong>wide <strong>Planning</strong> Program