Monthly Scorecard - RBC Wealth Management USA
Monthly Scorecard - RBC Wealth Management USA
Monthly Scorecard - RBC Wealth Management USA

Create successful ePaper yourself
Turn your PDF publications into a flip-book with our unique Google optimized e-Paper software.
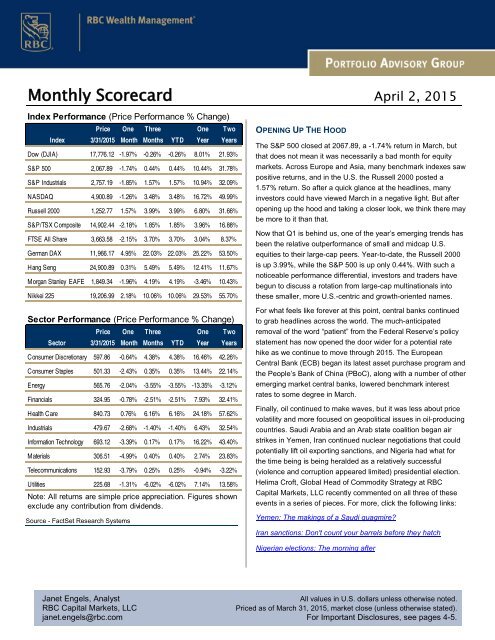
<strong>Monthly</strong> <strong>Scorecard</strong> April 2, 2015<br />
Index Performance (Price Performance % Change)<br />
Price One Three One Two<br />
Index 3/31/2015 Month Months YTD Year Years<br />
Dow (DJIA) 17,776.12 -1.97% -0.26% -0.26% 8.01% 21.93%<br />
S&P 500 2,067.89 -1.74% 0.44% 0.44% 10.44% 31.78%<br />
S&P Industrials 2,757.19 -1.85% 1.57% 1.57% 10.94% 32.09%<br />
NASDAQ 4,900.89 -1.26% 3.48% 3.48% 16.72% 49.99%<br />
Russell 2000 1,252.77 1.57% 3.99% 3.99% 6.80% 31.66%<br />
S&P/TSX Composite 14,902.44 -2.18% 1.85% 1.85% 3.96% 16.88%<br />
FTSE All Share 3,663.58 -2.15% 3.70% 3.70% 3.04% 8.37%<br />
German DAX 11,966.17 4.95% 22.03% 22.03% 25.22% 53.50%<br />
Hang Seng 24,900.89 0.31% 5.49% 5.49% 12.41% 11.67%<br />
Morgan Stanley EAFE 1,849.34 -1.96% 4.19% 4.19% -3.46% 10.43%<br />
Nikkei 225 19,206.99 2.18% 10.06% 10.06% 29.53% 55.70%<br />
OPENING UP THE HOOD<br />
The S&P 500 closed at 2067.89, a -1.74% return in March, but<br />
that does not mean it was necessarily a bad month for equity<br />
markets. Across Europe and Asia, many benchmark indexes saw<br />
positive returns, and in the U.S. the Russell 2000 posted a<br />
1.57% return. So after a quick glance at the headlines, many<br />
investors could have viewed March in a negative light. But after<br />
opening up the hood and taking a closer look, we think there may<br />
be more to it than that.<br />
Now that Q1 is behind us, one of the year’s emerging trends has<br />
been the relative outperformance of small and midcap U.S.<br />
equities to their large-cap peers. Year-to-date, the Russell 2000<br />
is up 3.99%, while the S&P 500 is up only 0.44%. With such a<br />
noticeable performance differential, investors and traders have<br />
begun to discuss a rotation from large-cap multinationals into<br />
these smaller, more U.S.-centric and growth-oriented names.<br />
Sector Performance (Price Performance % Change)<br />
Price One Three One Two<br />
Sector 3/31/2015 Month Months YTD Year Years<br />
Consumer Discretionary 597.86 -0.64% 4.38% 4.38% 16.46% 42.26%<br />
Consumer Staples 501.33 -2.43% 0.35% 0.35% 13.44% 22.14%<br />
Energy 565.76 -2.04% -3.55% -3.55% -13.35% -3.12%<br />
Financials 324.95 -0.78% -2.51% -2.51% 7.93% 32.41%<br />
Health Care 840.73 0.76% 6.16% 6.16% 24.18% 57.62%<br />
Industrials 479.67 -2.68% -1.40% -1.40% 6.43% 32.54%<br />
Information Technology 693.12 -3.39% 0.17% 0.17% 16.22% 43.40%<br />
Materials 306.51 -4.99% 0.40% 0.40% 2.74% 23.83%<br />
Telecommunications 152.93 -3.79% 0.25% 0.25% -0.94% -3.22%<br />
Utilities 225.68 -1.31% -6.02% -6.02% 7.14% 13.58%<br />
Note: All returns are simple price appreciation. Figures shown<br />
exclude any contribution from dividends.<br />
Source - FactSet Research Systems<br />
For what feels like forever at this point, central banks continued<br />
to grab headlines across the world. The much-anticipated<br />
removal of the word “patient” from the Federal Reserve’s policy<br />
statement has now opened the door wider for a potential rate<br />
hike as we continue to move through 2015. The European<br />
Central Bank (ECB) began its latest asset purchase program and<br />
the People’s Bank of China (PBoC), along with a number of other<br />
emerging market central banks, lowered benchmark interest<br />
rates to some degree in March.<br />
Finally, oil continued to make waves, but it was less about price<br />
volatility and more focused on geopolitical issues in oil-producing<br />
countries. Saudi Arabia and an Arab state coalition began air<br />
strikes in Yemen, Iran continued nuclear negotiations that could<br />
potentially lift oil exporting sanctions, and Nigeria had what for<br />
the time being is being heralded as a relatively successful<br />
(violence and corruption appeared limited) presidential election.<br />
Helima Croft, Global Head of Commodity Strategy at <strong>RBC</strong><br />
Capital Markets, LLC recently commented on all three of these<br />
events in a series of pieces. For more, click the following links:<br />
Yemen: The makings of a Saudi quagmire?<br />
Iran sanctions: Don't count your barrels before they hatch<br />
Nigerian elections: The morning after<br />
Janet Engels, Analyst<br />
All values in U.S. dollars unless otherwise noted.<br />
<strong>RBC</strong> Capital Markets, LLC<br />
Priced as of March 31, 2015, market close (unless otherwise stated).<br />
janet.engels@rbc.com For Important Disclosures, see pages 4-5.
PORTFOLIO ADVISORY GROUP<br />
MONTHLY SCORECARD<br />
Chart of the Month: We have to go back to Q4 2012 to find a quarter that finished in the red. With the<br />
0.44% return over the last three months, we have now tacked on the ninth-consecutive quarter of<br />
positive returns for the S&P 500. This marks the index’s second-longest winning streak, only behind the<br />
14 consecutive quarters from Q4 1994 to Q2 1998.<br />
Consecutive Quarters of Positive Returns (S&P 500)<br />
16<br />
14<br />
14<br />
12<br />
10<br />
9<br />
8<br />
6<br />
4<br />
2<br />
1<br />
2 2<br />
4<br />
2<br />
1<br />
3<br />
2<br />
1 1 1<br />
5<br />
1<br />
4<br />
5<br />
4<br />
3<br />
2<br />
1<br />
0<br />
Q2<br />
90<br />
Q1<br />
91<br />
Q4<br />
91<br />
Q1<br />
93<br />
Q4<br />
93<br />
Q3<br />
94<br />
Q2<br />
98<br />
Q2<br />
99<br />
Q1<br />
00<br />
Q2<br />
01<br />
Q4<br />
01<br />
Q4<br />
02<br />
Q2<br />
04<br />
Q4<br />
04<br />
Q1<br />
06<br />
Q3<br />
07<br />
Q1<br />
10<br />
Q1<br />
11<br />
Q1<br />
12<br />
Q3<br />
12<br />
Q1<br />
15<br />
Source - <strong>RBC</strong> <strong>Wealth</strong> <strong>Management</strong>, Bloomberg; data through 3/31/15<br />
March-at-a-Glance (S&P 500)<br />
2,125<br />
2,100<br />
3/16 The euro fell to 1.0458<br />
against the dollar, the lowest<br />
level since January 2003.<br />
3/31 Kraft Foods<br />
and H.J. Heinz<br />
announced $55B<br />
merger.<br />
2,075<br />
2/27 S&P 500<br />
closed at 2104.50.<br />
2,050<br />
3/18 The Fed dropped<br />
the word "patient" from<br />
its policy statement,<br />
opening the door for an<br />
interest rate hike in the<br />
future.<br />
3/6 U.S. payrolls increased<br />
295K and unemployment<br />
dropped to 5.5%, the lowest<br />
level since May 2008.<br />
2,025<br />
Feb 27 Mar 06 Mar 13 Mar 20 Mar 27<br />
Source - Bloomberg, <strong>RBC</strong> <strong>Wealth</strong> <strong>Management</strong>, data through 3/31/15<br />
3/31 S&P 500<br />
closed at 2067.89,<br />
-1.74%.<br />
APRIL 2, 2015 PAGE 2
PORTFOLIO ADVISORY GROUP<br />
MONTHLY SCORECARD<br />
World Markets – March Month-over-Month and Year-to-Date Performance<br />
Mexico<br />
BOLSA<br />
M/M: -1.05%<br />
YTD: +1.34%<br />
Canada<br />
S&P/TSX<br />
M/M: -2.18%<br />
YTD: +1.85%<br />
U.S.<br />
S&P 500<br />
M/M: -1.74%<br />
YTD: +0.44%<br />
France<br />
CAC 40<br />
M/M: +1.66%<br />
YTD: +17.81%<br />
Brazil<br />
Bovespa<br />
M/M: -0.84%<br />
YTD: +2.29%<br />
U.K.<br />
FTSE All-Share<br />
M/M: -2.15%<br />
YTD: +3.70%<br />
Spain<br />
IBEX 35<br />
M/M: +3.07%<br />
YTD: +12.08%<br />
Germany<br />
DAX<br />
M/M: +4.95%<br />
YTD: +22.03%<br />
India<br />
Sensex<br />
M/M: -4.32%<br />
YTD: +1.67%<br />
China<br />
Shanghai<br />
M/M: +13.22%<br />
YTD: +15.87%<br />
Russia<br />
MICEX<br />
M/M: -7.55%<br />
YTD: +16.44%<br />
Hong Kong<br />
Hang Seng<br />
M/M: +0.31%<br />
YTD: +5.49%<br />
Japan<br />
Nikkei 225<br />
M/M: +2.18%<br />
YTD: +10.06%<br />
South Korea<br />
KRX100<br />
M/M: +1.42%<br />
YTD: +4.19%<br />
Australia<br />
S&P/ASX 200<br />
M/M: -0.63%<br />
YTD: +8.88%<br />
Source - FactSet Research Systems, <strong>RBC</strong> <strong>Wealth</strong> <strong>Management</strong>, 3/31/15<br />
APRIL 2, 2015 PAGE 3
PORTFOLIO ADVISORY GROUP<br />
MONTHLY SCORECARD<br />
Analyst Certification<br />
All of the views expressed in this report accurately reflect the personal views of the responsible analyst(s) about any and all<br />
of the subject securities or issuers. No part of the compensation of the responsible analyst(s) named herein is, or will be,<br />
directly or indirectly, related to the specific recommendations or views expressed by the responsible analyst(s) in this report.<br />
Important Disclosures<br />
In the U.S., <strong>RBC</strong> <strong>Wealth</strong> <strong>Management</strong> operates as a division of <strong>RBC</strong> Capital Markets, LLC. In Canada, <strong>RBC</strong> <strong>Wealth</strong><br />
<strong>Management</strong> includes, without limitation, <strong>RBC</strong> Dominion Securities Inc., which is a foreign affiliate of <strong>RBC</strong> Capital<br />
Markets, LLC. This report has been prepared by <strong>RBC</strong> Capital Markets, LLC., which is an indirect wholly-owned<br />
subsidiary of the Royal Bank of Canada and, as such, is a related issuer of Royal Bank of Canada.<br />
In the event that this is a compendium report (covers six or more companies), <strong>RBC</strong> <strong>Wealth</strong> <strong>Management</strong> may choose to<br />
provide important disclosure information by reference. To access current disclosures, clients should refer to<br />
http://www.rbccm.com/GLDisclosure/PublicWeb/DisclosureLookup.aspx?EntityID=2 to view disclosures regarding <strong>RBC</strong><br />
<strong>Wealth</strong> <strong>Management</strong> and its affiliated firms. Such information is also available upon request to <strong>RBC</strong> <strong>Wealth</strong> <strong>Management</strong><br />
Publishing, 60 South Sixth St, Minneapolis, MN 55402.<br />
References to a Recommended List in the recommendation history chart may include one or more recommended lists or<br />
model portfolios maintained by <strong>RBC</strong> <strong>Wealth</strong> <strong>Management</strong> or one of its affiliates. <strong>RBC</strong> <strong>Wealth</strong> <strong>Management</strong> recommended<br />
lists include the Guided Portfolio: Prime Income (RL 6), the Guided Portfolio: Large Cap (RL 7), the Guided Portfolio:<br />
Dividend Growth (RL 8), the Guided Portfolio: Midcap 111 (RL 9), the Guided Portfolio: ADR (RL 10), and the Guided<br />
Portfolio: Global Equity (U.S.) (RL 11). <strong>RBC</strong> Capital Markets recommended lists include the Strategy Focus List and the<br />
Fundamental Equity Weightings (FEW) portfolios. The abbreviation 'RL On' means the date a security was placed on a<br />
Recommended List. The abbreviation 'RL Off' means the date a security was removed from a Recommended List.<br />
Distribution of Ratings<br />
For the purpose of ratings distributions, regulatory rules require member firms to assign ratings to one of three rating<br />
categories - Buy, Hold/Neutral, or Sell - regardless of a firm's own rating categories. Although <strong>RBC</strong> Capital Markets, LLC<br />
ratings of Top Pick (TP)/Outperform (O), Sector Perform (SP), and Underperform (U) most closely correspond to Buy,<br />
Hold/Neutral and Sell, respectively, the meanings are not the same because our ratings are determined on a relative basis<br />
(as described below).<br />
Distribution of Ratings - <strong>RBC</strong> Capital Markets, LLC Equity Research<br />
As of March 31, 2015<br />
Investment Banking Services<br />
Provided During Past 12 Months<br />
Rating Count Percent Count Percent<br />
Buy [Top Pick & Outperform] 909 52.33 280 30.80<br />
Hold [Sector Perform] 713 41.05 125 17.53<br />
Sell [Underperform] 115 6.62 5 4.35<br />
Explanation of <strong>RBC</strong> Capital Markets, LLC Equity Rating System<br />
An analyst's "sector" is the universe of companies for which the analyst provides research coverage. Accordingly, the rating<br />
assigned to a particular stock represents solely the analyst's view of how that stock will perform over the next 12 months<br />
relative to the analyst's sector average. Although <strong>RBC</strong> Capital Markets, LLC ratings of Top Pick (TP)/Outperform (O), Sector<br />
Perform (SP), and Underperform (U) most closely correspond to Buy, Hold/Neutral and Sell, respectively, the meanings are<br />
not the same because our ratings are determined on a relative basis (as described below).<br />
Ratings<br />
Top Pick (TP): Represents analyst’s best idea in the sector; expected to provide significant absolute total return over 12<br />
months with a favorable risk-reward ratio.<br />
Outperform (O): Expected to materially outperform sector average over 12 months.<br />
Sector Perform (SP): Returns expected to be in line with sector average over 12 months.<br />
Underperform (U): Returns expected to be materially below sector average over 12 months.<br />
Risk Rating<br />
As of March 31, 2013, <strong>RBC</strong> Capital Markets, LLC suspends its Average and Above Average risk ratings. The Speculative<br />
risk rating reflects a security's lower level of financial or operating predictability, illiquid share trading volumes, high balance<br />
sheet leverage, or limited operating history that result in a higher expectation of financial and/or stock price volatility.<br />
APRIL 2, 2015 PAGE 4
PORTFOLIO ADVISORY GROUP<br />
MONTHLY SCORECARD<br />
Valuation and Price Target Impediments<br />
When <strong>RBC</strong> Capital Markets, LLC assigns a value to a company in a research report, FINRA Rules and NYSE Rules (as<br />
incorporated into the FINRA Rulebook) require that the basis for the valuation and the impediments to obtaining that<br />
valuation be described. Where applicable, this information is included in the text of our research in the sections entitled<br />
"Valuation" and "Price Target Impediment", respectively.<br />
The analyst(s) responsible for preparing this research report received compensation that is based upon various factors,<br />
including total revenues of <strong>RBC</strong> Capital Markets, LLC, and its affiliates, a portion of which are or have been generated by<br />
investment banking activities of the member companies of <strong>RBC</strong> Capital Markets, LLC and its affiliates.<br />
Other Disclosures<br />
Prepared with the assistance of our national research sources. <strong>RBC</strong> <strong>Wealth</strong> <strong>Management</strong> prepared this report and takes sole<br />
responsibility for its content and distribution. The content may have been based, at least in part, on material provided by our<br />
third-party correspondent research services. Our third-party correspondent has given <strong>RBC</strong> <strong>Wealth</strong> <strong>Management</strong> general<br />
permission to use its research reports as source materials, but has not reviewed or approved this report, nor has it been<br />
informed of its publication. Our third-party correspondent may from time to time have long or short positions in, effect<br />
transactions in, and make markets in securities referred to herein. Our third-party correspondent may from time to time<br />
perform investment banking or other services for, or solicit investment banking or other business from, any company<br />
mentioned in this report.<br />
<strong>RBC</strong> <strong>Wealth</strong> <strong>Management</strong> endeavors to make all reasonable efforts to provide research simultaneously to all eligible clients,<br />
having regard to local time zones in overseas jurisdictions. In certain investment advisory accounts, <strong>RBC</strong> <strong>Wealth</strong><br />
<strong>Management</strong> will act as overlay manager for our clients and will initiate transactions in the securities referenced herein for<br />
those accounts upon receipt of this report. These transactions may occur before or after your receipt of this report and may<br />
have a short-term impact on the market price of the securities in which transactions occur. <strong>RBC</strong> <strong>Wealth</strong> <strong>Management</strong><br />
research is posted to our proprietary Web sites to ensure eligible clients receive coverage initiations and changes in rating,<br />
targets, and opinions in a timely manner. Additional distribution may be done by sales personnel via e-mail, fax, or regular<br />
mail. Clients may also receive our research via third-party vendors. Please contact your <strong>RBC</strong> <strong>Wealth</strong> <strong>Management</strong> Financial<br />
Advisor for more information regarding <strong>RBC</strong> <strong>Wealth</strong> <strong>Management</strong> research.<br />
Conflicts Disclosure: <strong>RBC</strong> <strong>Wealth</strong> <strong>Management</strong> is registered with the Securities and Exchange Commission as a<br />
broker/dealer and an investment adviser, offering both brokerage and investment advisory services. <strong>RBC</strong> <strong>Wealth</strong><br />
<strong>Management</strong>’s Policy for Managing Conflicts of Interest in Relation to Investment Research is available from us on our<br />
website at http://www.rbccm.com/GLDisclosure/PublicWeb/DisclosureLookup.aspx?EntityID=2. Conflicts of interests related<br />
to our investment advisory business can be found in Part II of the Firm’s Form ADV or the Investment Advisor Group<br />
Disclosure Document. Copies of any of these documents are available upon request through your Financial Advisor. We<br />
reserve the right to amend or supplement this policy, Part II of the ADV, or Disclosure Document at any time.<br />
The author(s) is/are employed by <strong>RBC</strong> <strong>Wealth</strong> <strong>Management</strong>, a division of <strong>RBC</strong> Capital Markets, LLC, a securities brokerdealer<br />
with principal offices located in Minnesota and New York, <strong>USA</strong>.<br />
The Global Industry Classification Standard (“GICS”) was developed by and is the exclusive property and a service mark of MSCI Inc. (“MSCI”) and<br />
Standard & Poor’s Financial Services LLC (“S&P”) and is licensed for use by <strong>RBC</strong>. Neither MSCI, S&P, nor any other party involved in making or<br />
compiling the GICS or any GICS classifications makes any express or implied warranties or representations with respect to such standard or<br />
classification (or the results to be obtained by the use thereof), and all such parties hereby expressly disclaim all warranties of originality, accuracy,<br />
completeness, merchantability and fitness for a particular purpose with respect to any of such standard or classification. Without limiting any of the<br />
foregoing, in no event shall MSCI, S&P, any of their affiliates or any third party involved in making or compiling the GICS or any GICS classifications<br />
have any liability for any direct, indirect, special, punitive, consequential or any other damages (including lost profits) even if notified of the possibility<br />
of such damages.<br />
Disclaimer<br />
The information contained in this report has been compiled by <strong>RBC</strong> <strong>Wealth</strong> <strong>Management</strong>, a division of <strong>RBC</strong> Capital Markets, LLC, from sources believed to be<br />
reliable, but no representation or warranty, express or implied, is made by Royal Bank of Canada, <strong>RBC</strong> <strong>Wealth</strong> <strong>Management</strong>, its affiliates or any other person as<br />
to its accuracy, completeness or correctness. All opinions and estimates contained in this report constitute <strong>RBC</strong> <strong>Wealth</strong> <strong>Management</strong>'s judgment as of the date<br />
of this report, are subject to change without notice and are provided in good faith but without legal responsibility. Past performance is not a guide to future<br />
performance, future returns are not guaranteed, and a loss of original capital may occur. Every province in Canada, state in the U.S., and most countries<br />
throughout the world have their own laws regulating the types of securities and other investment products which may be offered to their residents, as well as the<br />
process for doing so. As a result, the securities discussed in this report may not be eligible for sale in some jurisdictions. This report is not, and under no<br />
circumstances should be construed as, a solicitation to act as securities broker or dealer in any jurisdiction by any person or company that is not legally permitted<br />
to carry on the business of a securities broker or dealer in that jurisdiction. Nothing in this report constitutes legal, accounting or tax advice or individually tailored<br />
investment advice. This material is prepared for general circulation to clients, including clients who are affiliates of <strong>RBC</strong> <strong>Wealth</strong> <strong>Management</strong>, and does not have<br />
regard to the particular circumstances or needs of any specific person who may read it. The investments or services contained in this report may not be suitable<br />
for you and it is recommended that you consult an independent investment advisor if you are in doubt about the suitability of such investments or services. To<br />
the full extent permitted by law neither <strong>RBC</strong> <strong>Wealth</strong> <strong>Management</strong> nor any of its affiliates, nor any other person, accepts any liability whatsoever for any direct or<br />
consequential loss arising from any use of this report or the information contained herein. No matter contained in this document may be reproduced or copied by<br />
any means without the prior consent of <strong>RBC</strong> <strong>Wealth</strong> <strong>Management</strong>. In the U.S., <strong>RBC</strong> <strong>Wealth</strong> <strong>Management</strong> operates as a division of <strong>RBC</strong> Capital Markets, LLC. In<br />
Canada, <strong>RBC</strong> <strong>Wealth</strong> <strong>Management</strong> includes, without limitation, <strong>RBC</strong> Dominion Securities Inc., which is a foreign affiliate of <strong>RBC</strong> Capital Markets, LLC. This<br />
report has been prepared by <strong>RBC</strong> Capital Markets, LLC. Additional information available upon request. Copyright © <strong>RBC</strong> Capital Markets, LLC, 2015 - Member<br />
NYSE/FINRA/SIPC. All rights reserved.