Global Roundup - RBC Wealth Management
Global Roundup - RBC Wealth Management
Global Roundup - RBC Wealth Management

You also want an ePaper? Increase the reach of your titles
YUMPU automatically turns print PDFs into web optimized ePapers that Google loves.
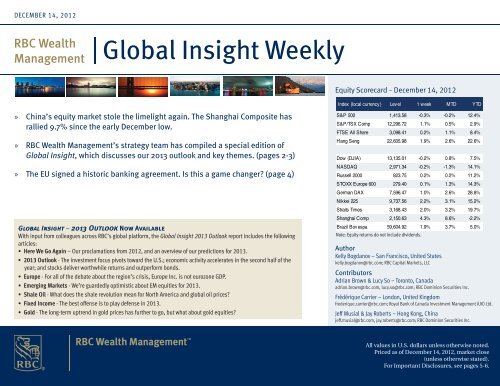
DECEMBER 14, 2012<br />
<strong>RBC</strong> <strong>Wealth</strong><br />
<strong>Management</strong><br />
<strong>Global</strong> Insight Weekly<br />
» China’s equity market stole the limelight again. The Shanghai Composite has<br />
rallied 9.7% since the early December low.<br />
» <strong>RBC</strong> <strong>Wealth</strong> <strong>Management</strong>’s strategy team has compiled a special edition of<br />
<strong>Global</strong> Insight, which discusses our 2013 outlook and key themes. (pages 2-3)<br />
» The EU signed a historic banking agreement. Is this a game changer? (page 4)<br />
<strong>Global</strong> Insight – 2013 Outlook Now Available<br />
With input from colleagues across <strong>RBC</strong>’s global platform, the <strong>Global</strong> Insight 2013 Outlook report includes the following<br />
articles:<br />
• Here We Go Again – Our proclamations from 2012, and an overview of our predictions for 2013.<br />
• 2013 Outlook - The investment focus pivots toward the U.S.; economic activity accelerates in the second half of the<br />
year; and stocks deliver worthwhile returns and outperform bonds.<br />
• Europe - For all of the debate about the region’s crisis, Europe Inc. is not eurozone GDP.<br />
• Emerging Markets - We’re guardedly optimistic about EM equities for 2013.<br />
• Shale Oil - What does the shale revolution mean for North America and global oil prices?<br />
• Fixed Income - The best offense is to play defense in 2013.<br />
• Gold - The long-term uptrend in gold prices has further to go, but what about gold equities?<br />
Equity Scorecard – December 14, 2012<br />
Index (local currency) Level 1 week MTD YTD<br />
S&P 500 1,413.58 -0.3% -0.2% 12.4%<br />
S&P/TSX Comp 12,296.72 1.1% 0.5% 2.9%<br />
FTSE All Share 3,098.41 0.2% 1.1% 8.4%<br />
Hang Seng 22,605.98 1.9% 2.6% 22.6%<br />
Dow (DJIA) 13,135.01 -0.2% 0.8% 7.5%<br />
NASDAQ 2,971.34 -0.2% -1.3% 14.1%<br />
Russell 2000 823.75 0.2% 0.2% 11.2%<br />
STOXX Europe 600 279.40 0.1% 1.3% 14.3%<br />
German DAX 7,596.47 1.0% 2.6% 28.8%<br />
Nikkei 225 9,737.56 2.2% 3.1% 15.2%<br />
Straits Times 3,168.43 2.0% 3.2% 19.7%<br />
Shanghai Comp 2,150.63 4.3% 8.6% -2.2%<br />
Brazil Bovespa 59,604.92 1.9% 3.7% 5.0%<br />
Note: Equity returns do not include dividends.<br />
Author<br />
Kelly Bogdanov – San Francisco, United States<br />
kelly.bogdanov@rbc.com; <strong>RBC</strong> Capital Markets, LLC<br />
Contributors<br />
Adrian Brown & Lucy So – Toronto, Canada<br />
adrian.brown@rbc.com, lucy.so@rbc.com; <strong>RBC</strong> Dominion Securities Inc.<br />
Frédérique Carrier – London, United Kingdom<br />
frederique.carrier@rbc.com; Royal Bank of Canada Investment <strong>Management</strong> (UK) Ltd.<br />
Jeff Musial & Jay Roberts – Hong Kong, China<br />
jeff.musial@rbc.com, jay.roberts@rbc.com; <strong>RBC</strong> Dominion Securities Inc.<br />
All values in U.S. dollars unless otherwise noted.<br />
Priced as of December 14, 2012, market close<br />
(unless otherwise stated).<br />
For Important Disclosures, see pages 5-6.
Market Scorecard – December 14, 2012<br />
Govt Bonds (bps chg) Yield 1 week MTD YTD<br />
US 2-Yr Tsy 0.234% -0.4 -1.2 -0.5<br />
US 10-Yr Tsy 1.702% 8.1 8.7 -17.4<br />
Canada 2-Yr 1.127% 6.1 5.9 17.1<br />
Canada 10-Yr 1.791% 8.1 9.1 -15.0<br />
UK 2-Yr 0.326% 7.2 1.1 -0.1<br />
UK 10-Yr 1.862% 11.9 8.7 -11.5<br />
Germany 2-Yr -0.043% 3.4 -5.3 -18.7<br />
Germany 10-Yr 1.348% 5.3 -3.8 -48.1<br />
Commodities (USD) Price 1 week MTD YTD<br />
Gold (spot $/oz) 1,695.30 -0.5% -1.1% 8.4%<br />
Silver (spot $/oz) 32.24 -2.5% -3.5% 15.8%<br />
Copper ($/ton) 8,052.00 0.5% 0.9% 6.1%<br />
Oil (WTI spot/bbl) 86.73 0.9% -2.5% -12.2%<br />
Oil (Brent spot/bbl) 111.70 3.1% -1.2% 2.8%<br />
Natural Gas ($/mlnBtu) 3.15 -5.6% -9.1% 5.5%<br />
Agriculture Index 462.39 -3.0% -3.4% 6.5%<br />
Currencies Rate 1 week MTD YTD<br />
US Dollar Index 79.58 -1.0% -0.7% -0.7%<br />
CAD/USD 1.01 0.2% 0.8% 3.6%<br />
USD/CAD 0.99 -0.2% -0.8% -3.5%<br />
EUR/USD 1.32 1.8% 1.4% 1.6%<br />
GBP/USD 1.62 0.8% 0.9% 4.0%<br />
AUD/USD 1.06 0.7% 1.3% 3.5%<br />
USD/CHF 0.92 -1.8% -1.1% -2.1%<br />
USD/JPY 83.48 1.2% 1.2% 8.5%<br />
EUR/JPY 109.88 3.0% 2.6% 10.3%<br />
EUR/GBP 0.81 1.0% 0.4% -2.3%<br />
EUR/CHF 1.21 0.0% 0.2% -0.7%<br />
USD/SGD 1.22 -0.1% 0.0% -5.9%<br />
USD/CNY 6.25 0.3% 0.3% -0.8%<br />
USD/BRL 2.09 0.5% -2.3% 11.7%<br />
Source: Bloomberg. Note: Bond yields in local currencies. Copper and Agriculture<br />
Index data as of Thursday’s close. Dollar Index measures USD vs. six major<br />
currencies. Currency rates refl ect market convention (CAD/USD is the exception).<br />
Currency returns quoted in terms of the fi rst currency in each pairing.<br />
Data as of 9:31 pm GMT 12/14/12.<br />
Examples of how to interpret currency data: CAD/USD 1.01 means 1 Canadian<br />
dollar will buy 1.01 U.S. dollars. CAD/USD 3.6% return means the Canadian dollar<br />
rose 3.6% vs. the U.S. dollar year to date. USD/JPY 83.48 means 1 U.S.<br />
dollar will buy 83.48 yen. USD/JPY 8.5% return means the U.S. dollar rose 8.5%<br />
vs. the yen year to date.<br />
Markets & the Economy<br />
Equity liquidity is drying up across regions as<br />
more and more market participants take a break<br />
for the holidays. As additional portfolio managers<br />
go on vacation over the next two weeks, we expect<br />
equity volatility to increase, just like it normally<br />
does at the end of each year.<br />
One market has already experienced heightened<br />
volatility recently, but not because of the calendar.<br />
For the second-straight week China’s Shanghai<br />
Composite Index led major stock markets—only<br />
this time it surged 4.3% on Friday. While improved<br />
manufacturing data helped boost the Shanghai<br />
Composite, other factors also played a role (see<br />
page 4).<br />
The Shanghai rally took a number of North<br />
American and European cyclical stocks along<br />
with it, specifi cally steel, infrastructure, and<br />
mining equipment companies with exposure<br />
to China. The Materials sector was the bestperforming<br />
S&P 500 sector for the week, rising<br />
1.6%.<br />
In the U.S., once again there was little progress in<br />
resolving fi scal cliff provisions, yet the market gave<br />
Washington more breathing room, closing only<br />
slightly lower for the week.<br />
Federal Reserve Chairman Ben Bernanke<br />
surprised analysts by moving away from setting<br />
a time frame on the zero interest rate policy and<br />
announced specifi c economic measures that will<br />
help drive interest rate decisions (see page 3).<br />
More importantly, European Union fi nance<br />
ministers signed a deal to give the European<br />
Central Bank (ECB) supervisory powers over<br />
the region’s banks. Yet again, as often has been<br />
the case in the development of the eurozone<br />
crisis, this agreement is a positive step in the right<br />
direction, though it does not solve the issue. Key<br />
points have been left unaddressed (see page 4 for<br />
analysis).<br />
Special Report: 2013 Outlook<br />
<strong>RBC</strong> <strong>Wealth</strong> <strong>Management</strong>’s strategy team has<br />
compiled a special edition of <strong>Global</strong> Insight, which<br />
discusses our 2013 outlook in detail, as well as key<br />
themes investors should consider.<br />
<strong>RBC</strong>’s base-case forecast for 2013:<br />
The investment focus pivots toward the U.S.<br />
where economic activity accelerates in the<br />
second half of the year. China’s economy<br />
should gather momentum. These developments<br />
would have positive implications for growth in<br />
Canada, the U.K., and Europe.<br />
Stocks deliver worthwhile returns<br />
and outperform bonds. Valuations are<br />
undemanding in most markets and cheap in<br />
select Asia Pacifi c and European markets.<br />
In fi xed income, defensive positioning is<br />
our preferred strategy with an emphasis on<br />
shorter maturities, favorably mispriced sectors,<br />
selective credits, and ample liquidity.<br />
20<br />
18<br />
16<br />
14<br />
U.S. GDP is Still Well Below Potential<br />
While it should begin to catch up soon,<br />
it would take strong growth to reach potential GDP by 2017.<br />
Actual Projected<br />
Implied<br />
growth of<br />
4.4% per<br />
annum for<br />
4 years<br />
12<br />
Recession<br />
GDP<br />
10<br />
Potential GDP<br />
2000 2005 2010 2015 2020<br />
Source - <strong>RBC</strong> <strong>Wealth</strong> <strong>Management</strong>, Congressional Budget Offi ce (CBO),<br />
National Bureau of Economic Research<br />
Potential GDP is the CBO’s estimate of the output the economy would<br />
produce with a high rate of use of its capital and labor resources.<br />
1.0<br />
0.9<br />
0.8<br />
0.7<br />
0.6<br />
0.5<br />
0.4<br />
0.3<br />
0.2<br />
0.1<br />
0.0<br />
2 GLOBAL INSIGHT WEEKLY – DECEMBER 14, 2012
A great deal hinges on policy. The U.S. fi scal<br />
cliff negotiations could conclude in a way that<br />
produces more, not less, uncertainty. Separately,<br />
there is a possibility European debt and banking<br />
issues will fl are up again.<br />
<strong>RBC</strong>’s <strong>Global</strong> Insight 2013 Outlook report<br />
expands on our base-case forecast and<br />
alternative scenarios. It also includes articles<br />
about Europe, emerging market equities, the shale<br />
oil revolution, gold, and a deep analysis of fi xed<br />
income markets.<br />
Following is a brief sampling of interesting<br />
statistics and analyses in the report:<br />
<strong>Global</strong> GDP could accelerate to 3.5% in real<br />
terms in 2013 compared to just under 3% in<br />
2012. Typically, such growth is consistent with<br />
equity returns of 5%-10%.<br />
Corporate revenue growth expectations seem<br />
too cautious. 2013 consensus sales forecasts<br />
of 3.5% in the U.S. and 2.6% in Europe are<br />
well below the International Monetary Fund’s<br />
4.9% global nominal GDP forecast (includes<br />
infl ation). Normally, U.S. corporations tend<br />
to grow sales at roughly 2% above the rate of<br />
global nominal GDP growth.<br />
Canada’s GDP growth is rarely more than a<br />
fraction of a percent different from that of the<br />
U.S. and is almost always headed in the same<br />
direction. However, in recent years, the degree<br />
to which it outperforms or underperforms the<br />
U.S. has been increasingly explained by the<br />
infl uence of Chinese growth on commodity<br />
prices and shipments.<br />
Europe Inc. is not eurozone GDP. Europe offers<br />
a wealth of world-class, global companies that<br />
generate a mere 50% of aggregate revenues in<br />
Europe.<br />
The dividend yield of the Continental<br />
European market is an attractive 4%, the<br />
second-highest of all regional markets after<br />
Markets & the Economy<br />
the United Kingdom. On a cyclically-adjusted<br />
basis, the European price-to-earnings (P/E)<br />
ratio is 38% below its 30-year average. It is also<br />
at a 44% discount to the U.S. P/E ratio, the<br />
widest gap over the same period.<br />
2013 marks an important turning point for<br />
emerging economies. According to IMF<br />
estimates, it will be the fi rst year the total GDP<br />
of emerging nations exceeds that of advanced<br />
economies (see page 4 chart).<br />
We believe the underperformance of emerging<br />
market equities compared to developed market<br />
stocks (particularly U.S. stocks) appears close<br />
to an end.<br />
In the global gold market, central banks<br />
emerged as a new source of buying power in<br />
2010 after two decades of being net sellers. As<br />
a group, central banks grew to represent an<br />
impressive 10% of all demand in 2011 and have<br />
slightly exceeded this level so far in 2012. We<br />
believe the long-term uptrend in gold prices<br />
has further to run.<br />
To access the <strong>Global</strong> Insight 2013 Outlook, please<br />
contact your <strong>RBC</strong> advisor, private banker, or<br />
relationship manager.<br />
Gold Discovered (M oz)<br />
As Gold Discoveries Declined, Gold Prices Surged<br />
180<br />
160<br />
140<br />
120<br />
100<br />
80<br />
60<br />
40<br />
20<br />
0<br />
1990<br />
1992<br />
1994<br />
1996<br />
Gold Discovered<br />
World Mine Production<br />
Gold Price<br />
1998<br />
2000<br />
2002<br />
2004<br />
2006<br />
2008<br />
Source - Metal Economics Group, <strong>RBC</strong> Dominion Securities<br />
Note: Represents 189 gold deposits discovered since 1990, each with at<br />
least 2M oz of gold in total reserves, reserves, resources and past production<br />
(or at least 1M oz in reserves).<br />
2010<br />
$1,800<br />
$1,600<br />
$1,400<br />
$1,200<br />
$1,000<br />
$800<br />
$600<br />
$400<br />
$200<br />
$0<br />
Gold Price<br />
<strong>Global</strong> <strong>Roundup</strong><br />
United States<br />
The Fed’s new strategy to set formal economic<br />
thresholds for the unemployment rate (6.5%) and<br />
infl ation expectations (2.5%) to help determine<br />
interest rate policy was not without controversy.<br />
While the thresholds seem clear cut at fi rst blush,<br />
Chairman Bernanke’s comments indicated<br />
they aren’t so clear. He essentially admitted<br />
what our economists have long asserted: the<br />
unemployment rate is a poor measure of the<br />
labor market. Our chief U.S. economist wrote,<br />
“Of all the indicators that the Fed could have<br />
chosen, we remain surprised that they chose to<br />
highlight the unemployment rate.”<br />
Furthermore, we believe the infl ation<br />
expectation threshold gives the Fed some policy<br />
fl exibility—after all, it will be based on the Fed’s<br />
own infl ation forecast. Our economist wrote, “In<br />
other words, as long as their forecast (not the<br />
actual observed infl ation rate) is below 2.5%, they<br />
will not have to raise rates. How convenient.”<br />
Coming up: Housing data (Dec 18-20); Philly Fed<br />
(Dec 20); Durable Goods (Dec 21).<br />
Canada<br />
Canadian equities ended the week higher, lifted<br />
by Consumer Staples, Consumer Discretionary,<br />
and Financial stocks, while Materials suffered.<br />
Notable strength was seen in Progress Energy<br />
after the Canadian government approved the<br />
company’s acquisition by Petronas.<br />
Canadian government bond yields moved higher<br />
across the yield curve with the largest increase<br />
in yields experienced in maturities of 10-years or<br />
greater.<br />
Canadian Manufacturing sales declined 1.4% in<br />
October, well below consensus expectation which<br />
had forecast a 0.1% decrease. The decline was the<br />
largest since January 2012, as inventories reached<br />
their highest level since January 2009.<br />
3 GLOBAL INSIGHT WEEKLY – DECEMBER 14, 2012
Coming up: International Securities<br />
Transactions (Dec 17); Retail Sales (Dec 20);<br />
Gross Domestic Product and Consumer Price<br />
Index (Dec 21).<br />
Europe<br />
The banking agreement between EU fi nance<br />
ministers is a meaningful deal in that it resolves<br />
a long-held disagreement between Germany<br />
and France over how far the ECB’s supervisory<br />
powers should stretch. The ECB will have direct<br />
oversight of banks with over €30 billion of assets<br />
or balance sheets accounting for 20% or more<br />
of national GDP, or around 200 banks. Smaller<br />
banks, like Germany’s savings banks, will be<br />
looked after by national supervisors, though the<br />
ECB will have power to step in.<br />
Key points, however, have been left<br />
unaddressed. How exactly will the ECB be able<br />
to override national supervisors of smaller<br />
banks? What is the timing of this agreement<br />
translating into direct recapitalisation of<br />
troubled banks by the European Stability<br />
Mechanism (the eurozone rescue fund)?<br />
With this unclear, it is too soon to claim the<br />
agreement is a game changer.<br />
Moreover, and crucially, while the ECB will<br />
now be in a position to identify problem banks<br />
and demand action, the responsibility of<br />
fi xing the problem remains with the member<br />
states. A true banking union would include two<br />
elements—a single resolution fund to clean<br />
up failed banks and a single deposit-insurance<br />
scheme to prevent bank runs. This is the only<br />
way to break the vicious circle between weak<br />
sovereigns and weak banks. The agreement is a<br />
step in the right direction, but doesn’t address<br />
the key issues.<br />
In other news, Bank of Canada Governor Mark<br />
Carney, who will take the helm of the Bank of<br />
England (BoE) in June 2013, spoke in Toronto<br />
on “Central Bank Policy Guidance.” According<br />
to Carney, when conventional monetary policy<br />
<strong>Global</strong> <strong>Roundup</strong><br />
70%<br />
60%<br />
50%<br />
40%<br />
30%<br />
Source - IMF World Economic Outlook, October 2012, <strong>RBC</strong> <strong>Wealth</strong><br />
<strong>Management</strong><br />
Actual data for 1980-2011, IMF estimates for 2012- 2017. Advanced<br />
Economies comprise the 35 most-developed nations.<br />
targeting infl ation has been exhausted after a<br />
long time of unprecedentedly low nominal rates,<br />
other monetary tools should be explored.<br />
Although at pains to explain that his comments<br />
were generic and not aimed at any one economy<br />
in particular, his speech was widely taken<br />
to suggest that the BoE should abandon<br />
infl ation targeting in favour of nominal GDP<br />
targets. Nominal GDP targets are no holy<br />
grail of monetary policy, however, as they may<br />
overlook credit growth and, thus, may not be<br />
consistent with fi nancial stability. Nevertheless,<br />
Mr. Carney’s novel, thinking-out-of-the-box<br />
approach should serve the Bank of England well<br />
when he takes over next year.<br />
Coming up: UK CPI (Dec 18); BoE minutes,<br />
Germany IFO (Dec 19).<br />
Asia Pacifi c<br />
Share of World GDP 1980-2017<br />
Developing economies are projected to account for<br />
more than half of world GDP beyond 2012.<br />
Advanced Economies<br />
Other Economies<br />
1980 1984 1988 1992 1996 2000 2004 2008 2012 2016<br />
Positive Chinese data and speculation about<br />
state institutions buying back shares helped<br />
the Shanghai Composite post its largest daily<br />
gain in three years on Friday, rising by 4.3% to<br />
2,150, the highest level since August 10. Trading<br />
volume was double the average over the<br />
previous 30 days.<br />
November’s Chinese industrial output climbed<br />
10% over the prior year, while retail sales grew<br />
14.9%. Chinese exports increased 2.9% in<br />
November, below the 9% forecast. However,<br />
with 2012 almost over, Chinese exports have<br />
risen by 7.3% year to date. The State Information<br />
Centre, a leading Chinese government think<br />
tank, forecasts exports and imports to rise by<br />
8% and 7.8%, respectively, in 2013. HSBC’s<br />
Flash December Manufacturing PMI for China<br />
came in at 50.9, indicating modest expansion in<br />
factory output. November’s 50.5 reading was the<br />
fi rst time the index surpassed 50 in over a year.<br />
These data points suggest Chinese economic<br />
activity continues to stabilize and support our<br />
view of China achieving 8.3% GDP growth in<br />
2013.<br />
Indonesia’s central bank maintained its reference<br />
interest rate at 5.75%, a record low, for the 10th<br />
straight meeting.<br />
Mergers and acquisitions news in the Energy<br />
sector dominated headlines. Chinese energy<br />
companies’ interest in Canadian assets<br />
continues. The Canadian government approved<br />
CNOOC’s (0883.HK) $15.1B acquisition of Nexen<br />
and Petroliam Nasional Bhd.’s $5.2B takeover<br />
of Progress Energy Resources. Following the<br />
decision, which outlined future limitations on<br />
takeovers of Canadian energy fi rms by foreign<br />
state-owned companies, PetroChina (0852.<br />
HK) announced it intends to purchase $1.2B,<br />
or 49.9%, of an Alberta-based shale formation<br />
owned by Encana.<br />
Coming up: China’s November property prices;<br />
Chinese foreign direct investment growth<br />
(expected -3.1%); Japan’s All Industry Activity<br />
Index (expected 0.2% growth); Japanese general<br />
election; Bank of Japan Target Rate (consensus:<br />
unchanged at 0.1%).<br />
4 GLOBAL INSIGHT WEEKLY – DECEMBER 14, 2012
Important Disclosures<br />
Analyst Certifi cation<br />
All of the views expressed in this report accurately refl ect the<br />
personal views of the responsible analyst(s) about any and all<br />
of the subject securities or issuers. No part of the compensation<br />
of the responsible analyst(s) named herein is, or will be, directly<br />
or indirectly, related to the specifi c recommendations or views<br />
expressed by the responsible analyst(s) in this report.<br />
Important Disclosures<br />
<strong>RBC</strong> <strong>Wealth</strong> <strong>Management</strong> is a division of <strong>RBC</strong> Capital Markets, LLC,<br />
which is an indirect wholly-owned subsidiary of the Royal Bank of<br />
Canada and, as such, is a related issuer of Royal Bank of Canada.<br />
Jeff Musial, Adrian Brown, Jay Roberts, and Lucy So, employees<br />
of <strong>RBC</strong> <strong>Wealth</strong> <strong>Management</strong> USA’s foreign affi liate <strong>RBC</strong> Dominion<br />
Securities Inc.; and Frédérique Carrier, an employee of <strong>RBC</strong><br />
<strong>Wealth</strong> <strong>Management</strong> USA’s foreign affi liate Royal Bank of<br />
Canada Investment <strong>Management</strong> (UK) Limited; contributed to<br />
the preparation of this publication. These individuals are not<br />
registered with or qualifi ed as research analysts with the U.S.<br />
Financial Industry Regulatory Authority (“FINRA”) and, since they<br />
are not associated persons of <strong>RBC</strong> <strong>Wealth</strong> <strong>Management</strong>, they<br />
may not be subject to NASD Rule 2711 and Incorporated NYSE<br />
Rule 472 governing communications with subject companies, the<br />
making of public appearances, and the trading of securities in<br />
accounts held by research analysts.<br />
In the event that this is a compendium report (covers six or more<br />
companies), <strong>RBC</strong> <strong>Wealth</strong> <strong>Management</strong> may choose to provide<br />
important disclosure information by reference. To access current<br />
disclosures, clients should refer to http://www.rbccm.com/<br />
GLDisclosure/PublicWeb/DisclosureLookup.aspx?EntityID=2<br />
to view disclosures regarding <strong>RBC</strong> <strong>Wealth</strong> <strong>Management</strong> and its<br />
affi liated fi rms. Such information is also available upon request<br />
to <strong>RBC</strong> <strong>Wealth</strong> <strong>Management</strong> Publishing, 60 South Sixth St,<br />
Minneapolis, MN 55402.<br />
References to a Recommended List in the recommendation history<br />
chart may include one or more recommended lists or model<br />
portfolios maintained by <strong>RBC</strong> <strong>Wealth</strong> <strong>Management</strong> or one of its<br />
affi liates. <strong>RBC</strong> <strong>Wealth</strong> <strong>Management</strong> recommended lists include<br />
a former list called the Prime Opportunity List (RL 3), the Guided<br />
Portfolio: Prime Income (RL 6), the Guided Portfolio: Large Cap<br />
(RL 7), the Guided Portfolio: Dividend Growth (RL 8), the Guided<br />
Portfolio: Midcap 111 (RL9), and the Guided Portfolio: ADR (RL 10).<br />
<strong>RBC</strong> Capital Markets recommended lists include the Strategy Focus<br />
List and the Fundamental Equity Weightings (FEW) portfolios. The<br />
abbreviation ‘RL On’ means the date a security was placed on a<br />
Recommended List. The abbreviation ‘RL Off’ means the date a<br />
security was removed from a Recommended List.<br />
Distribution of Ratings<br />
For the purpose of ratings distributions, regulatory rules require<br />
member fi rms to assign ratings to one of three rating categories<br />
- Buy, Hold/Neutral, or Sell - regardless of a fi rm’s own rating<br />
categories. Although <strong>RBC</strong> <strong>Wealth</strong> <strong>Management</strong>’s ratings of Top<br />
Pick/Outperform, Sector Perform and Underperform most closely<br />
correspond to Buy, Hold/Neutral and Sell, respectively, the<br />
meanings are not the same because our ratings are determined<br />
on a relative basis (as described below).<br />
Investment Banking Services<br />
Provided During Past 12 Months<br />
Rating Count % Count %<br />
Buy (TP/O) 797 51.09 272 34.13<br />
Hold (SP) 689 44.17 176 25.54<br />
Sell (U) 74 4.74 8 10.81<br />
Defi nitions of Rating Categories<br />
An analyst’s “sector” is the universe of companies for which<br />
the analyst provides research coverage. Accordingly, the rating<br />
assigned to a particular stock represents the analyst’s view of<br />
how that stock will perform over the next 12 months relative to<br />
the analyst’s sector, but does not attempt to provide the analyst’s<br />
view of how the stock will perform relative to: (i) all companies<br />
that may actually exist in the company’s sector, or (ii) any broader<br />
market index.<br />
Ratings:<br />
Top Pick (TP): Represents analyst’s best idea in the sector;<br />
expected to provide signifi cant absolute total return over 12<br />
months with a favorable risk-reward ratio, approximately 10% of<br />
analyst’s recommendations.<br />
Outperform (O): Expected to materially outperform sector average<br />
over 12 months.<br />
Sector Perform (SP): Returns expected to be in line with sector<br />
average over 12 months.<br />
Underperform (U): Returns expected to be materially below sector<br />
average over 12 months.<br />
Risk Qualifi ers:<br />
Average Risk (Avg): Volatility and risk expected to be comparable to<br />
sector; average revenue and earnings predictability; no signifi cant<br />
cash fl ow/fi nancing concerns over coming 12-24 months; and/or<br />
fairly liquid.<br />
Above Average Risk (AA): Volatility and risk expected to be above<br />
sector; below average revenue and earnings predictability; may<br />
not be suitable for a signifi cant class of individual equity investors;<br />
may have negative cash fl ow; and/or low market cap or fl oat.<br />
Speculative (Spec): Risk consistent with venture capital; low<br />
public fl oat; potential balance sheet concerns; and/or risk of being<br />
delisted.<br />
Valuation and Price Target Impediments<br />
When <strong>RBC</strong> <strong>Wealth</strong> <strong>Management</strong> assigns a value to a company in<br />
a research report, FINRA Rules and NYSE Rules (as incorporated<br />
into the FINRA Rulebook) require that the basis for the valuation<br />
and the impediments to obtaining that valuation be described.<br />
Where applicable, this information is included in the text of our<br />
research in the sections entitled “Valuation” and “Price Target<br />
Impediment”, respectively.<br />
The analyst(s) responsible for preparing this research report<br />
received compensation that is based upon various factors,<br />
including total revenues of <strong>RBC</strong> Capital Markets, LLC, and its<br />
affi liates, a portion of which are or have been generated by<br />
investment banking activities of the member companies of <strong>RBC</strong><br />
Capital Markets, LLC and its affi liates.<br />
Other Disclosures<br />
Prepared with the assistance of our national research sources.<br />
<strong>RBC</strong> <strong>Wealth</strong> <strong>Management</strong> prepared this report and takes sole<br />
responsibility for its content and distribution. The content may<br />
have been based, at least in part, on material provided by our<br />
third-party correspondent research services. Our third-party<br />
correspondent has given <strong>RBC</strong> <strong>Wealth</strong> <strong>Management</strong> general<br />
permission to use its research reports as source materials, but<br />
has not reviewed or approved this report, nor has it been informed<br />
of its publication. Our third-party correspondent may from time<br />
to time have long or short positions in, effect transactions in,<br />
and make markets in securities referred to herein. Our thirdparty<br />
correspondent may from time to time perform investment<br />
banking or other services for, or solicit investment banking or other<br />
business from, any company mentioned in this report.<br />
<strong>RBC</strong> <strong>Wealth</strong> <strong>Management</strong> endeavors to make all reasonable efforts<br />
to provide research simultaneously to all eligible clients, having<br />
regard to local time zones in overseas jurisdictions. In certain<br />
investment advisory accounts, <strong>RBC</strong> <strong>Wealth</strong> <strong>Management</strong> will act as<br />
overlay manager for our clients and will initiate transactions in the<br />
securities referenced herein for those accounts upon receipt of this<br />
report. These transactions may occur before or after your receipt<br />
of this report and may have a short-term impact on the market<br />
price of the securities in which transactions occur. <strong>RBC</strong> <strong>Wealth</strong><br />
<strong>Management</strong> research is posted to our proprietary Web sites to<br />
ensure eligible clients receive coverage initiations and changes<br />
in rating, targets, and opinions in a timely manner. Additional<br />
distribution may be done by sales personnel via e-mail, fax, or<br />
5 GLOBAL INSIGHT WEEKLY – DECEMBER 14, 2012
Disclosures and Disclaimer<br />
regular mail. Clients may also receive our research via third-party<br />
vendors. Please contact your <strong>RBC</strong> <strong>Wealth</strong> <strong>Management</strong> Financial<br />
Advisor for more information regarding <strong>RBC</strong> <strong>Wealth</strong> <strong>Management</strong><br />
research.<br />
Confl icts Disclosure: <strong>RBC</strong> <strong>Wealth</strong> <strong>Management</strong> is registered<br />
with the Securities and Exchange Commission as a broker/<br />
dealer and an investment adviser, offering both brokerage and<br />
investment advisory services. <strong>RBC</strong> <strong>Wealth</strong> <strong>Management</strong>’s Policy<br />
for Managing Confl icts of Interest in Relation to Investment<br />
Research is available from us on our Web site at http://www.<br />
rbccm.com/GLDisclosure/PublicWeb/DisclosureLookup.<br />
aspx?EntityID=2. Confl icts of interests related to our investment<br />
advisory business can be found in Part II of the Firm’s Form ADV<br />
or the Investment Advisor Group Disclosure Document. Copies of<br />
any of these documents are available upon request through your<br />
Financial Advisor. We reserve the right to amend or supplement<br />
this policy, Part II of the ADV, or Disclosure Document at any time.<br />
The authors are employed by one of the following entities: <strong>RBC</strong><br />
<strong>Wealth</strong> <strong>Management</strong> USA, a division of <strong>RBC</strong> Capital Markets,<br />
LLC, a securities broker-dealer with principal offi ces located<br />
in Minnesota and New York, USA; by <strong>RBC</strong> Dominion Securities<br />
Inc., a securities broker-dealer with principal offi ces located in<br />
Toronto, Canada; by <strong>RBC</strong> Investment Services (Asia) Limited, a<br />
subsidiary of <strong>RBC</strong> Dominion Securities Inc., a securities brokerdealer<br />
with principal offi ces located in Hong Kong, China; and by<br />
Royal Bank of Canada Investment <strong>Management</strong> (U.K.) Limited, an<br />
investment management company with principal offi ces located<br />
in London, United Kingdom.<br />
Research Resources<br />
This document is produced by the <strong>Global</strong> Portfolio Advisory<br />
Committee within <strong>RBC</strong> <strong>Wealth</strong> <strong>Management</strong>’s Portfolio Advisory<br />
Group. The <strong>RBC</strong> WM Portfolio Advisory Group provides support<br />
related to asset allocation and portfolio construction for the<br />
fi rm’s Investment Advisors / Financial Advisors who are engaged<br />
in assembling portfolios incorporating individual marketable<br />
securities. The Committee leverages the broad market outlook as<br />
developed by the <strong>RBC</strong> Investment Strategy Committee, providing<br />
additional tactical and thematic support utilizing research from<br />
the <strong>RBC</strong> Investment Strategy Committee, <strong>RBC</strong> Capital Markets,<br />
and third-party resources.<br />
Disclaimer<br />
The information contained in this report has been compiled by<br />
<strong>RBC</strong> <strong>Wealth</strong> <strong>Management</strong>, a division of <strong>RBC</strong> Capital Markets, LLC,<br />
from sources believed to be reliable, but no representation or<br />
warranty, express or implied, is made by Royal Bank of Canada,<br />
<strong>RBC</strong> <strong>Wealth</strong> <strong>Management</strong>, its affi liates or any other person as to its<br />
accuracy, completeness or correctness. All opinions and estimates<br />
contained in this report constitute <strong>RBC</strong> <strong>Wealth</strong> <strong>Management</strong>’s<br />
judgment as of the date of this report, are subject to change<br />
without notice and are provided in good faith but without legal<br />
responsibility. This report is not an offer to sell or a solicitation<br />
of an offer to buy any securities. Past performance is not a guide<br />
to future performance, future returns are not guaranteed, and a<br />
loss of original capital may occur. Every province in Canada, state<br />
in the U.S., and most countries throughout the world have their<br />
own laws regulating the types of securities and other investment<br />
products which may be offered to their residents, as well as the<br />
process for doing so. As a result, the securities discussed in this<br />
report may not be eligible for sale in some jurisdictions. This<br />
report is not, and under no circumstances should be construed<br />
as, a solicitation to act as securities broker or dealer in any<br />
jurisdiction by any person or company that is not legally permitted<br />
to carry on the business of a securities broker or dealer in that<br />
jurisdiction. Nothing in this report constitutes legal, accounting or<br />
tax advice or individually tailored investment advice. This material<br />
is prepared for general circulation to clients, including clients who<br />
are affi liates of Royal Bank of Canada, and does not have regard<br />
to the particular circumstances or needs of any specifi c person<br />
who may read it. The investments or services contained in this<br />
report may not be suitable for you and it is recommended that you<br />
consult an independent investment advisor if you are in doubt<br />
about the suitability of such investments or services. To the full<br />
extent permitted by law neither Royal Bank of Canada nor any of<br />
its affi liates, nor any other person, accepts any liability whatsoever<br />
for any direct or consequential loss arising from any use of this<br />
report or the information contained herein. No matter contained in<br />
this document may be reproduced or copied by any means without<br />
the prior consent of Royal Bank of Canada. Additional information<br />
is available upon request.<br />
To U.S. Residents: This publication has been approved by <strong>RBC</strong><br />
Capital Markets, LLC, Member NYSE/FINRA/SIPC, which is a U.S.<br />
registered broker-dealer and which accepts responsibility for this<br />
report and its dissemination in the United States. <strong>RBC</strong> Capital<br />
Markets, LLC, is an indirect wholly-owned subsidiary of the Royal<br />
Bank of Canada and, as such, is a related issuer of Royal Bank of<br />
Canada. Any U.S. recipient of this report that is not a registered<br />
broker-dealer or a bank acting in a broker or dealer capacity<br />
and that wishes further information regarding, or to effect any<br />
transaction in, any of the securities discussed in this report,<br />
should contact and place orders with <strong>RBC</strong> Capital Markets, LLC.<br />
International investing involves risks not typically associated with<br />
U.S. investing, including currency fl uctuation, foreign taxation,<br />
political instability and different accounting standards.<br />
To Canadian Residents: This publication has been approved<br />
by <strong>RBC</strong> Dominion Securities Inc. <strong>RBC</strong> Dominion Securities Inc.*<br />
and Royal Bank of Canada are separate corporate entities which<br />
are affi liated. *Member-Canadian Investor Protection Fund.<br />
®Registered trademark of Royal Bank of Canada. Used under<br />
license. <strong>RBC</strong> <strong>Wealth</strong> <strong>Management</strong> is a registered trademark of<br />
Royal Bank of Canada. Used under license.<br />
To European Residents: Clients of United Kingdom subsidiaries<br />
may be entitled to compensation from the UK Financial Services<br />
Compensation Scheme if any of these entities cannot meet<br />
its obligations. This depends on the type of business and the<br />
circumstances of the claim. Most types of investment business<br />
are covered for up to a total of £50,000. The Channel Islands<br />
subsidiaries are not covered by the UK Financial Services<br />
Compensation Scheme; the offi ces of Royal Bank of Canada<br />
(Channel Islands) Limited in Guernsey and Jersey are covered by<br />
the respective compensation schemes in these jurisdictions for<br />
deposit taking business only.<br />
To Hong Kong Residents: This publication is distributed in<br />
Hong Kong by <strong>RBC</strong> Investment Services (Asia) Limited and <strong>RBC</strong><br />
Investment <strong>Management</strong> (Asia) Limited, licensed corporations<br />
under the Securities and Futures Ordinance or, by Royal Bank<br />
of Canada, Hong Kong Branch, a registered institution under<br />
the Securities and Futures Ordinance. This material has been<br />
prepared for general circulation and does not take into account<br />
the objectives, fi nancial situation, or needs of any recipient. Hong<br />
Kong persons wishing to obtain further information on any of<br />
the securities mentioned in this publication should contact <strong>RBC</strong><br />
Investment Services (Asia) Limited, <strong>RBC</strong> Investment <strong>Management</strong><br />
(Asia) Limited or Royal Bank of Canada, Hong Kong Branch at 17/<br />
Floor, Cheung Kong Center, 2 Queen’s Road Central, Hong Kong<br />
(telephone number is 2848-1388).<br />
To Singapore Residents: This publication is distributed in<br />
Singapore by <strong>RBC</strong> (Singapore Branch) and <strong>RBC</strong> (Asia) Limited,<br />
registered entities granted offshore bank status by the Monetary<br />
Authority of Singapore. This material has been prepared for<br />
general circulation and does not take into account the objectives,<br />
fi nancial situation, or needs of any recipient. You are advised<br />
to seek independent advice from a fi nancial adviser before<br />
purchasing any product. If you do not obtain independent advice,<br />
you should consider whether the product is suitable for you. Past<br />
performance is not indicative of future performance.<br />
Copyright © <strong>RBC</strong> Capital Markets, LLC 2012 - Member NYSE/<br />
FINRA/SIPC<br />
Copyright © <strong>RBC</strong> Dominion Securities Inc. 2012 -<br />
Member - Canadian Investor Protection Fund<br />
Copyright © <strong>RBC</strong> Europe Limited 2012<br />
Copyright © Royal Bank of Canada 2012<br />
All rights reserved<br />
6 GLOBAL INSIGHT WEEKLY – DECEMBER 14, 2012