Global Roundup - RBC Wealth Management
Global Roundup - RBC Wealth Management
Global Roundup - RBC Wealth Management

You also want an ePaper? Increase the reach of your titles
YUMPU automatically turns print PDFs into web optimized ePapers that Google loves.
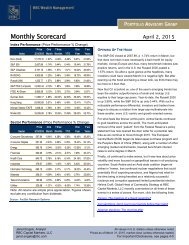
Market Scorecard – December 14, 2012<br />
Govt Bonds (bps chg) Yield 1 week MTD YTD<br />
US 2-Yr Tsy 0.234% -0.4 -1.2 -0.5<br />
US 10-Yr Tsy 1.702% 8.1 8.7 -17.4<br />
Canada 2-Yr 1.127% 6.1 5.9 17.1<br />
Canada 10-Yr 1.791% 8.1 9.1 -15.0<br />
UK 2-Yr 0.326% 7.2 1.1 -0.1<br />
UK 10-Yr 1.862% 11.9 8.7 -11.5<br />
Germany 2-Yr -0.043% 3.4 -5.3 -18.7<br />
Germany 10-Yr 1.348% 5.3 -3.8 -48.1<br />
Commodities (USD) Price 1 week MTD YTD<br />
Gold (spot $/oz) 1,695.30 -0.5% -1.1% 8.4%<br />
Silver (spot $/oz) 32.24 -2.5% -3.5% 15.8%<br />
Copper ($/ton) 8,052.00 0.5% 0.9% 6.1%<br />
Oil (WTI spot/bbl) 86.73 0.9% -2.5% -12.2%<br />
Oil (Brent spot/bbl) 111.70 3.1% -1.2% 2.8%<br />
Natural Gas ($/mlnBtu) 3.15 -5.6% -9.1% 5.5%<br />
Agriculture Index 462.39 -3.0% -3.4% 6.5%<br />
Currencies Rate 1 week MTD YTD<br />
US Dollar Index 79.58 -1.0% -0.7% -0.7%<br />
CAD/USD 1.01 0.2% 0.8% 3.6%<br />
USD/CAD 0.99 -0.2% -0.8% -3.5%<br />
EUR/USD 1.32 1.8% 1.4% 1.6%<br />
GBP/USD 1.62 0.8% 0.9% 4.0%<br />
AUD/USD 1.06 0.7% 1.3% 3.5%<br />
USD/CHF 0.92 -1.8% -1.1% -2.1%<br />
USD/JPY 83.48 1.2% 1.2% 8.5%<br />
EUR/JPY 109.88 3.0% 2.6% 10.3%<br />
EUR/GBP 0.81 1.0% 0.4% -2.3%<br />
EUR/CHF 1.21 0.0% 0.2% -0.7%<br />
USD/SGD 1.22 -0.1% 0.0% -5.9%<br />
USD/CNY 6.25 0.3% 0.3% -0.8%<br />
USD/BRL 2.09 0.5% -2.3% 11.7%<br />
Source: Bloomberg. Note: Bond yields in local currencies. Copper and Agriculture<br />
Index data as of Thursday’s close. Dollar Index measures USD vs. six major<br />
currencies. Currency rates refl ect market convention (CAD/USD is the exception).<br />
Currency returns quoted in terms of the fi rst currency in each pairing.<br />
Data as of 9:31 pm GMT 12/14/12.<br />
Examples of how to interpret currency data: CAD/USD 1.01 means 1 Canadian<br />
dollar will buy 1.01 U.S. dollars. CAD/USD 3.6% return means the Canadian dollar<br />
rose 3.6% vs. the U.S. dollar year to date. USD/JPY 83.48 means 1 U.S.<br />
dollar will buy 83.48 yen. USD/JPY 8.5% return means the U.S. dollar rose 8.5%<br />
vs. the yen year to date.<br />
Markets & the Economy<br />
Equity liquidity is drying up across regions as<br />
more and more market participants take a break<br />
for the holidays. As additional portfolio managers<br />
go on vacation over the next two weeks, we expect<br />
equity volatility to increase, just like it normally<br />
does at the end of each year.<br />
One market has already experienced heightened<br />
volatility recently, but not because of the calendar.<br />
For the second-straight week China’s Shanghai<br />
Composite Index led major stock markets—only<br />
this time it surged 4.3% on Friday. While improved<br />
manufacturing data helped boost the Shanghai<br />
Composite, other factors also played a role (see<br />
page 4).<br />
The Shanghai rally took a number of North<br />
American and European cyclical stocks along<br />
with it, specifi cally steel, infrastructure, and<br />
mining equipment companies with exposure<br />
to China. The Materials sector was the bestperforming<br />
S&P 500 sector for the week, rising<br />
1.6%.<br />
In the U.S., once again there was little progress in<br />
resolving fi scal cliff provisions, yet the market gave<br />
Washington more breathing room, closing only<br />
slightly lower for the week.<br />
Federal Reserve Chairman Ben Bernanke<br />
surprised analysts by moving away from setting<br />
a time frame on the zero interest rate policy and<br />
announced specifi c economic measures that will<br />
help drive interest rate decisions (see page 3).<br />
More importantly, European Union fi nance<br />
ministers signed a deal to give the European<br />
Central Bank (ECB) supervisory powers over<br />
the region’s banks. Yet again, as often has been<br />
the case in the development of the eurozone<br />
crisis, this agreement is a positive step in the right<br />
direction, though it does not solve the issue. Key<br />
points have been left unaddressed (see page 4 for<br />
analysis).<br />
Special Report: 2013 Outlook<br />
<strong>RBC</strong> <strong>Wealth</strong> <strong>Management</strong>’s strategy team has<br />
compiled a special edition of <strong>Global</strong> Insight, which<br />
discusses our 2013 outlook in detail, as well as key<br />
themes investors should consider.<br />
<strong>RBC</strong>’s base-case forecast for 2013:<br />
The investment focus pivots toward the U.S.<br />
where economic activity accelerates in the<br />
second half of the year. China’s economy<br />
should gather momentum. These developments<br />
would have positive implications for growth in<br />
Canada, the U.K., and Europe.<br />
Stocks deliver worthwhile returns<br />
and outperform bonds. Valuations are<br />
undemanding in most markets and cheap in<br />
select Asia Pacifi c and European markets.<br />
In fi xed income, defensive positioning is<br />
our preferred strategy with an emphasis on<br />
shorter maturities, favorably mispriced sectors,<br />
selective credits, and ample liquidity.<br />
20<br />
18<br />
16<br />
14<br />
U.S. GDP is Still Well Below Potential<br />
While it should begin to catch up soon,<br />
it would take strong growth to reach potential GDP by 2017.<br />
Actual Projected<br />
Implied<br />
growth of<br />
4.4% per<br />
annum for<br />
4 years<br />
12<br />
Recession<br />
GDP<br />
10<br />
Potential GDP<br />
2000 2005 2010 2015 2020<br />
Source - <strong>RBC</strong> <strong>Wealth</strong> <strong>Management</strong>, Congressional Budget Offi ce (CBO),<br />
National Bureau of Economic Research<br />
Potential GDP is the CBO’s estimate of the output the economy would<br />
produce with a high rate of use of its capital and labor resources.<br />
1.0<br />
0.9<br />
0.8<br />
0.7<br />
0.6<br />
0.5<br />
0.4<br />
0.3<br />
0.2<br />
0.1<br />
0.0<br />
2 GLOBAL INSIGHT WEEKLY – DECEMBER 14, 2012