Determinants of Unemployment in Limpopo Province in South Africa ...
Determinants of Unemployment in Limpopo Province in South Africa ...
Determinants of Unemployment in Limpopo Province in South Africa ...

Create successful ePaper yourself
Turn your PDF publications into a flip-book with our unique Google optimized e-Paper software.
Journal <strong>of</strong> Emerg<strong>in</strong>g Trends <strong>in</strong> Economics and Management Sciences (JETEMS) 2(1):54-61 (ISSN:2141-7024)<br />
© Scholarl<strong>in</strong>k Research Institute Journals, 2011 (ISSN: 2141-7024)<br />
jetems.scholarl<strong>in</strong>kresearch.org<br />
<strong>Determ<strong>in</strong>ants</strong> <strong>of</strong> <strong>Unemployment</strong> <strong>in</strong> <strong>Limpopo</strong> Prov<strong>in</strong>ce <strong>in</strong><br />
<strong>South</strong> <strong>Africa</strong>: Exploratory Studies<br />
Kwabena A. Kyei, and Kwame B. Gyekye<br />
Department <strong>of</strong> Statistics, University <strong>of</strong> Venda. Private Bag X5050<br />
Thohoyandou 0950. <strong>South</strong> <strong>Africa</strong><br />
Correspond<strong>in</strong>g Author: Kwabena A. Kyei<br />
__________________________________________________________________________________________<br />
Abstract<br />
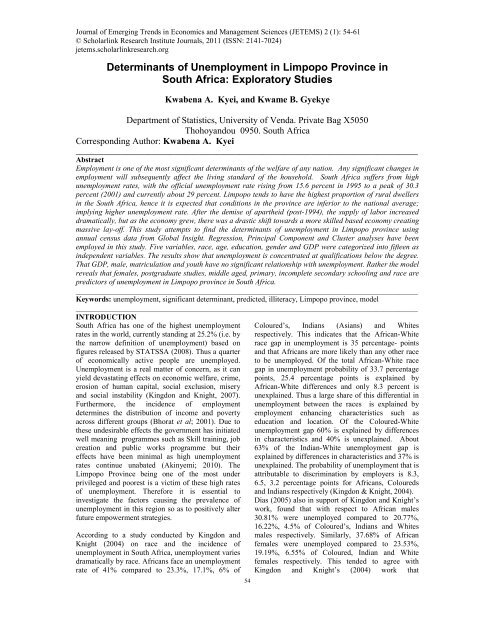
Employment is one <strong>of</strong> the most significant determ<strong>in</strong>ants <strong>of</strong> the welfare <strong>of</strong> any nation. Any significant changes <strong>in</strong><br />
employment will subsequently affect the liv<strong>in</strong>g standard <strong>of</strong> the household. <strong>South</strong> <strong>Africa</strong> suffers from high<br />
unemployment rates, with the <strong>of</strong>ficial unemployment rate ris<strong>in</strong>g from 15.6 percent <strong>in</strong> 1995 to a peak <strong>of</strong> 30.3<br />
percent (2001) and currently about 29 percent. <strong>Limpopo</strong> tends to have the highest proportion <strong>of</strong> rural dwellers<br />
<strong>in</strong> the <strong>South</strong> <strong>Africa</strong>, hence it is expected that conditions <strong>in</strong> the prov<strong>in</strong>ce are <strong>in</strong>ferior to the national average;<br />
imply<strong>in</strong>g higher unemployment rate. After the demise <strong>of</strong> apartheid (post-1994), the supply <strong>of</strong> labor <strong>in</strong>creased<br />
dramatically, but as the economy grew, there was a drastic shift towards a more skilled based economy creat<strong>in</strong>g<br />
massive lay-<strong>of</strong>f. This study attempts to f<strong>in</strong>d the determ<strong>in</strong>ants <strong>of</strong> unemployment <strong>in</strong> <strong>Limpopo</strong> prov<strong>in</strong>ce us<strong>in</strong>g<br />
annual census data from Global Insight. Regression, Pr<strong>in</strong>cipal Component and Cluster analyses have been<br />
employed <strong>in</strong> this study. Five variables, race, age, education, gender and GDP were categorized <strong>in</strong>to fifteen as<br />
<strong>in</strong>dependent variables. The results show that unemployment is concentrated at qualifications below the degree.<br />
That GDP, male, matriculation and youth have no significant relationship with unemployment. Rather the model<br />
reveals that females, postgraduate studies, middle aged, primary, <strong>in</strong>complete secondary school<strong>in</strong>g and race are<br />
predictors <strong>of</strong> unemployment <strong>in</strong> <strong>Limpopo</strong> prov<strong>in</strong>ce <strong>in</strong> <strong>South</strong> <strong>Africa</strong>.<br />
__________________________________________________________________________________________<br />
Keywords: unemployment, significant determ<strong>in</strong>ant, predicted, illiteracy, <strong>Limpopo</strong> prov<strong>in</strong>ce, model<br />
__________________________________________________________________________________________<br />
ITRODUCTIO<br />
<strong>South</strong> <strong>Africa</strong> has one <strong>of</strong> the highest unemployment<br />
rates <strong>in</strong> the world, currently stand<strong>in</strong>g at 25.2% (i.e. by<br />
the narrow def<strong>in</strong>ition <strong>of</strong> unemployment) based on<br />
figures released by STATSSA (2008). Thus a quarter<br />
<strong>of</strong> economically active people are unemployed.<br />
<strong>Unemployment</strong> is a real matter <strong>of</strong> concern, as it can<br />
yield devastat<strong>in</strong>g effects on economic welfare, crime,<br />
erosion <strong>of</strong> human capital, social exclusion, misery<br />
and social <strong>in</strong>stability (K<strong>in</strong>gdon and Knight, 2007).<br />
Furthermore, the <strong>in</strong>cidence <strong>of</strong> employment<br />
determ<strong>in</strong>es the distribution <strong>of</strong> <strong>in</strong>come and poverty<br />
across different groups (Bhorat et al; 2001). Due to<br />
these undesirable effects the government has <strong>in</strong>itiated<br />
well mean<strong>in</strong>g programmes such as Skill tra<strong>in</strong><strong>in</strong>g, job<br />
creation and public works programme but their<br />
effects have been m<strong>in</strong>imal as high unemployment<br />
rates cont<strong>in</strong>ue unabated (Ak<strong>in</strong>yemi; 2010). The<br />
<strong>Limpopo</strong> Prov<strong>in</strong>ce be<strong>in</strong>g one <strong>of</strong> the most under<br />
privileged and poorest is a victim <strong>of</strong> these high rates<br />
<strong>of</strong> unemployment. Therefore it is essential to<br />
<strong>in</strong>vestigate the factors caus<strong>in</strong>g the prevalence <strong>of</strong><br />
unemployment <strong>in</strong> this region so as to positively alter<br />
future empowerment strategies.<br />
Accord<strong>in</strong>g to a study conducted by K<strong>in</strong>gdon and<br />
Knight (2004) on race and the <strong>in</strong>cidence <strong>of</strong><br />
unemployment <strong>in</strong> <strong>South</strong> <strong>Africa</strong>, unemployment varies<br />
dramatically by race. <strong>Africa</strong>ns face an unemployment<br />
rate <strong>of</strong> 41% compared to 23.3%, 17.1%, 6% <strong>of</strong><br />
54<br />
Coloured’s, Indians (Asians) and Whites<br />
respectively. This <strong>in</strong>dicates that the <strong>Africa</strong>n-White<br />
race gap <strong>in</strong> unemployment is 35 percentage- po<strong>in</strong>ts<br />
and that <strong>Africa</strong>ns are more likely than any other race<br />
to be unemployed. Of the total <strong>Africa</strong>n-White race<br />
gap <strong>in</strong> unemployment probability <strong>of</strong> 33.7 percentage<br />
po<strong>in</strong>ts, 25.4 percentage po<strong>in</strong>ts is expla<strong>in</strong>ed by<br />
<strong>Africa</strong>n-White differences and only 8.3 percent is<br />
unexpla<strong>in</strong>ed. Thus a large share <strong>of</strong> this differential <strong>in</strong><br />
unemployment between the races is expla<strong>in</strong>ed by<br />
employment enhanc<strong>in</strong>g characteristics such as<br />
education and location. Of the Coloured-White<br />
unemployment gap 60% is expla<strong>in</strong>ed by differences<br />
<strong>in</strong> characteristics and 40% is unexpla<strong>in</strong>ed. About<br />
63% <strong>of</strong> the Indian-White unemployment gap is<br />
expla<strong>in</strong>ed by differences <strong>in</strong> characteristics and 37% is<br />
unexpla<strong>in</strong>ed. The probability <strong>of</strong> unemployment that is<br />
attributable to discrim<strong>in</strong>ation by employers is 8.3,<br />
6.5, 3.2 percentage po<strong>in</strong>ts for <strong>Africa</strong>ns, Coloureds<br />
and Indians respectively (K<strong>in</strong>gdon & Knight, 2004).<br />
Dias (2005) also <strong>in</strong> support <strong>of</strong> K<strong>in</strong>gdon and Knight’s<br />
work, found that with respect to <strong>Africa</strong>n males<br />
30.81% were unemployed compared to 20.77%,<br />
16.22%, 4.5% <strong>of</strong> Coloured’s, Indians and Whites<br />
males respectively. Similarly, 37.68% <strong>of</strong> <strong>Africa</strong>n<br />
females were unemployed compared to 23.53%,<br />
19.19%, 6.55% <strong>of</strong> Coloured, Indian and White<br />
females respectively. This tended to agree with<br />
K<strong>in</strong>gdon and Knight’s (2004) work that
Journal <strong>of</strong> Emerg<strong>in</strong>g Trends <strong>in</strong> Economics and Management Sciences (JETEMS) 2(1):54-61 (ISSN:2141-7024)<br />
unemployment is highest among <strong>Africa</strong>ns than any<br />
other race group and lowest among Whites.<br />
Pr<strong>of</strong>ile <strong>of</strong> <strong>Limpopo</strong> Prov<strong>in</strong>ce<br />
The <strong>Limpopo</strong> prov<strong>in</strong>ce is located <strong>in</strong> the northern most<br />
part <strong>of</strong> the country neighbor<strong>in</strong>g Botswana,<br />
Mozambique and Zimbabwe. The prov<strong>in</strong>ce covers a<br />
land size <strong>of</strong> 123910 km 2; account<strong>in</strong>g for 10.2 percent<br />
<strong>of</strong> <strong>South</strong> <strong>Africa</strong>’s total land area (STATSSA, 2003).<br />
Majority <strong>of</strong> the population resides <strong>in</strong> rural areas <strong>in</strong><br />
comparison to the national average <strong>of</strong> 50%. However<br />
due to its rural make-up, conditions are substandard<br />
compared to the rest <strong>of</strong> the country with the<br />
exception <strong>of</strong> the Eastern Cape Prov<strong>in</strong>ce (Gyekye and<br />
Ak<strong>in</strong>boade, 2001). <strong>Limpopo</strong> is characterized as a<br />
develop<strong>in</strong>g economy, portray<strong>in</strong>g positive growth<br />
patterns. For <strong>in</strong>stance, it experienced its highest<br />
growth <strong>of</strong> 3.8 percent between 1995 and 2001.<br />
Furthermore, its gross geographic product was<br />
quantified at 63646 million signify<strong>in</strong>g a 6 percent<br />
contribution to national Gross Domestic Product (i.e.<br />
3 rd smallest prov<strong>in</strong>cial contribution). The most<br />
significant contributors to its economy are<br />
community, social and personal service, agriculture,<br />
forestry and hunt<strong>in</strong>g, wholesale and retail trade. The<br />
prov<strong>in</strong>ce is endowed with variety <strong>of</strong> m<strong>in</strong>erals such as<br />
gold, plat<strong>in</strong>um etc; hence m<strong>in</strong><strong>in</strong>g is one <strong>of</strong> the<br />
ma<strong>in</strong>stay <strong>of</strong> its economy. However these m<strong>in</strong>erals are<br />
exported <strong>in</strong> their raw state and <strong>in</strong> return manufactured<br />
goods and services are imported (<strong>Limpopo</strong> City<br />
Guide, 2006).<br />
Population Structure<br />
The total population <strong>of</strong> the <strong>Limpopo</strong> prov<strong>in</strong>ce is<br />
5277432 represent<strong>in</strong>g 11.7% <strong>of</strong> <strong>South</strong> <strong>Africa</strong>’s total<br />
population. More than half <strong>of</strong> its population is female<br />
(i.e. 52%), with female dom<strong>in</strong>ance noticeable <strong>in</strong> the<br />
adult categories. This may be expla<strong>in</strong>ed by the high<br />
migration rates <strong>of</strong> adult males <strong>in</strong> search <strong>of</strong> jobs, and<br />
<strong>in</strong> the old age category due to longer survival <strong>of</strong><br />
women. The 2001 census f<strong>in</strong>d<strong>in</strong>gs were that 54.6% <strong>of</strong><br />
the population is female. A little over 40% <strong>of</strong> the<br />
total population <strong>in</strong> <strong>Limpopo</strong> prov<strong>in</strong>ce is less than 15<br />
years and 4% were aged 65 years and above depict<strong>in</strong>g<br />
a tendency <strong>of</strong> high dependency ratio. The total<br />
population is ma<strong>in</strong>ly <strong>Africa</strong>ns with a share <strong>of</strong> 97.2%<br />
whereas 0.2%, 0.2% and 2.4% are Coloureds, Indians<br />
and Whites respectively (<strong>Limpopo</strong> City Guide, 2006,<br />
2009).<br />
Economic Conditions<br />
The 2001 Census recorded that 33.4% aged 20 years<br />
and above had no formal education (i.e. 1 <strong>in</strong> every 3<br />
people had no literacy skills). Nearly half (49%) <strong>of</strong><br />
the economically active people are unemployed and<br />
33% <strong>of</strong> the employed were <strong>in</strong> the <strong>in</strong>formal sector.<br />
Poverty prevalence was very high, as 6 <strong>in</strong> every 10<br />
persons fell below the poverty l<strong>in</strong>e <strong>in</strong> 2002 (ILO,<br />
1996). A little over 70% <strong>of</strong> the population lived <strong>in</strong><br />
formal dwell<strong>in</strong>gs, 20% and 7% lived <strong>in</strong> traditional<br />
and <strong>in</strong>formal dwell<strong>in</strong>gs respectively. Majority (i.e.<br />
78%) <strong>of</strong> households had access to clean dr<strong>in</strong>k<strong>in</strong>g<br />
water. Approximately one <strong>in</strong> every 4 households had<br />
no access to the toilet facilities and only 14% had<br />
refuse removal service. Majority (i.e. 60%) <strong>of</strong><br />
households still used wood as their ma<strong>in</strong> source <strong>of</strong><br />
energy for cook<strong>in</strong>g, 25% and 11% <strong>of</strong> household used<br />
electricity and paraff<strong>in</strong> respectively (STATSSA,<br />
2003).<br />
Mortality<br />
In 2000, 53815 deaths were recorded for <strong>Limpopo</strong><br />
prov<strong>in</strong>ce represent<strong>in</strong>g about 20% <strong>of</strong> the national<br />
deaths. A slightly higher proportion were male<br />
(50.9%) compared to 49.1% for females. Half <strong>of</strong> the<br />
deaths were due to communicable diseases such as<br />
HIV/AIDS while 40% and 10% were due to noncommunicable<br />
diseases and <strong>in</strong>juries respectively. The<br />
prov<strong>in</strong>ce suffered from high <strong>in</strong>fant mortality (57 per<br />
1000 live births) compared to the national average <strong>of</strong><br />
42. This was usually due to communicable diseases,<br />
maternal and per<strong>in</strong>atal diseases and also HIV/AIDS.<br />
Life expectancy was also low.<br />
Figure 1: Shows the districts <strong>of</strong> <strong>Limpopo</strong> prov<strong>in</strong>ce.<br />
Source: <strong>Limpopo</strong> prov<strong>in</strong>ce government.<br />
<strong>Unemployment</strong> and Race <strong>in</strong> the Country<br />
Race plays a crucial role <strong>in</strong> determ<strong>in</strong><strong>in</strong>g access to<br />
employment <strong>in</strong> <strong>South</strong> <strong>Africa</strong>. Fritjers (1999)<br />
conducted a study on the employment criteria for a<br />
large cloth<strong>in</strong>g firm. The f<strong>in</strong>d<strong>in</strong>gs were that the firm<br />
was likely to employ Indians than <strong>Africa</strong>ns based on<br />
their relative expected productivity. Although<br />
productivity def<strong>in</strong>ed as the number <strong>of</strong> faultless<br />
garments were lower for the firm’s <strong>Africa</strong>ns than for<br />
its Indian employees (Stand<strong>in</strong>g et al. 2000).<br />
55
Journal <strong>of</strong> Emerg<strong>in</strong>g Trends <strong>in</strong> Economics and Management Sciences (JETEMS) 2(1):54-61 (ISSN:2141-7024)<br />
METHODOLOGY<br />
Secondary data, i.e. annual census data from Global<br />
Insight have been used <strong>in</strong> this study. Statistical<br />
Analyses us<strong>in</strong>g Regression, Pr<strong>in</strong>cipal Component and<br />
Cluster have been employed. In determ<strong>in</strong><strong>in</strong>g the<br />
impact <strong>of</strong> race, gender, education, GDP, etc. on<br />
unemployment, regression analysis was first used.<br />
The primary essence <strong>of</strong> regression analysis is to<br />
analyze the relationship between the dependent and<br />
<strong>in</strong>dependent variable(s). This technique <strong>of</strong> analysis<br />
then exploits this association between these two<br />
variables to predict the values <strong>of</strong> the dependent<br />
variable from the <strong>in</strong>dependent variables. The<br />
dependent variable is expressed as a function <strong>of</strong> the<br />
<strong>in</strong>dependent variable and its correspond<strong>in</strong>g<br />
parameters plus a stochastic error term. This<br />
stochastic error term accounts for all unobserved<br />
<strong>in</strong>dependent variables that would have had a<br />
significant impact on the dependent variable. This<br />
study employed the ord<strong>in</strong>ary least square method.<br />
The choice <strong>of</strong> the ord<strong>in</strong>ary least square method is due<br />
to its primary purpose to evaluate the relationship<br />
between a set <strong>of</strong> <strong>in</strong>dependent variables and a<br />
dependent variable.<br />
Model Specification: Regression<br />
The model constructed below is to assess the efficacy<br />
<strong>of</strong> unemployment determ<strong>in</strong>ants <strong>in</strong> the <strong>Limpopo</strong><br />
prov<strong>in</strong>ce.<br />
<strong>Unemployment</strong> = β o + β 1 GDP + β 2 <strong>Africa</strong>n + β 3 White<br />
+ β 4 Coloured + β 5 Asian + β 6 Male +<br />
β 7 Female + β 8 No school<strong>in</strong>g + β 9 Primary +<br />
β 10 Incomplete school + β 11 Matric + β 12 degree +<br />
β 13 postgraduate + β 14 youth + β 15 Middle age + β 16 Old<br />
age + ξ<br />
Where: GDP- Gross Domestic Product<br />
β i - parameter<br />
ξ - Error term<br />
Operational Def<strong>in</strong>itions <strong>of</strong> Variables<br />
Age: The age variable is categorized <strong>in</strong>to three, thus<br />
the youth, middle and old age.<br />
Indicator: The youth comprises all economically<br />
active people with<strong>in</strong> the ages <strong>of</strong> 15-29.<br />
The middle age cohort comprised all<br />
economically active people with<strong>in</strong> the<br />
ages <strong>of</strong> 30-49 years.<br />
The old age cohort comprised all<br />
economically active people with<strong>in</strong> the<br />
ages <strong>of</strong> 50-64 years.<br />
Education: Education is any act or experience that<br />
has a formative effect on the m<strong>in</strong>d, character or<br />
physical ability <strong>of</strong> an <strong>in</strong>dividual. Education variable<br />
is divided <strong>in</strong>to six categories.<br />
Indicator: o school<strong>in</strong>g is characterized by people<br />
with non access to formal education. Primary<br />
education consists <strong>of</strong> people with the first six years <strong>of</strong><br />
education. Incomplete secondary consists <strong>of</strong> people<br />
who have had access to secondary education but<br />
dropped out.<br />
Matric represents those who completed secondary<br />
school.<br />
Tertiary education (post –secondary) is made up <strong>of</strong><br />
undergraduate and postgraduate.<br />
Pr<strong>in</strong>cipal Component Analysis<br />
The pr<strong>in</strong>cipal component analysis (PCA) is a variable<br />
reduction procedure. It expla<strong>in</strong>s the correlation<br />
structure <strong>of</strong> a set <strong>of</strong> predictor variables us<strong>in</strong>g a<br />
smaller set <strong>of</strong> l<strong>in</strong>ear comb<strong>in</strong>ations <strong>of</strong> these variables.<br />
It is useful when one has obta<strong>in</strong>ed data on a number<br />
<strong>of</strong> variables and believes that there is some<br />
redundancy <strong>in</strong> those variables. It is appropriate when<br />
one wishes to develop a smaller number <strong>of</strong> artificial<br />
variables that will account for most <strong>of</strong> the variables <strong>in</strong><br />
the observed variables. It may then be used as a<br />
predictor or criterion variables <strong>in</strong> a subsequent<br />
analyses.<br />
Cluster Analysis identifies and classifies objects,<br />
<strong>in</strong>dividuals or variables on the basis <strong>of</strong> the similarity<br />
<strong>of</strong> the characteristics they possess. In simple terms,<br />
cluster analysis partitions the set <strong>of</strong> observations <strong>in</strong>to<br />
mutually exclusive group<strong>in</strong>gs <strong>in</strong>-order to best<br />
represent dist<strong>in</strong>ct set <strong>of</strong> observations with<strong>in</strong> the<br />
sample. The ma<strong>in</strong> objectives <strong>of</strong> cluster analysis are<br />
congruent with pr<strong>in</strong>cipal component analysis. Most<br />
commonly used cluster analysis procedure is<br />
Hierarchical.<br />
RESULTS OF AALYSIS AD<br />
ITERPRETATIO<br />
The chart below shows the “relationship”<br />
unemployment has with gender and race.<br />
<strong>Unemployment</strong> rate (Percent)<br />
30.0<br />
20.0<br />
10.0<br />
0.0<br />
<strong>Africa</strong>n<br />
Official unemployment by Gender and Race<br />
Coloured<br />
Race<br />
Asian<br />
White<br />
Fig 2: Official <strong>Unemployment</strong> by gender and race<br />
Source: Global Insight Census, 2008<br />
Gender<br />
Male<br />
Female<br />
56
Journal <strong>of</strong> Emerg<strong>in</strong>g Trends <strong>in</strong> Economics and Management Sciences (JETEMS) 2(1):54-61 (ISSN:2141-7024)<br />
It is obvious that unemployment is relatively higher<br />
for <strong>Africa</strong>ns than any other race group. Moreover<br />
there is a significant difference between<br />
unemployment figures for <strong>Africa</strong>n males and<br />
females. Coloured unemployment rates are also very<br />
high, however it seems there is a m<strong>in</strong>imal difference<br />
between unemployment rates for males and females<br />
<strong>of</strong> Coloured’s, Indian (Asian) and White’s<br />
respectively. The chart above reveals deficiencies <strong>in</strong><br />
education levels for <strong>Africa</strong>ns and Coloureds. Over<br />
70% <strong>of</strong> education is concentrated at <strong>in</strong>complete<br />
school<strong>in</strong>g and below for <strong>Africa</strong>ns and Coloureds<br />
while the reverse is true for Whites and Asians. These<br />
deficiencies might be related to poverty among the<br />
race cohorts, forc<strong>in</strong>g them to term<strong>in</strong>ate their<br />
school<strong>in</strong>g for the job market. The figures suggest that<br />
about 60% <strong>of</strong> Asians and Whites have matric<br />
qualifications or more. Only 4% <strong>of</strong> whites have not<br />
gone past Primary school<strong>in</strong>g, plac<strong>in</strong>g them <strong>in</strong> a better<br />
position to f<strong>in</strong>d employment. This might expla<strong>in</strong> high<br />
unemployment rates amongst <strong>Africa</strong>ns and Coloureds<br />
as compared to Whites and Indians.<br />
Table 1: The distribution <strong>of</strong> levels <strong>of</strong> education by<br />
race<br />
<strong>Africa</strong>n Coloured Asian White<br />
Education % % % %<br />
level<br />
No school<strong>in</strong>g 19.1 6 3 1.7<br />
Primary 12.6 7 10.6 1.7<br />
Incomplete 50.4 51.7 31.4 33.8<br />
Secondary<br />
Matric 16.0 32.1 40.5 50.9<br />
Degree 1.5 1.7 10.2 8.02<br />
Postgraduate 0.4 1.3 4 3.8<br />
Source: Global Insight Census, 2008<br />
Results from Regression<br />
Table 2: Model Summary<br />
Equation parameters and Value<br />
variables<br />
Dependent variable <strong>Unemployment</strong><br />
Independent variable 15<br />
R .985<br />
R-squared .971<br />
Adjusted R-squared .964<br />
Std. Error <strong>of</strong> the Estimate 1965.691<br />
Predictors: White, Asian, Coloured, Male, Female,<br />
No school<strong>in</strong>g, Primary, Incomplete Secondary,<br />
degree, Postgraduate, youth, middle age, old age.<br />
Source: Global Insight Census 2008<br />
R represents the multiple correlation coefficient<br />
which measures the efficacy <strong>of</strong> regression by<br />
establish<strong>in</strong>g the Pearson correlation between the true<br />
values <strong>of</strong> the target variable y and the estimates y ’<br />
obta<strong>in</strong>ed by substitut<strong>in</strong>g the correspond<strong>in</strong>g values <strong>of</strong><br />
x <strong>in</strong>to the regression equation. The correlation<br />
between y and y ’ is known as the multiple<br />
correlation coefficients R. The multiple correlations<br />
can only take values with<strong>in</strong> the range 0 to +1: 0≤ R<br />
≤1. A multiple correlation coefficient <strong>of</strong> zero<br />
represents no correlation between y and y ’ while a<br />
coefficient <strong>of</strong> closer to 1 or 1 represents a (strong)<br />
perfect correlation. Therefore the multiple R is 0.985<br />
which represents a strong correlation between y and<br />
y’. The R-squared (R 2 ), the coefficient <strong>of</strong><br />
determ<strong>in</strong>ation is the proportion <strong>of</strong> the variance <strong>of</strong> the<br />
dependent variable that is accounted for by the l<strong>in</strong>ear<br />
regression <strong>of</strong> the <strong>in</strong>dependent variables. Thus, it is an<br />
<strong>in</strong>dication <strong>of</strong> the goodness <strong>of</strong> fit <strong>of</strong> the model. The R-<br />
square is positively biased, however <strong>in</strong> order to<br />
correct the biasedness an Adjusted R-square is<br />
applied which is obviously less than R. The Adjusted<br />
R-square for this multiple regression is 0.971<br />
<strong>in</strong>dicat<strong>in</strong>g that the fitted regression l<strong>in</strong>e expla<strong>in</strong>s 97.1<br />
percent <strong>of</strong> the variation <strong>in</strong> the dependent variable and<br />
only 2.9 percent is expla<strong>in</strong>ed by the error term. This<br />
implies that the model is good.<br />
Table 3: ANOVA Table<br />
Model Sum <strong>of</strong> Squares Df Mean Square F Sig.<br />
1 Regression 8012912469.510 15 534194164.634 138.251 .000(a)<br />
Residual 239564321.786 62 3863940.674<br />
Total 8252476791.295 77<br />
Predictors: Age50_64, GDP, White, Asian, square. In this multiple regression the value <strong>of</strong> F is<br />
No_school<strong>in</strong>g, Coloured, Primary, Female, degree, significant smaller than 0.01. As seen below, the<br />
Male, age30_49, Incomplete_secondary, matric, negative sign for GDP growth {<strong>in</strong> equation (1), with<br />
youth, postgraduate. Dependent Variable: unstandardized coefficients}, shows that there is an<br />
<strong>Unemployment</strong><br />
Source: Global Insight Census 2008<br />
<strong>in</strong>verse relationship between GDP growth and<br />
unemployment. An <strong>in</strong>crease <strong>in</strong> GDP growth will<br />
consequently lead to a fall <strong>in</strong> unemployment,<br />
The regression ANOVA tests for a l<strong>in</strong>ear relationship<br />
between the variables. The F statistic is the ratio <strong>of</strong><br />
the mean square for regression to the residual mean<br />
although the t-statistic shows that the variable is<br />
<strong>in</strong>significant at all levels <strong>of</strong> significance (i.e. 1%, 5%<br />
and 10%). All the race variables (White, Coloured<br />
57
Journal <strong>of</strong> Emerg<strong>in</strong>g Trends <strong>in</strong> Economics and Management Sciences (JETEMS) 2(1):54-61 (ISSN:2141-7024)<br />
and Indian) have an <strong>in</strong>verse relationship with<br />
unemployment and the t-statistic for all the race<br />
variables is significant. An <strong>in</strong>crease <strong>in</strong> the number <strong>of</strong><br />
each race will consequently reduce unemployment <strong>in</strong><br />
the <strong>Limpopo</strong> prov<strong>in</strong>ce, although the impact <strong>of</strong> the<br />
race variables on unemployment varies significantly.<br />
Be<strong>in</strong>g Asian (Indian) drastically reduces<br />
unemployment compared to Coloured’s and White’s.<br />
The coefficient (unstandardized) <strong>of</strong> Asian race is -<br />
Table 4: Coefficients<br />
Model<br />
Unstandardized<br />
Coefficients<br />
34.44 <strong>in</strong>dicat<strong>in</strong>g that when the Asian population<br />
<strong>in</strong>creases by a person unemployment will drop by<br />
34.4. This is relatively high to a drop <strong>in</strong><br />
unemployment <strong>of</strong> 12.969 and 0.701 for Coloured’s<br />
and White’s respectively. This scenario might occur<br />
due to the relatively small number <strong>of</strong> the Asian<br />
population <strong>in</strong> the <strong>Limpopo</strong> prov<strong>in</strong>ce.<br />
Standardized<br />
Coefficients T Sig. level<br />
B Std. Error Beta<br />
1 (Constant) -1358.679 616.742 -2.203 .031<br />
GDP -24.352 91.907 -.007 -.265 .792*<br />
White -.701 .341 -.224 -2.053 .044<br />
Coloured -12.969 4.465 -.332 -2.905 .005<br />
Asian -34.444 9.196 -.974 -3.745 .000<br />
Male -.087 .160 -.160 -.541 .590*<br />
Female .782 .118 1.505 6.596 .000<br />
No school<strong>in</strong>g .143 .064 .254 2.224 .030<br />
Primary -.465 .146 -.478 -3.190 .002<br />
Incomplete secondary .217 .074 1.009 2.936 .005<br />
Matric .227 .178 .458 1.272 .208*<br />
Degree -4.739 1.327 -1.102 -3.571 .001<br />
Postgraduate 24.576 5.983 1.952 4.107 .000<br />
Youth .049 .070 .256 .705 .483*<br />
Middle age -.623 .096 -1.934 -6.462 .000<br />
old age .503 .172 .571 2.934 .005<br />
Dependent Variable: <strong>Unemployment</strong><br />
Source: Global Insight Census, 2008<br />
Estimated L<strong>in</strong>ear Model (unstandardized)<br />
<strong>Unemployment</strong> = -1358.679 -24.352GDP – 0.701White –<br />
12.969Coloured – 34.444Asian<br />
-0.87Male + 0.782Female + 0.143No<br />
school<strong>in</strong>g – 0.465Primary<br />
+0.217Incomplete Secondary + 0.227Matric –<br />
4.739Degree +<br />
24.576Postgraduate + 0.049Youth –<br />
0.623Middle age + 0.503Old age (1)<br />
Estimated L<strong>in</strong>ear Model (Standardized)<br />
<strong>Unemployment</strong> = -0.007 GDP – 0.224 White – 0.332 Coloured –<br />
0.974 Asian -0.160 Male + 1.505 Female + 0.254 No school<strong>in</strong>g –<br />
0.478 Primary<br />
+1.009 Incomplete Secondary + 0.458 Matric<br />
– 1.102 Degree +<br />
1.952 Postgraduate + 0.256 Youth – 1.934<br />
Middle age + 0.573Old age (2)<br />
From the model (standardized, which is the predictive<br />
model), it is observed that unemployment is<br />
concentrated at qualifications below the degree level.<br />
<strong>Unemployment</strong> <strong>in</strong> <strong>Limpopo</strong> is structural <strong>in</strong> nature.<br />
The people’s skills are substandard to job<br />
requirements. Matriculants were not predictors <strong>of</strong><br />
employment as employers were sceptical about the<br />
future productivity <strong>of</strong> these potential employees<br />
58<br />
(Stand<strong>in</strong>g et al., 2000, Dias 2005). Secondly, the<br />
matriculants are likely to have no work experience<br />
whilst school<strong>in</strong>g and also might have higher wage<br />
reservation s<strong>in</strong>ce they might not be knowledgeable<br />
about the skills they possess. Therefore they <strong>in</strong>tend to<br />
rema<strong>in</strong> as long as they f<strong>in</strong>d a job <strong>of</strong> choice <strong>in</strong> which,<br />
most <strong>of</strong>ten, is a mirage. The model shows that postgraduate<br />
studies is the most predictor <strong>of</strong><br />
unemployment with a standardized coefficient <strong>of</strong><br />
1.952, followed by middle aged with -1.934, females<br />
with 1.505, degree with -1.102, Incomplete secondary<br />
with 1.009 and Asian with -0.974. Thus<br />
unemployment and post-graduate studies move <strong>in</strong> the<br />
same direction and this is questionable. Because one<br />
expects post-graduate candidates to f<strong>in</strong>d job easily<br />
and therefore post-graduates studies be negatively<br />
related to unemployment. <strong>Unemployment</strong> <strong>in</strong><br />
<strong>Limpopo</strong> is concentrated among the follow<strong>in</strong>g<br />
categories: middle age, females, degree, <strong>in</strong>complete<br />
secondary education and old age and race (Indian).<br />
Results from the PCA<br />
In this study, as can be seen from the plot, the<br />
pr<strong>in</strong>cipal component analysis reduced the <strong>in</strong>itial<br />
fifteen <strong>in</strong>dependent categories (variables) <strong>in</strong>to seven<br />
presented <strong>in</strong> two pr<strong>in</strong>cipal components, namely: race
Journal <strong>of</strong> Emerg<strong>in</strong>g Trends <strong>in</strong> Economics and Management Sciences (JETEMS) 2(1):54-61 (ISSN:2141-7024)<br />
and “illiterate youth”; where the race comprised<br />
white and coloured; and the “illiterate youth”<br />
comprised no school<strong>in</strong>g, primary, <strong>in</strong>complete<br />
secondary school, youth and old age. Thus the seven<br />
reduced variables were: white, coloured, no<br />
school<strong>in</strong>g, primary, <strong>in</strong>complete secondary school,<br />
youth and old age.<br />
Table 5: Communalities<br />
Initial Extraction<br />
White 1.000 .932<br />
Coloured 1.000 .942<br />
No_school<strong>in</strong>g 1.000 .963<br />
Primary 1.000 .958<br />
Incomplete_secondary 1.000 .989<br />
Youth 1.000 .984<br />
old_age 1.000 .966<br />
Extraction Method: Pr<strong>in</strong>cipal Component Analysis<br />
Source: Global Insight Census, 2008<br />
Table 6: Pr<strong>in</strong>cipal components with variance<br />
expla<strong>in</strong>ed<br />
% <strong>of</strong><br />
Variance<br />
Total<br />
Rotated<br />
Component<br />
1<br />
Rotated<br />
Component<br />
2<br />
Comp<br />
onent Total<br />
1 5.394 77.054 5.394 .208 .943<br />
2 1.340 19.146 1.340 .249 .938<br />
3 .134 1.911 .980 -.045<br />
4 .071 1.019 .916 .344<br />
5 .037 .532 .922 .373<br />
6 .022 .311 .932 .341<br />
7 .002 .027 .892 .414<br />
Source: Global Insight Census, 2008<br />
Dendrogram us<strong>in</strong>g Average L<strong>in</strong>kage (Between Groups)<br />
Results from the Hierarchical Cluster analysis<br />
On the other hand as can be seen from the graph<br />
(dendrogram), the hierarchical cluster analysis shows<br />
that <strong>Unemployment</strong> is <strong>in</strong> the same cluster with no<br />
school<strong>in</strong>g, old age, primary, female and matric and<br />
closely adjacent to <strong>in</strong>complete secondary school.<br />
Hierarchical cluster analysis is a way to <strong>in</strong>vestigate<br />
group<strong>in</strong>g your data by creat<strong>in</strong>g a cluster tree. The tree<br />
is a multi-level hierarchy, where clusters at one level<br />
are jo<strong>in</strong>ed as clusters at the next high level.<br />
Rescaled Distance Cluster Comb<strong>in</strong>e<br />
C A S E 0 5 10 15 20 25<br />
Label Num +---------+---------+---------+---------+---------+<br />
Coloured 4 -+<br />
Asian 5 -+<br />
postgrad 13 -+-------+<br />
White 3 -+ |<br />
degree 12 -+ |<br />
Male 6 -+ +---------------------------------------+<br />
Female 7 -+-+ | |<br />
matric 11 -+ | | |<br />
Primary 9 -+ +-----+ |<br />
old_age 16 -+-+ |<br />
Unemploy 1 -+ | |<br />
No_schoo 8 ---+ |<br />
Incomple 10 -+-------------+ |<br />
youth 14 -+ +---------------------------------+<br />
Black 2 ---+-----------+<br />
middle_a 15 ---+<br />
59
Journal <strong>of</strong> Emerg<strong>in</strong>g Trends <strong>in</strong> Economics and Management Sciences (JETEMS) 2(1):54-61 (ISSN:2141-7024)<br />
DISCUSSIOS<br />
It can be deduced from the three different analyses<br />
that GDP has little or noth<strong>in</strong>g to do with<br />
unemployment <strong>in</strong> our analysis <strong>in</strong> <strong>Limpopo</strong>. Rather<br />
unemployment is <strong>in</strong>fluenced by female, old age, race,<br />
no school<strong>in</strong>g, primary, and/or <strong>in</strong>complete secondary<br />
education. <strong>South</strong> <strong>Africa</strong> has a unique situation <strong>in</strong><br />
contrast with trends usually observed <strong>in</strong> develop<strong>in</strong>g<br />
countries where graduate unemployment is extremely<br />
high. For example, higher education holders<br />
experience an unemployment rate <strong>of</strong> close to 6%<br />
compared to 41% for those with primary education or<br />
less. Secondary school<strong>in</strong>g and possess<strong>in</strong>g a matric<br />
qualification did not enhance the probability <strong>of</strong><br />
f<strong>in</strong>d<strong>in</strong>g employment <strong>in</strong> <strong>South</strong> <strong>Africa</strong> (Altman, 2004).<br />
The study has also found out that higher education<br />
(post-graduate studies) positively contributes to<br />
unemployment considerably across all race groups.<br />
This observation is strik<strong>in</strong>g because one expects postgraduate<br />
studies to have a negative impact on<br />
unemployment. This unexpected observation may<br />
result from the fact that the proportion <strong>of</strong> postgraduate<br />
students <strong>in</strong> the prov<strong>in</strong>ce is <strong>in</strong>significant, less<br />
than 4%.<br />
Our model shows that males do not have significant<br />
relationship with unemployment but females have.<br />
Dias (2005) observed that women were victims <strong>of</strong><br />
high unemployment rates than men. The<br />
unemployment rate for men <strong>in</strong> his study was 25.7%<br />
<strong>in</strong> comparison to 32% <strong>of</strong> women. Thus, there was a<br />
significant difference between the unemployment<br />
rates, and this was related to less <strong>in</strong>tensive job search<br />
by unemployed females <strong>in</strong> harmony with many other<br />
countries. Banerjee et al. (2008) supported the<br />
general argument that unemployment is prevalent<br />
among females than males. In 2005, 22.6% <strong>of</strong> males<br />
were unemployed while the figure for females was<br />
31.7%, but the participation <strong>of</strong> females has <strong>in</strong>creased<br />
drastically; narrow<strong>in</strong>g the gender gap. In addition,<br />
K<strong>in</strong>gdon and Knight (2007) found that<br />
unemployment among males and females was 17.3%<br />
and 25.3% respectively. Casale and Posel (2002)<br />
conducted a study on “the cont<strong>in</strong>ued fem<strong>in</strong>ization <strong>of</strong><br />
the labour force <strong>in</strong> <strong>South</strong> <strong>Africa</strong>”. Their study relied<br />
on the October Household survey (1995-99), it was<br />
observed that there was a disproportionate <strong>in</strong>crease <strong>in</strong><br />
the labor supply with respect to gender. Thus both<br />
genders’ experienced a positive growth <strong>in</strong> labor<br />
supply but women had a greater proportion.<br />
COCLUSIO<br />
This study has tried to f<strong>in</strong>d the determ<strong>in</strong>ants <strong>of</strong><br />
unemployment <strong>in</strong> <strong>Limpopo</strong> prov<strong>in</strong>ce <strong>in</strong> <strong>South</strong> <strong>Africa</strong><br />
us<strong>in</strong>g annual census data by Global Insight and<br />
apply<strong>in</strong>g three different methods <strong>of</strong> analysis. It has<br />
been found out that GDP does not have significant<br />
relationship with unemployment. Mean<strong>in</strong>g that<br />
irrespective <strong>of</strong> how much <strong>Limpopo</strong> economy grows,<br />
it will not be able to turn around the unemployment<br />
situation <strong>in</strong> the prov<strong>in</strong>ce which is already worry<strong>in</strong>g.<br />
Equally strik<strong>in</strong>g is the fact that the male population<br />
and the youth do not have significant relationships<br />
with unemployment <strong>in</strong> <strong>Limpopo</strong>. Rather our analysis<br />
shows that <strong>Unemployment</strong> <strong>in</strong> <strong>Limpopo</strong> prov<strong>in</strong>ce is<br />
predicted strongly and positively by female, old age<br />
and <strong>in</strong>complete secondary school<strong>in</strong>g. Furthermore,<br />
the model shows that unemployment has strong<br />
negative relationships with middle age, degree<br />
holders and race (non-<strong>Africa</strong>ns). Thus unless the<br />
current secondary school go<strong>in</strong>g students/learners<br />
study hard and complete their studies successfully,<br />
they will always add to the pool <strong>of</strong> high unemployed<br />
population <strong>in</strong> the prov<strong>in</strong>ce.<br />
RECOMMEDATIO<br />
S<strong>in</strong>ce unemployment <strong>in</strong> <strong>Limpopo</strong> is mostly predicted<br />
by “illiteracy”, <strong>in</strong>complete secondary education and<br />
below, it will therefore be necessary for the<br />
prov<strong>in</strong>cial government to make sure that all school<br />
go<strong>in</strong>g children have free access to school<strong>in</strong>g up to<br />
post-secondary level. It is only when learners<br />
successfully complete their secondary education that<br />
the prospects <strong>of</strong> gett<strong>in</strong>g job and reduc<strong>in</strong>g<br />
unemployment will look brighter. Private sectors<br />
should be encouraged to support this task <strong>of</strong> <strong>of</strong>fer<strong>in</strong>g<br />
f<strong>in</strong>ancial assistance to learners and even old age<br />
people to study. Discrim<strong>in</strong>ation aga<strong>in</strong>st women <strong>in</strong><br />
job provision should stop. Women with competence<br />
should be given jobs equally as men.<br />
REFERECES<br />
Ak<strong>in</strong>yemi, O. 2010: Factors associated with<br />
Employment Status among Graduates <strong>in</strong> <strong>South</strong><br />
<strong>Africa</strong>. International Journal <strong>of</strong> Mathematics, Pp 14-<br />
15.<br />
Altman, M 2004. “The State <strong>of</strong> Employment and<br />
<strong>Unemployment</strong> <strong>in</strong> <strong>South</strong> <strong>Africa</strong>”. In Daniel, J.,<br />
Habib, A. and <strong>South</strong>hall, R.(eds). State <strong>of</strong> The<br />
Nation: <strong>South</strong> <strong>Africa</strong> 2003-2004. Cape Town: HSRC<br />
Press, 158-183.<br />
Banerjee, A, Galiani, S, Levisohn, J, McLaren, Z, and<br />
Woolard, I. 2008.“ Why has <strong>Unemployment</strong> risen <strong>in</strong><br />
the New <strong>South</strong> <strong>Africa</strong>?” Economics <strong>of</strong> Transition,<br />
vol. 16(4): 715-740.<br />
Bhorat, H. and Leibbrandt, M. 2001a. “Modell<strong>in</strong>g<br />
Vulnerability and Low Earn<strong>in</strong>gs <strong>in</strong> the <strong>South</strong> <strong>Africa</strong>n<br />
Labour Market”.<br />
Bhorat, H., Murray, L., Muzi, M., Van der Berg, S.<br />
and Ingrid, W. 2001b “Fight<strong>in</strong>g Poverty : Labour<br />
Markets and Inequality <strong>in</strong> <strong>South</strong> <strong>Africa</strong>”, Cape Town<br />
: UCT Press, Pp 22-40.<br />
Casale, D. and Posel, D. 2002. “The Cont<strong>in</strong>ued<br />
Ferm<strong>in</strong>isation <strong>of</strong> the Labour Force <strong>in</strong> <strong>South</strong> <strong>Africa</strong>:<br />
60
Journal <strong>of</strong> Emerg<strong>in</strong>g Trends <strong>in</strong> Economics and Management Sciences (JETEMS) 2(1):54-61 (ISSN:2141-7024)<br />
An analysis <strong>of</strong> recent data and trends”, <strong>South</strong> <strong>Africa</strong>n<br />
Journal <strong>of</strong> Economics, 72(5), Pp. 978-1002.<br />
Dias, R. 2005. “Education and Economic Status <strong>in</strong><br />
<strong>South</strong> <strong>Africa</strong>: Insights from the Labour Force Survey<br />
<strong>of</strong> 2003”. Paper presented at the Economic Society <strong>of</strong><br />
<strong>South</strong> <strong>Africa</strong> Biennial Conference.<br />
Frijters, P. 1999. “Hir<strong>in</strong>g on the basis <strong>of</strong> Expected<br />
Productivity <strong>in</strong> a <strong>South</strong> <strong>Africa</strong>n Cloth<strong>in</strong>g Firm”.<br />
Oxford Economic Papers 51:345-54.<br />
Gyekye, A.B and Ak<strong>in</strong>boade, O.A. 2001.“The<br />
<strong>Determ<strong>in</strong>ants</strong> <strong>of</strong> Poverty <strong>in</strong> the Northern Prov<strong>in</strong>ce <strong>of</strong><br />
<strong>South</strong> <strong>Africa</strong> : Implications for Policy”. National<br />
Research Foundation Team Research Project (Ref.<br />
Number: 15/1/3/19/0037).<br />
ILO. 1996. “Restructur<strong>in</strong>g the Labour Market: The<br />
<strong>South</strong> <strong>Africa</strong>n Challenge: An ILO Country Review”,<br />
International Labour Organization, Geneva.<br />
K<strong>in</strong>gdon, G. and Knight, J. 2004. “Race and the<br />
Incidence <strong>of</strong> <strong>Unemployment</strong> <strong>in</strong> <strong>South</strong> <strong>Africa</strong>”.<br />
Review <strong>of</strong> Development Economics, 8(3), Pp. 198-<br />
222.<br />
K<strong>in</strong>gdon, G. and Knight, J. 2007. “<strong>Unemployment</strong> <strong>in</strong><br />
<strong>South</strong> <strong>Africa</strong>, 1995-2003: Causes, Problems and<br />
Policies”, Journal <strong>of</strong> <strong>Africa</strong>n Economies, vol. 16(5):<br />
813-848.<br />
<strong>Limpopo</strong> City Guide. 2006. <strong>South</strong>ern <strong>Africa</strong>.<br />
http://www. <strong>South</strong> <strong>Africa</strong> places.co.za. Info, accessed<br />
on 04 February 2009.<br />
<strong>Limpopo</strong> Prov<strong>in</strong>ce 2009. Rapid Appraisal Report on<br />
Home Community Based Care Programme.<br />
Department <strong>of</strong> Social Development 2004-2009.<br />
Stand<strong>in</strong>g, G., Sender, J, and Weekes, J. 2000.<br />
“Restructur<strong>in</strong>g the Labour Market <strong>South</strong> <strong>Africa</strong>’s<br />
Challenge”, An ILO Country Review, Second<br />
Impression.<br />
STATSSA 2003: http:/www.statssa.gov.za accessed<br />
<strong>in</strong> June 2010.<br />
STATSSA 2008: http:/www.statssa.gov.za<br />
www.wikipedia.com accessed September 2010.<br />
Urban and Non-Urban Population by Prov<strong>in</strong>ce,<br />
Census 1996 Report. Internet, <strong>South</strong> <strong>Africa</strong>.<br />
UNDP, 2000: Development Report. Internet, <strong>South</strong><br />
<strong>Africa</strong><br />
61