annual report 2009 - Fiskars Corporation
annual report 2009 - Fiskars Corporation
annual report 2009 - Fiskars Corporation

Create successful ePaper yourself
Turn your PDF publications into a flip-book with our unique Google optimized e-Paper software.
Consolidated Financial Statements, IFRS<br />
51<br />
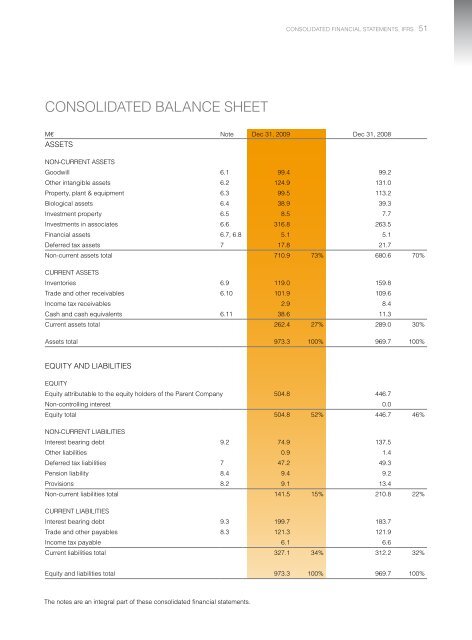
Consolidated Balance Sheet<br />
M€ Note Dec 31, <strong>2009</strong> Dec 31, 2008<br />
ASSETS<br />
Non-current assets<br />
Goodwill 6.1 99.4 99.2<br />
Other intangible assets 6.2 124.9 131.0<br />
Property, plant & equipment 6.3 99.5 113.2<br />
Biological assets 6.4 38.9 39.3<br />
Investment property 6.5 8.5 7.7<br />
Investments in associates 6.6 316.8 263.5<br />
Financial assets 6.7, 6.8 5.1 5.1<br />
Deferred tax assets 7 17.8 21.7<br />
Non-current assets total 710.9 73% 680.6 70%<br />
Current assets<br />
Inventories 6.9 119.0 159.8<br />
Trade and other receivables 6.10 101.9 109.6<br />
Income tax receivables 2.9 8.4<br />
Cash and cash equivalents 6.11 38.6 11.3<br />
Current assets total 262.4 27% 289.0 30%<br />
Assets total 973.3 100% 969.7 100%<br />
EQUITY AND LIABILITIES<br />
Equity<br />
Equity attributable to the equity holders of the Parent Company 504.8 446.7<br />
Non-controlling interest 0.0<br />
Equity total 504.8 52% 446.7 46%<br />
Non-current liabilities<br />
Interest bearing debt 9.2 74.9 137.5<br />
Other liabilities 0.9 1.4<br />
Deferred tax liabilities 7 47.2 49.3<br />
Pension liability 8.4 9.4 9.2<br />
Provisions 8.2 9.1 13.4<br />
Non-current liabilities total 141.5 15% 210.8 22%<br />
Current liabilities<br />
Interest bearing debt 9.3 199.7 183.7<br />
Trade and other payables 8.3 121.3 121.9<br />
Income tax payable 6.1 6.6<br />
Current liabilities total 327.1 34% 312.2 32%<br />
Equity and liabilities total 973.3 100% 969.7 100%<br />
The notes are an integral part of these consolidated financial statements.