Impact Assessment of Climate Change and Sea Level Rise on ...
Impact Assessment of Climate Change and Sea Level Rise on ...
Impact Assessment of Climate Change and Sea Level Rise on ...

Create successful ePaper yourself
Turn your PDF publications into a flip-book with our unique Google optimized e-Paper software.
Table E.3: Inundated area in different depth categories in an average flood c<strong>on</strong>diti<strong>on</strong><br />
Districts<br />
Area<br />
L<str<strong>on</strong>g>and</str<strong>on</strong>g> Type (km 2 )<br />
(km 2 ) F0 F1 F2 F3 F4<br />
Faridpur 2072.72<br />
Inundati<strong>on</strong> at 2005 32.04 156.60 289.80 186.57 10.35<br />
Area in % 1.55 7.56 13.98 9.00 0.50<br />
Sirajganj 2497.92<br />
Inundati<strong>on</strong> at 2005 58.23 401.49 699.21 423.90 12.24<br />
Area in % 2.33 16.07 27.99 16.97 0.49<br />
Sunamgan<br />
Inundati<strong>on</strong> at 2005 882.17 371.43 699.48 1178.10 472.95<br />
3669.58<br />
j<br />
Area in % 24.04 10.12 19.06 32.10 12.89<br />
Satkhira 3858.33<br />
Inundati<strong>on</strong> at 2005 35.91 121.50 392.31 1844.37 0.09<br />
Area in % 0.93 3.15 10.17 47.80 0.00<br />
Barisal 2790.51<br />
Inundati<strong>on</strong> at 2005 117.63 975.33 749.43 78.12 0.00<br />
Area in % 4.22 34.95 26.86 2.80 0.00<br />
Gaib<str<strong>on</strong>g>and</str<strong>on</strong>g>ha 2179.27<br />
Inundati<strong>on</strong> at 2005 74.43 414.81 479.79 104.04 0.36<br />
Area in % 3.42 19.03 22.02 4.77 0.02<br />
Pabna 2371.5<br />
Inundati<strong>on</strong> at 2005 61.56 219.96 487.08 553.68 126.18<br />
Area in % 2.60 9.28 20.54 23.35 5.32<br />
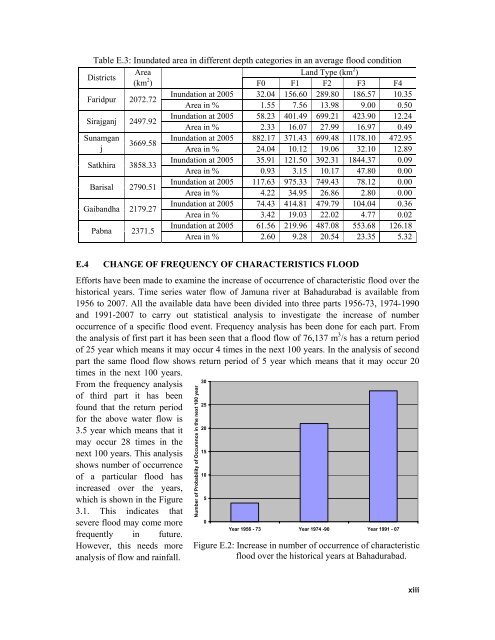
E.4 CHANGE OF FREQUENCY OF CHARACTERISTICS FLOOD<br />
Efforts have been made to examine the increase <str<strong>on</strong>g>of</str<strong>on</strong>g> occurrence <str<strong>on</strong>g>of</str<strong>on</strong>g> characteristic flood over the<br />
historical years. Time series water flow <str<strong>on</strong>g>of</str<strong>on</strong>g> Jamuna river at Bahadurabad is available from<br />
1956 to 2007. All the available data have been divided into three parts 1956-73, 1974-1990<br />
<str<strong>on</strong>g>and</str<strong>on</strong>g> 1991-2007 to carry out statistical analysis to investigate the increase <str<strong>on</strong>g>of</str<strong>on</strong>g> number<br />
occurrence <str<strong>on</strong>g>of</str<strong>on</strong>g> a specific flood event. Frequency analysis has been d<strong>on</strong>e for each part. From<br />
the analysis <str<strong>on</strong>g>of</str<strong>on</strong>g> first part it has been seen that a flood flow <str<strong>on</strong>g>of</str<strong>on</strong>g> 76,137 m 3 /s has a return period<br />
<str<strong>on</strong>g>of</str<strong>on</strong>g> 25 year which means it may occur 4 times in the next 100 years. In the analysis <str<strong>on</strong>g>of</str<strong>on</strong>g> sec<strong>on</strong>d<br />
part the same flood flow shows return period <str<strong>on</strong>g>of</str<strong>on</strong>g> 5 year which means that it may occur 20<br />
times in the next 100 years.<br />
From the frequency analysis<br />
<str<strong>on</strong>g>of</str<strong>on</strong>g> third part it has been<br />
found that the return period<br />
for the above water flow is<br />
3.5 year which means that it<br />
may occur 28 times in the<br />
next 100 years. This analysis<br />
shows number <str<strong>on</strong>g>of</str<strong>on</strong>g> occurrence<br />
<str<strong>on</strong>g>of</str<strong>on</strong>g> a particular flood has<br />
increased over the years,<br />
which is shown in the Figure<br />
3.1. This indicates that<br />
severe flood may come more<br />
frequently in future.<br />
However, this needs more<br />
analysis <str<strong>on</strong>g>of</str<strong>on</strong>g> flow <str<strong>on</strong>g>and</str<strong>on</strong>g> rainfall.<br />
Number <str<strong>on</strong>g>of</str<strong>on</strong>g> Probability <str<strong>on</strong>g>of</str<strong>on</strong>g> Occurence in the next 100 year<br />
30<br />
25<br />
20<br />
15<br />
10<br />
5<br />
0<br />
Year 1956 - 73 Year 1974 -90 Year 1991 - 07<br />
Figure E.2: Increase in number <str<strong>on</strong>g>of</str<strong>on</strong>g> occurrence <str<strong>on</strong>g>of</str<strong>on</strong>g> characteristic<br />
flood over the historical years at Bahadurabad.<br />
xiii