Impact Assessment of Climate Change and Sea Level Rise on ...
Impact Assessment of Climate Change and Sea Level Rise on ...
Impact Assessment of Climate Change and Sea Level Rise on ...

You also want an ePaper? Increase the reach of your titles
YUMPU automatically turns print PDFs into web optimized ePapers that Google loves.
1.3 Review <str<strong>on</strong>g>of</str<strong>on</strong>g> Past Studies<br />
A number <str<strong>on</strong>g>of</str<strong>on</strong>g> studies <strong>on</strong> impact assessment <str<strong>on</strong>g>of</str<strong>on</strong>g> climate change <str<strong>on</strong>g>and</str<strong>on</strong>g> sea level rise had been<br />
carried out in the past. Some <str<strong>on</strong>g>of</str<strong>on</strong>g> the relevant past study reports have been reviewed to find the<br />
findings <str<strong>on</strong>g>of</str<strong>on</strong>g> earlier studies:<br />
4 th IPCC, Technical Summary, 2007, “A Report <str<strong>on</strong>g>of</str<strong>on</strong>g> Working Group I <str<strong>on</strong>g>of</str<strong>on</strong>g> the<br />
Intergovernmental Panel <strong>on</strong> <str<strong>on</strong>g>Climate</str<strong>on</strong>g> <str<strong>on</strong>g>Change</str<strong>on</strong>g>”<br />
In the six years since the IPCC’s Third <str<strong>on</strong>g>Assessment</str<strong>on</strong>g> Report (TAR), significant progress has<br />
been made in underst<str<strong>on</strong>g>and</str<strong>on</strong>g>ing past <str<strong>on</strong>g>and</str<strong>on</strong>g> recent climate change <str<strong>on</strong>g>and</str<strong>on</strong>g> in projecting future changes.<br />
These advances have arisen from large amounts <str<strong>on</strong>g>of</str<strong>on</strong>g> new data, more sophisticated analyses <str<strong>on</strong>g>of</str<strong>on</strong>g><br />
data, improvements in the underst<str<strong>on</strong>g>and</str<strong>on</strong>g>ing <str<strong>on</strong>g>and</str<strong>on</strong>g> simulati<strong>on</strong> <str<strong>on</strong>g>of</str<strong>on</strong>g> physical processes in climate<br />
models <str<strong>on</strong>g>and</str<strong>on</strong>g> more extensive explorati<strong>on</strong> <str<strong>on</strong>g>of</str<strong>on</strong>g> uncertainty ranges in model results.<br />
The dominant factor in the radiative forcing <str<strong>on</strong>g>of</str<strong>on</strong>g> climate in the industrial era is the increasing<br />
c<strong>on</strong>centrati<strong>on</strong> <str<strong>on</strong>g>of</str<strong>on</strong>g> various greenhouse gases in the atmosphere. Several <str<strong>on</strong>g>of</str<strong>on</strong>g> the major<br />
greenhouse gases occur naturally but increases in their atmospheric c<strong>on</strong>centrati<strong>on</strong>s over the<br />
last 250 years are due largely to human activities.<br />
L<strong>on</strong>g-Lived Green House Gases (LLGHGs), for example, CO 2 , methane (CH 4 ) <str<strong>on</strong>g>and</str<strong>on</strong>g> nitrous<br />
oxide (N 2 O), are chemically stable <str<strong>on</strong>g>and</str<strong>on</strong>g> persist in the atmosphere over time scales <str<strong>on</strong>g>of</str<strong>on</strong>g> a decade<br />
to centuries or l<strong>on</strong>ger, so that their emissi<strong>on</strong> has a l<strong>on</strong>g-term influence <strong>on</strong> climate.<br />
The c<strong>on</strong>centrati<strong>on</strong> <str<strong>on</strong>g>of</str<strong>on</strong>g> atmospheric CO 2 has increased from a pre-industrial value <str<strong>on</strong>g>of</str<strong>on</strong>g> about 280<br />
ppm to 379 ppm in 2005. The CH 4 abundance in 2005 <str<strong>on</strong>g>of</str<strong>on</strong>g> about 1774 ppb is more than double<br />
<str<strong>on</strong>g>of</str<strong>on</strong>g> its pre-industrial value. The N 2 O c<strong>on</strong>centrati<strong>on</strong> in 2005 was 319 ppb, about 18% higher<br />
than its pre-industrial value. Over the 1961 to 2003 period, the average rate <str<strong>on</strong>g>of</str<strong>on</strong>g> global mean<br />
sea level rise is estimated from tide gauge data to be 1.8 ± 0.5 mm yr -1 .<br />
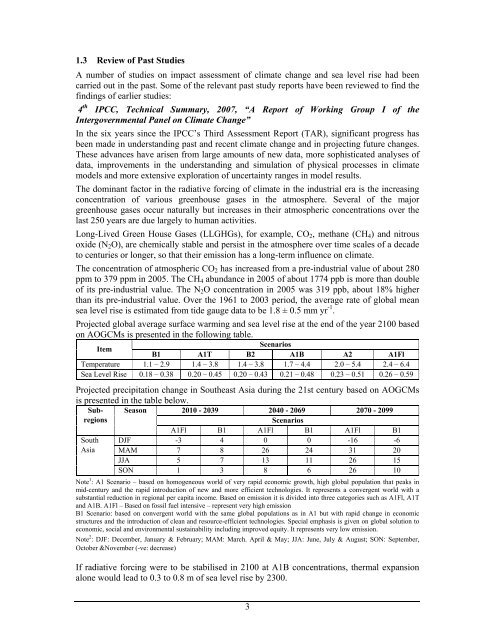
Projected global average surface warming <str<strong>on</strong>g>and</str<strong>on</strong>g> sea level rise at the end <str<strong>on</strong>g>of</str<strong>on</strong>g> the year 2100 based<br />
<strong>on</strong> AOGCMs is presented in the following table.<br />
Scenarios<br />
Item<br />
B1 A1T B2 A1B A2 A1Fl<br />
Temperature 1.1 – 2.9 1.4 – 3.8 1.4 – 3.8 1.7 – 4.4 2.0 – 5.4 2.4 – 6.4<br />
<str<strong>on</strong>g>Sea</str<strong>on</strong>g> <str<strong>on</strong>g>Level</str<strong>on</strong>g> <str<strong>on</strong>g>Rise</str<strong>on</strong>g> 0.18 – 0.38 0.20 – 0.45 0.20 – 0.43 0.21 – 0.48 0.23 – 0.51 0.26 – 0.59<br />
Projected precipitati<strong>on</strong> change in Southeast Asia during the 21st century based <strong>on</strong> AOGCMs<br />
is presented in the table below.<br />
Sub- <str<strong>on</strong>g>Sea</str<strong>on</strong>g>s<strong>on</strong> 2010 - 2039 2040 - 2069 2070 - 2099<br />
regi<strong>on</strong>s<br />
Scenarios<br />
A1Fl B1 A1Fl B1 A1Fl B1<br />
South DJF -3 4 0 0 -16 -6<br />
Asia MAM 7 8 26 24 31 20<br />
JJA 5 7 13 11 26 15<br />
SON 1 3 8 6 26 10<br />
Note 1 : A1 Scenario – based <strong>on</strong> homogeneous world <str<strong>on</strong>g>of</str<strong>on</strong>g> very rapid ec<strong>on</strong>omic growth, high global populati<strong>on</strong> that peaks in<br />
mid-century <str<strong>on</strong>g>and</str<strong>on</strong>g> the rapid introducti<strong>on</strong> <str<strong>on</strong>g>of</str<strong>on</strong>g> new <str<strong>on</strong>g>and</str<strong>on</strong>g> more efficient technologies. It represents a c<strong>on</strong>vergent world with a<br />
substantial reducti<strong>on</strong> in regi<strong>on</strong>al per capita income. Based <strong>on</strong> emissi<strong>on</strong> it is divided into three categories such as A1Fl, A1T<br />
<str<strong>on</strong>g>and</str<strong>on</strong>g> A1B. A1Fl – Based <strong>on</strong> fossil fuel intensive – represent very high emissi<strong>on</strong><br />
B1 Scenario: based <strong>on</strong> c<strong>on</strong>vergent world with the same global populati<strong>on</strong>s as in A1 but with rapid change in ec<strong>on</strong>omic<br />
structures <str<strong>on</strong>g>and</str<strong>on</strong>g> the introducti<strong>on</strong> <str<strong>on</strong>g>of</str<strong>on</strong>g> clean <str<strong>on</strong>g>and</str<strong>on</strong>g> resource-efficient technologies. Special emphasis is given <strong>on</strong> global soluti<strong>on</strong> to<br />
ec<strong>on</strong>omic, social <str<strong>on</strong>g>and</str<strong>on</strong>g> envir<strong>on</strong>mental sustainability including improved equity. It represents very low emissi<strong>on</strong>.<br />
Note 2 : DJF: December, January & February; MAM: March. April & May; JJA: June, July & August; SON: September,<br />
October &November (-ve: decrease)<br />
If radiative forcing were to be stabilised in 2100 at A1B c<strong>on</strong>centrati<strong>on</strong>s, thermal expansi<strong>on</strong><br />
al<strong>on</strong>e would lead to 0.3 to 0.8 m <str<strong>on</strong>g>of</str<strong>on</strong>g> sea level rise by 2300.<br />
3