Rural-Residential Land Use Strategy Discussion Document - May
Rural-Residential Land Use Strategy Discussion Document - May
Rural-Residential Land Use Strategy Discussion Document - May

Create successful ePaper yourself
Turn your PDF publications into a flip-book with our unique Google optimized e-Paper software.
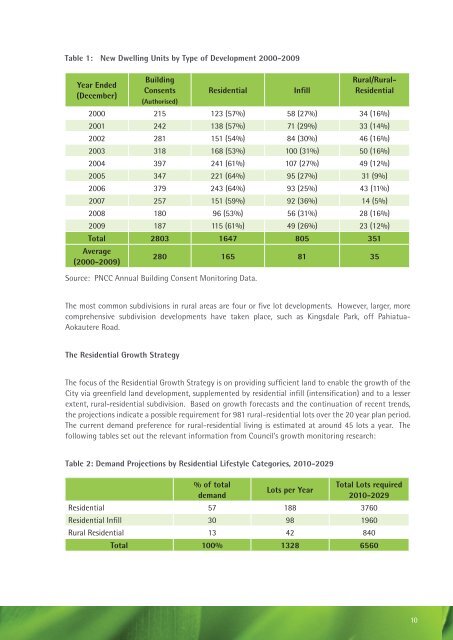
Table 1: New Dwelling Units by Type of Development 2000-2009<br />
Year Ended<br />
(December)<br />
Building<br />
Consents<br />
(Authorised)<br />
<strong>Residential</strong><br />
Infill<br />
<strong>Rural</strong>/<strong>Rural</strong>-<br />
<strong>Residential</strong><br />
2000 215 123 (57%) 58 (27%) 34 (16%)<br />
2001 242 138 (57%) 71 (29%) 33 (14%)<br />
2002 281 151 (54%) 84 (30%) 46 (16%)<br />
2003 318 168 (53%) 100 (31%) 50 (16%)<br />
2004 397 241 (61%) 107 (27%) 49 (12%)<br />
2005 347 221 (64%) 95 (27%) 31 (9%)<br />
2006 379 243 (64%) 93 (25%) 43 (11%)<br />
2007 257 151 (59%) 92 (36%) 14 (5%)<br />
2008 180 96 (53%) 56 (31%) 28 (16%)<br />
2009 187 115 (61%) 49 (26%) 23 (12%)<br />
Total 2803 1647 805 351<br />
Average<br />
(2000-2009)<br />
280 165 81 35<br />
Source: PNCC Annual Building Consent Monitoring Data.<br />
The most common subdivisions in rural areas are four or five lot developments. However, larger, more<br />
comprehensive subdivision developments have taken place, such as Kingsdale Park, off Pahiatua-<br />
Aokautere Road.<br />
The <strong>Residential</strong> Growth <strong>Strategy</strong><br />
The focus of the <strong>Residential</strong> Growth <strong>Strategy</strong> is on providing sufficient land to enable the growth of the<br />
City via greenfield land development, supplemented by residential infill (intensification) and to a lesser<br />
extent, rural-residential subdivision. Based on growth forecasts and the continuation of recent trends,<br />
the projections indicate a possible requirement for 981 rural-residential lots over the 20 year plan period.<br />
The current demand preference for rural-residential living is estimated at around 45 lots a year. The<br />
following tables set out the relevant information from Council’s growth monitoring research:<br />
Table 2: Demand Projections by <strong>Residential</strong> Lifestyle Categories, 2010-2029<br />
% of total<br />
demand<br />
Lots per Year<br />
Total Lots required<br />
2010-2029<br />
<strong>Residential</strong> 57 188 3760<br />
<strong>Residential</strong> Infill 30 98 1960<br />
<strong>Rural</strong> <strong>Residential</strong> 13 42 840<br />
Total 100% 1328 6560<br />
10