
Create successful ePaper yourself
Turn your PDF publications into a flip-book with our unique Google optimized e-Paper software.
Industry Statistics<br />
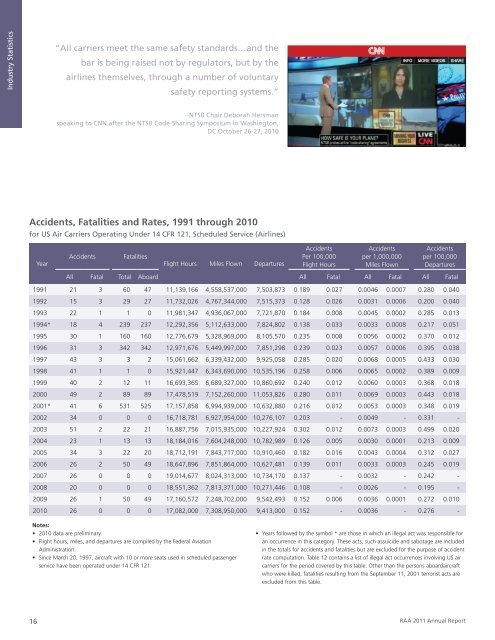
“All carriers meet the same safety standards…and the<br />
bar is being raised not by regulators, but by the<br />
airlines themselves, through a number of voluntary<br />
safety reporting systems.”<br />
--NTSB Chair Deborah Hersman<br />
speaking to CNN after the NTSB Code-Sharing Symposium in Washington,<br />
DC October 26-27, 2010<br />
Accidents, Fatalities and Rates, 1991 through 2010<br />
for US Air Carriers Operating Under 14 CFR 121, Scheduled Service (Airlines)<br />
Year<br />
Accidents<br />
Fatalities<br />
Flight Hours Miles Flown Departures<br />
Accidents<br />
Per 100,000<br />
Flight Hours<br />
Accidents<br />
per 1,000,000<br />
Miles Flown<br />
Accidents<br />
per 100,000<br />
Departures<br />
All Fatal Total Aboard All Fatal All Fatal All Fatal<br />
1991 21 3 60 47 11,139,166 4,558,537,000 7,503,873 0.189 0.027 0.0046 0.0007 0.280 0.040<br />
1992 15 3 29 27 11,732,026 4,767,344,000 7,515,373 0.128 0.026 0.0031 0.0006 0.200 0.040<br />
1993 22 1 1 0 11,981,347 4,936,067,000 7,721,870 0.184 0.008 0.0045 0.0002 0.285 0.013<br />
1994* 18 4 239 237 12,292,356 5,112,633,000 7,824,802 0.138 0.033 0.0033 0.0008 0.217 0.051<br />
1995 30 1 160 160 12,776,679 5,328,969,000 8,105,570 0.235 0.008 0.0056 0.0002 0.370 0.012<br />
1996 31 3 342 342 12,971,676 5,449,997,000 7,851,298 0.239 0.023 0.0057 0.0006 0.395 0.038<br />
1997 43 3 3 2 15,061,662 6,339,432,000 9,925,058 0.285 0.020 0.0068 0.0005 0.433 0.030<br />
1998 41 1 1 0 15,921,447 6,343,690,000 10,535,196 0.258 0.006 0.0065 0.0002 0.389 0.009<br />
1999 40 2 12 11 16,693,365 6,689,327,000 10,860,692 0.240 0.012 0.0060 0.0003 0.368 0.018<br />
2000 49 2 89 89 17,478,519 7,152,260,000 11,053,826 0.280 0.011 0.0069 0.0003 0.443 0.018<br />
2001* 41 6 531 525 17,157,858 6,994,939,000 10,632,880 0.216 0.012 0.0053 0.0003 0.348 0.019<br />
2002 34 0 0 0 16,718,781 6,927,954,000 10,276,107 0.203 - 0.0049 - 0.331 -<br />
2003 51 2 22 21 16,887,756 7,015,935,000 10,227,924 0.302 0.012 0.0073 0.0003 0.499 0.020<br />
2004 23 1 13 13 18,184,016 7,604,248,000 10,782,989 0.126 0.005 0.0030 0.0001 0.213 0.009<br />
2005 34 3 22 20 18,712,191 7,843,717,000 10,910,460 0.182 0.016 0.0043 0.0004 0.312 0.027<br />
2006 26 2 50 49 18,647,896 7,851,864,000 10,627,481 0.139 0.011 0.0033 0.0003 0.245 0.019<br />
2007 26 0 0 0 19,014,677 8,024,313,000 10,734,170 0.137 - 0.0032 - 0.242 -<br />
2008 20 0 0 0 18,551,362 7,813,371,000 10,271,446 0.108 - 0.0026 - 0.195 -<br />
2009 26 1 50 49 17,160,572 7,248,702,000 9,542,493 0.152 0.006 0.0036 0.0001 0.272 0.010<br />
2010 26 0 0 0 17,082,000 7,308,950,000 9,413,000 0.152 - 0.0036 - 0.276 -<br />
Notes:<br />
• 2010 data are preliminary.<br />
• Flight hours, miles, and departures are compiled by the Federal Aviation<br />
Administration.<br />
• Since March 20, 1997, aircraft with 10 or more seats used in scheduled passenger<br />
service have been operated under 14 CFR 121.<br />
• Years followed by the symbol * are those in which an illegal act was responsible for<br />
an occurrence in this category. These acts, such assuicide and sabotage are included<br />
in the totals for accidents and fatalities but are excluded for the purpose of accident<br />
rate computation. Table 12 contains a list of illegal act occurrences involving US air<br />
carriers for the period covered by this table. Other than the persons aboardaircraft<br />
who were killed, fatalities resulting from the September 11, 2001 terrorist acts are<br />
excluded from this table.<br />
16<br />
RAA 2011 <strong>Annual</strong> <strong>Report</strong>