Spectral Feature Extraction - Cornell University
Spectral Feature Extraction - Cornell University
Spectral Feature Extraction - Cornell University

Create successful ePaper yourself
Turn your PDF publications into a flip-book with our unique Google optimized e-Paper software.
CEE 615: Digital Image Processing 6<br />
W. Philpot, <strong>Cornell</strong> <strong>University</strong><br />
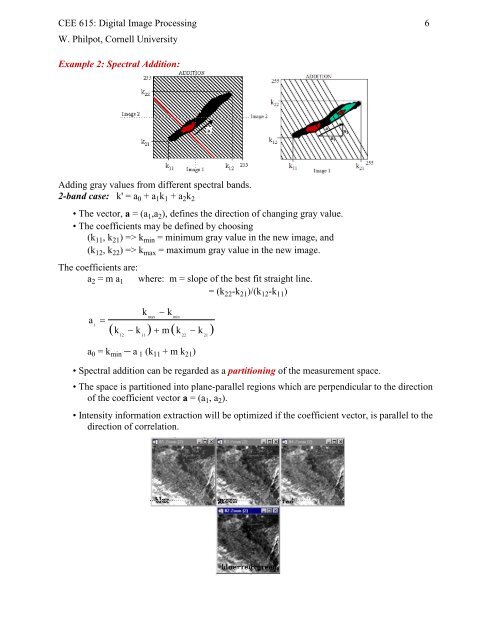
Example 2: <strong>Spectral</strong> Addition:<br />
Adding gray values from different spectral bands.<br />
2-band case: k' = a 0 + a 1 k 1 + a 2 k 2<br />
• The vector, a = (a 1 ,a 2 ), defines the direction of changing gray value.<br />
• The coefficients may be defined by choosing<br />
(k 11 , k 21 ) => k min = minimum gray value in the new image, and<br />
(k 12 , k 22 ) => k max = maximum gray value in the new image.<br />
The coefficients are:<br />
a 2 = m a 1 where: m = slope of the best fit straight line.<br />
= (k 22 -k 21 )/(k 12 -k 11 )<br />
a<br />
1<br />
=<br />
k<br />
max<br />
− k<br />
min<br />
( k − k ) + m( k − k )<br />
12 11 22 21<br />
a 0 = k min – a 1 (k 11 + m k 21 )<br />
• <strong>Spectral</strong> addition can be regarded as a partitioning of the measurement space.<br />
• The space is partitioned into plane-parallel regions which are perpendicular to the direction<br />
of the coefficient vector a = (a 1 , a 2 ).<br />
• Intensity information extraction will be optimized if the coefficient vector, is parallel to the<br />
direction of correlation.