Spectral Feature Extraction - Cornell University
Spectral Feature Extraction - Cornell University
Spectral Feature Extraction - Cornell University

You also want an ePaper? Increase the reach of your titles
YUMPU automatically turns print PDFs into web optimized ePapers that Google loves.
CEE 615: Digital Image Processing 1<br />
W. Philpot, <strong>Cornell</strong> <strong>University</strong><br />
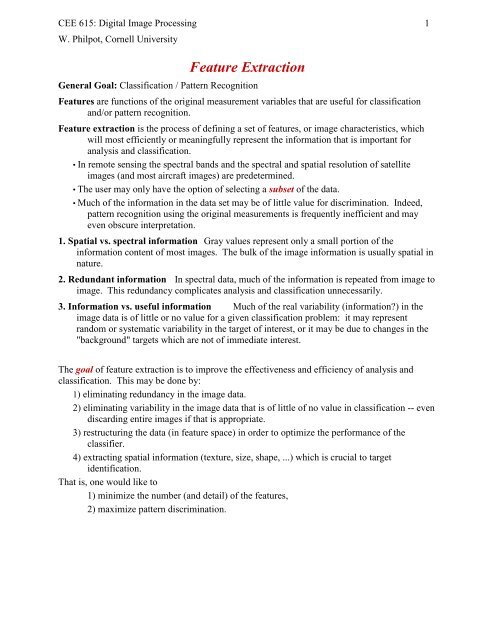
<strong>Feature</strong> <strong>Extraction</strong><br />
General Goal: Classification / Pattern Recognition<br />
<strong>Feature</strong>s are functions of the original measurement variables that are useful for classification<br />
and/or pattern recognition.<br />
<strong>Feature</strong> extraction is the process of defining a set of features, or image characteristics, which<br />
will most efficiently or meaningfully represent the information that is important for<br />
analysis and classification.<br />
• In remote sensing the spectral bands and the spectral and spatial resolution of satellite<br />
images (and most aircraft images) are predetermined.<br />
• The user may only have the option of selecting a subset of the data.<br />
• Much of the information in the data set may be of little value for discrimination. Indeed,<br />
pattern recognition using the original measurements is frequently inefficient and may<br />
even obscure interpretation.<br />
1. Spatial vs. spectral information Gray values represent only a small portion of the<br />
information content of most images. The bulk of the image information is usually spatial in<br />
nature.<br />
2. Redundant information In spectral data, much of the information is repeated from image to<br />
image. This redundancy complicates analysis and classification unnecessarily.<br />
3. Information vs. useful information Much of the real variability (information?) in the<br />
image data is of little or no value for a given classification problem: it may represent<br />
random or systematic variability in the target of interest, or it may be due to changes in the<br />
"background" targets which are not of immediate interest.<br />
The goal of feature extraction is to improve the effectiveness and efficiency of analysis and<br />
classification. This may be done by:<br />
1) eliminating redundancy in the image data.<br />
2) eliminating variability in the image data that is of little of no value in classification -- even<br />
discarding entire images if that is appropriate.<br />
3) restructuring the data (in feature space) in order to optimize the performance of the<br />
classifier.<br />
4) extracting spatial information (texture, size, shape, ...) which is crucial to target<br />
identification.<br />
That is, one would like to<br />
1) minimize the number (and detail) of the features,<br />
2) maximize pattern discrimination.
CEE 615: Digital Image Processing 2<br />
W. Philpot, <strong>Cornell</strong> <strong>University</strong><br />
Spatial pattern ==> shape, size, position, orientation, texture, ...<br />
In considering spatial pattern will concentrate on texture as the primary feature of interest.<br />
- shape, size, position, orientation are not terribly consistent in much of remote sensing<br />
(forest, agricultural fields, ...)<br />
- texture is one of the more important features in visual pattern recognition<br />
Comments:<br />
• No formal, universally accepted definition of texture exists.<br />
• Yet texture is intuitively recognizable and is an attribute that is crucial in<br />
photointerpretation.<br />
• Texture is usually described in very qualitative terms:<br />
smooth, uniform, flat - coarse, grainy<br />
even - uneven<br />
regular - irregular<br />
periodic - random<br />
Smoothing + thresholding<br />
Smoothing + gradient<br />
Gradient + smoothing
CEE 615: Digital Image Processing 3<br />
W. Philpot, <strong>Cornell</strong> <strong>University</strong><br />
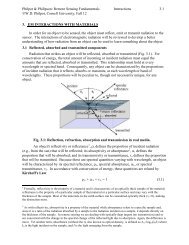
<strong>Spectral</strong> <strong>Feature</strong> <strong>Extraction</strong><br />
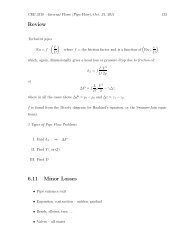
Band (color) space vs. <strong>Feature</strong> space<br />
band 3<br />
texture feature<br />
band 1<br />
band 2<br />
Band (color) space<br />
band 1<br />
Single image operations<br />
• For a single image, "spectral" feature extraction refers to<br />
selecting a gray value or a range of gray values.<br />
• This is done by compressing the data in some manner<br />
(e.g., density slicing, thresholding, etc.) The result is a<br />
smaller feature space.<br />
• The ultimate in simplicity is a binary image (1-bit). The<br />
binary image identifies only the presence of absence<br />
of a single feature (e.g., water, clouds)<br />
band 2/band 3<br />
<strong>Feature</strong> space<br />
1-D histogram<br />
1-dimensional image histogram, h(k), maps the<br />
frequency of occurrence of a gray value, k, in an image.<br />
1-D pdf<br />
1-dimensional image histogram, h(k), maps the<br />
frequency of occurrence of a gray value, k, in an image.<br />
The probability density function (pdf), specifies the<br />
probability that a pixel picked at<br />
random from the image will have a<br />
particular gray value.<br />
p(k) ≈ h(k)/N<br />
where N = # pixels in the image
CEE 615: Digital Image Processing 4<br />
W. Philpot, <strong>Cornell</strong> <strong>University</strong><br />
2-D histogram & pdf<br />
A 2-dimensional histogram, h(k 1 ,k 2 ) is a count of the # of pixels having a gray value of k 1 in<br />
band 1 and a value of k 2 in band 2.<br />
A 2-dimensional probability density function, p(k 1 ,k 2 ) represents the frequency with which<br />
pixels have a gray value of k 1 in band 1 and a value of k 2 in band 2:<br />
p(k) = p(k 1 , k 2 ) = h(k 1 , k 2 )/N<br />
where: p(k 1 , k 2 ) is the joint pdf, and<br />
k is a vector<br />
n-D pdf<br />
An n-dimensional probability density function, p(k) represents the frequency with which pixels<br />
have a particular set of gray values in an n-band image set:<br />
p(k) = p(k 1 , k 2 , … , k n ) = h(k)/N<br />
• Histograms contain NO spatial information<br />
• The size of a histogram is independent of the size of the image -- it depends only on the bit<br />
depth of the image.<br />
1. Selecting <strong>Spectral</strong> <strong>Feature</strong>s 2. Eliminate redundancy among variables
CEE 615: Digital Image Processing 5<br />
W. Philpot, <strong>Cornell</strong> <strong>University</strong><br />
3. Algebraic Operations<br />
Algebraic operations produce a single output image as a result of a pixel-by-pixel sum,<br />
difference, product or quotient of two or more input images.<br />
Note: input images must be accurately registered.<br />
Concepts: 2-Dimensional histogram<br />
Image addition - tends to extract information that is positively correlated from image to image.<br />
Removes information that is uncorrelated from image to image. The output image gray value, k',<br />
is given by:<br />
k' = a 0 + a 1 k 1 + a 2 k 2 + . . . + a n k n<br />
where:<br />
k i = the gray value of a pixel in the i th image.<br />
a i = weighting coefficient for the i th image with a i > 0<br />
• Addition is often applied to data when the important information is correlated from band to<br />
band.<br />
• If the uncorrelated information is random noise, addition will tend to remove the random<br />
noise.<br />
• If the data are not noisy and image 1 and image 2 are different spectral bands, then:<br />
uncorrelated data ==> "color" information<br />
correlated data ==> intensity information.<br />
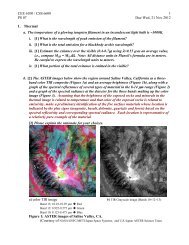
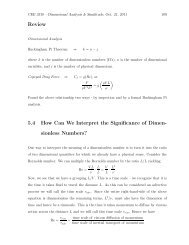
Example 1: Removal of random noise:<br />
If k 1 is the gray value of an image<br />
contaminated with random noise, then we<br />
might write:<br />
k 1 = k 0 + n 1<br />
signal+ noise<br />
Note that k 0 > 0 ; n 0 may be positive or<br />
negative. Similarly, for a second image of<br />
the same scene:<br />
k 2 = k 0 + n 2<br />
Taking the average value of the two images gives:<br />
Figure 1. Telescope photograph of a galaxy<br />
1 1<br />
k' = ( k + k ) = k + ( n + n )<br />
1 2 0 1 2<br />
2 2<br />
Generalizing to the case when t images of the same scene are available:<br />
1 1<br />
k' = ( k + k + + k ) = k + ( n + n + + n )<br />
1 2 n 0 1 2 t<br />
2 t<br />
Since n i may be positive or negative with a randomly varying magnitude,<br />
1<br />
noise = ( n + n + + n ) →0 as t →∞<br />
1 2 t<br />
t
CEE 615: Digital Image Processing 6<br />
W. Philpot, <strong>Cornell</strong> <strong>University</strong><br />
Example 2: <strong>Spectral</strong> Addition:<br />
Adding gray values from different spectral bands.<br />
2-band case: k' = a 0 + a 1 k 1 + a 2 k 2<br />
• The vector, a = (a 1 ,a 2 ), defines the direction of changing gray value.<br />
• The coefficients may be defined by choosing<br />
(k 11 , k 21 ) => k min = minimum gray value in the new image, and<br />
(k 12 , k 22 ) => k max = maximum gray value in the new image.<br />
The coefficients are:<br />
a 2 = m a 1 where: m = slope of the best fit straight line.<br />
= (k 22 -k 21 )/(k 12 -k 11 )<br />
a<br />
1<br />
=<br />
k<br />
max<br />
− k<br />
min<br />
( k − k ) + m( k − k )<br />
12 11 22 21<br />
a 0 = k min – a 1 (k 11 + m k 21 )<br />
• <strong>Spectral</strong> addition can be regarded as a partitioning of the measurement space.<br />
• The space is partitioned into plane-parallel regions which are perpendicular to the direction<br />
of the coefficient vector a = (a 1 , a 2 ).<br />
• Intensity information extraction will be optimized if the coefficient vector, is parallel to the<br />
direction of correlation.
CEE 615: Digital Image Processing 7<br />
W. Philpot, <strong>Cornell</strong> <strong>University</strong><br />
Image subtraction<br />
Image subtraction - tends to extract information that is uncorrelated (or negatively correlated<br />
from image to image. The output image gray value, k', is given by:<br />
k' = a 1 k 1 + a 2 k 2<br />
where: k 1,k 2 = gray values of pixel in image 1 & 2.<br />
a 1,a 2 = weighting coefficients, with<br />
a 1 > 0 and a 2 < 0<br />
(or vice versa)<br />
• Subtraction is often applied to data when the important information is uncorrelated from<br />
band to band.<br />
• For two different spectral bands, uncorrelated<br />
information is the spectral (color) difference<br />
between the two images.<br />
• If the two images collected at two different times,<br />
the uncorrelated information represents the<br />
temporal difference between the two images.<br />
Motion<br />
detection<br />
Castleman (1979) Digital Image Processing<br />
Motion detection (capillaries)<br />
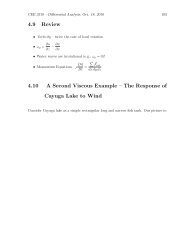
Subtraction: Change detection<br />
difference image threshold image<br />
Moik (1980) Digital Processing of Remotely Sensed Images
CEE 615: Digital Image Processing 8<br />
W. Philpot, <strong>Cornell</strong> <strong>University</strong><br />
<strong>Spectral</strong> Differencing (subtraction)<br />
Subtracting gray values from different spectral bands.<br />
k' = a 0 + a 1 k 1 + a 2 k 2<br />
• The vector, a = (a 1 ,a 2 ), defines the direction of changing gray value: a 2 = m a 1<br />
• The coefficients may be defined by choosing<br />
(k 11 , k 21 ) => k min = minimum gray value in the new image, and<br />
(k 12 , k 22 ) => k max = maximum gray value in the new image.<br />
The coefficients are given by:<br />
a 2 = m a 1<br />
where:<br />
m = slope of a line parallel to a<br />
a<br />
1<br />
=<br />
k<br />
max<br />
− k<br />
min<br />
( k − k ) + m( k − k )<br />
12 11 22 21<br />
a 0 = k min – a 1 (k 11 + m k 21 )<br />
k min = a 0 + a 1 k 11 + a 2 k 21<br />
k max = a 0 + a 1 k 12 + a 2 k 22<br />
• <strong>Spectral</strong> differencing is another partitioning of the measurement space.<br />
• The space is partitioned into plane-parallel regions which are perpendicular to the direction<br />
of the coefficient vector a = (a 1 , a 2 ).<br />
• Color information extraction will be optimized if the coefficient vector, is perpendicular<br />
to the direction of highest correlation.<br />
Band 1 Band 2 Band 2 – Band 1<br />
• Pixels that are bright in the difference image are brighter in band 2.<br />
• Pixels that are dark in the difference image are brighter in band 1.<br />
• Gray indicates little or no color change.
CEE 615: Digital Image Processing 9<br />
W. Philpot, <strong>Cornell</strong> <strong>University</strong><br />
Image ratioing (division)<br />
• Ratioing tends to extract information that is uncorrelated from image to image.<br />
• Ideally, ratioing adjusts for differences in intensity while emphasizing color differences.<br />
• The output image gray value, k o , is given by:<br />
k 0 = ak 1 /k 2<br />
where: k 1 , k 2 = gray value for image 1 and image 2, respectively<br />
a = coefficient<br />
• Ratioing partitions measurement space into radial segments.<br />
• A simple ratio will partition the space into unequal radial segments which emanate from an<br />
origin at (0,0).<br />
• The implicit assumption is that (0,0) represents black (zero intensity) and that distance<br />
from (0,0) corresponds to an increase in intensity.<br />
Consider the assumption that:<br />
- (0,0) represents black (zero intensity) and that<br />
- distance from (0,0) corresponds to an increase in intensity.<br />
• In remote sensing imagery this is frequently not the case,<br />
largely due to atmospheric effects on the observed<br />
radiation. The true zero intensity point is usually offset in<br />
measurement space.<br />
• It would also be more effective to make the partitioning<br />
uniform<br />
A reasonable scaling is given by:<br />
⎡ ⎛ ⎞ ⎤<br />
min ⎥<br />
⎣ ⎝ ⎠ ⎦<br />
n − n<br />
f 0 −1<br />
k − b<br />
2 2<br />
k ' = tan<br />
−θ<br />
( θ −θ )<br />
⎢ ⎜ ⎟<br />
k −b<br />
max min 1 1<br />
where:<br />
q min = minimum angle<br />
q max = maximum angle<br />
n f = maximum gray value in output image (usually 255)<br />
n 0 = minimum gray value in output image (usually 0)<br />
b 1 , b 0 = offsets of the zero-intensity point in measurement space.