View this Presentation (PDF 6.03 MB) - Finning International Inc.
View this Presentation (PDF 6.03 MB) - Finning International Inc.
View this Presentation (PDF 6.03 MB) - Finning International Inc.

Create successful ePaper yourself
Turn your PDF publications into a flip-book with our unique Google optimized e-Paper software.
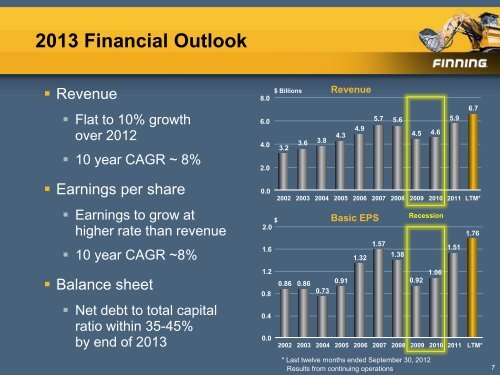
2013 Financial Outlook<br />
• Revenue<br />
• Flat to 10% growth<br />
over 2012<br />
• 10 year CAGR ~ 8%<br />
• Earnings per share<br />
• Earnings to grow at<br />
higher rate than revenue<br />
• 10 year CAGR ~8%<br />
• Balance sheet<br />
• Net debt to total capital<br />
ratio within 35-45%<br />
by end of 2013<br />
8.0<br />
6.0<br />
4.0<br />
2.0<br />
0.0<br />
$<br />
2.0<br />
1.6<br />
1.2<br />
0.8<br />
0.4<br />
0.0<br />
$ Billions<br />
3.2<br />
Revenue<br />
2002 2003 2004 2005 2006 2007 2008 2009 2010 2011 LTM*<br />
0.86 0.86<br />
3.6 3.8<br />
0.73<br />
4.3<br />
4.9<br />
Basic EPS<br />
0.91<br />
1.32<br />
5.7 5.6<br />
1.57<br />
1.38<br />
4.5 4.6<br />
Recession<br />
0.92<br />
2002 2003 2004 2005 2006 2007 2008 2009 2010 2011 LTM*<br />
* Last twelve months ended September 30, 2012<br />
Results from continuing operations<br />
1.06<br />
5.9<br />
1.51<br />
6.7<br />
1.76<br />
7