PDF, 4MB - Panalpina Annual Report 2012
PDF, 4MB - Panalpina Annual Report 2012
PDF, 4MB - Panalpina Annual Report 2012

You also want an ePaper? Increase the reach of your titles
YUMPU automatically turns print PDFs into web optimized ePapers that Google loves.
Financial <strong>Report</strong><br />
Consolidated Financial Statements<br />
111<br />
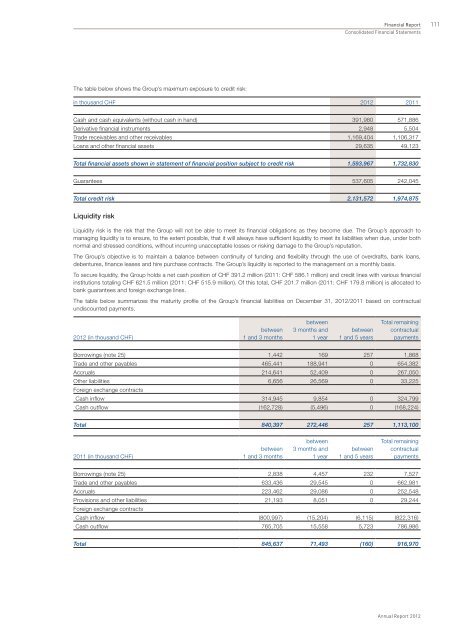
The table below shows the Group’s maximum exposure to credit risk:<br />
in thousand CHF <strong>2012</strong> 2011<br />
Cash and cash equivalents (without cash in hand) 391,980 571,886<br />
Derivative financial instruments 2,948 5,504<br />
Trade receivables and other receivables 1,169,404 1,106,317<br />
Loans and other financial assets 29,635 49,123<br />
Total financial assets shown in statement of financial position subject to credit risk 1,593,967 1,732,830<br />
Guarantees 537,605 242,045<br />
Total credit risk 2,131,572 1,974,875<br />
Liquidity risk<br />
Liquidity risk is the risk that the Group will not be able to meet its financial obligations as they become due. The Group’s approach to<br />
managing liquidity is to ensure, to the extent possible, that it will always have sufficient liquidity to meet its liabilities when due, under both<br />
normal and stressed conditions, without incurring unacceptable losses or risking damage to the Group’s reputation.<br />
The Group’s objective is to maintain a balance between continuity of funding and flexibility through the use of overdrafts, bank loans,<br />
de bentures, finance leases and hire purchase contracts. The Group’s liquidity is reported to the management on a monthly basis.<br />
To secure liquidity, the Group holds a net cash position of CHF 391.2 million (2011: CHF 586.1 million) and credit lines with various finan cial<br />
institutions totaling CHF 621.5 million (2011: CHF 515.9 million). Of this total, CHF 201.7 million (2011: CHF 179.8 million) is allocated to<br />
bank guarantees and foreign exchange lines.<br />
The table below summarizes the maturity profile of the Group’s financial liabilities on December 31, <strong>2012</strong>/2011 based on contractual<br />
un discounted payments.<br />
<strong>2012</strong> (in thousand CHF)<br />
between<br />
1 and 3 months<br />
between<br />
3 months and<br />
1 year<br />
between<br />
1 and 5 years<br />
Total remaining<br />
contractual<br />
payments<br />
Borrowings (note 25) 1,442 169 257 1,868<br />
Trade and other payables 465,441 188,941 0 654,382<br />
Accruals 214,641 52,409 0 267,050<br />
Other liabilities 6,656 26,569 0 33,225<br />
Foreign exchange contracts<br />
Cash inflow 314,945 9,854 0 324,799<br />
Cash outflow (162,728) (5,496) 0 (168,224)<br />
Total 840,397 272,446 257 1,113,100<br />
2011 (in thousand CHF)<br />
between<br />
1 and 3 months<br />
between<br />
3 months and<br />
1 year<br />
between<br />
1 and 5 years<br />
Total remaining<br />
contractual<br />
payments<br />
Borrowings (note 25) 2,838 4,457 232 7,527<br />
Trade and other payables 633,436 29,545 0 662,981<br />
Accruals 223,462 29,086 0 252,548<br />
Provisions and other liabilities 21,193 8,051 0 29,244<br />
Foreign exchange contracts<br />
Cash inflow (800,997) (15,204) (6,115) (822,316)<br />
Cash outflow 765,705 15,558 5,723 786,986<br />
Total 845,637 71,493 (160) 916,970<br />
<strong>Annual</strong> <strong>Report</strong> <strong>2012</strong>