
You also want an ePaper? Increase the reach of your titles
YUMPU automatically turns print PDFs into web optimized ePapers that Google loves.
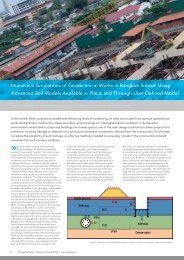
<strong>Plaxis</strong> Practice<br />
Seabed instability and 3D FE jack-up soil-structure<br />
interaction analysis<br />
Continuation<br />
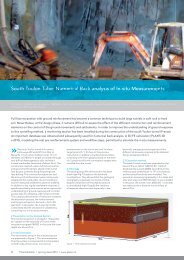
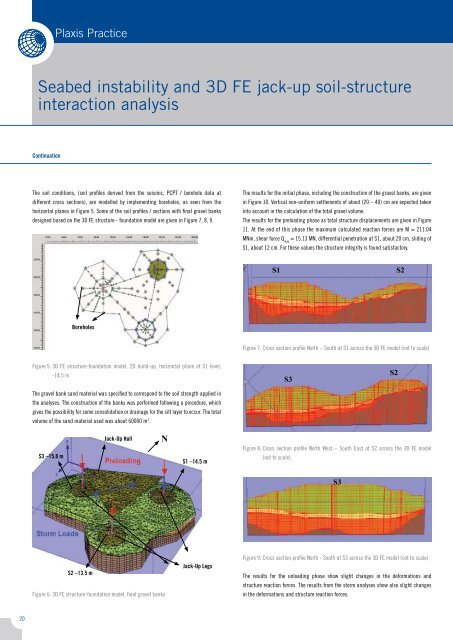
The soil conditions, (soil profiles derived from the seismic, PCPT / borehole data at<br />
different cross sections), are modelled by implementing boreholes, as seen from the<br />
horizontal planes in Figure 5. Some of the soil profiles / sections with final gravel banks<br />
designed based on the 3D FE structure - foundation model are given in Figure 7, 8, 9.<br />
The results for the initial phase, including the construction of the gravel banks, are given<br />
in Figure 10. Vertical non-uniform settlements of about (20 – 40) cm are expected taken<br />
into account in the calculation of the total gravel volume.<br />
The results for the preloading phase as total structure displacements are given in Figure<br />
11. At the end of this phase the maximum calculated reaction forces are M = 211.04<br />
MNm, shear force Q max<br />
= 15.13 MN, differential penetration at S1, about 20 cm, sliding of<br />
S1, about 12 cm. For these values the structure integrity is found satisfactory.<br />
S1<br />
S2<br />
Boreholes<br />
Figure 7: Cross section profile North – South at S1 across the 3D FE model (not to scale)<br />
Figure 5: 3D FE structure-foundation model, 2D build-up, horizontal plane at S1 level,<br />
-14.5 m<br />
The gravel bank sand material was specified to correspond to the soil strength applied in<br />
the analyses. The construction of the banks was performed following a procedure, which<br />
gives the possibility for some consolidation or drainage for the silt layer to occur. The total<br />
volume of the sand material used was about 60000 m 3 .<br />
S3<br />
S2<br />
S3 –15.8 m<br />
Jack-Up Hull<br />
N<br />
S1 –14.5 m<br />
Figure 8: Cross section profile North West – South East at S2 across the 3D FE model<br />
(not to scale)<br />
S3<br />
S2 –13.5 m<br />
Figure 6: 3D FE structure-foundation model, final gravel banks<br />
Jack-Up Legs<br />
Figure 9: Cross section profile North - South at S3 across the 3D FE model (not to scale)<br />
The results for the unloading phase show slight changes in the deformations and<br />
structure reaction forces. The results from the storm analyses show also slight changes<br />
in the deformations and structure reaction forces.<br />
20