
Create successful ePaper yourself
Turn your PDF publications into a flip-book with our unique Google optimized e-Paper software.
<strong>Plaxis</strong> finite element code for soil and rock analyses<br />
<strong>Plaxis</strong> <strong>Bulletin</strong><br />
issue <strong>24</strong> / October <strong>2008</strong><br />
Capacity Analysis of Suction Anchors<br />
in Clay by <strong>Plaxis</strong> 3D Foundation<br />
On Stability Analysis of Slurry-Wall Trenches<br />
Seabed instability and 3D FE jack-up<br />
soil-structure interaction analysis
Colophon<br />
Editorial<br />
New Developments<br />
<strong>Plaxis</strong> Practice<br />
Capacity Analysis of<br />
Suction Anchors in Clay<br />
by <strong>Plaxis</strong> 3D Foundation<br />
<strong>Plaxis</strong> Practice<br />
On Stability Analysis<br />
of Slurry-Wall Trenches<br />
<strong>Plaxis</strong> Practice<br />
Seabed instability and 3D<br />
FE jack-up soil-structure<br />
interaction analysis<br />
Recent Activities<br />
Activities <strong>2008</strong> - 2009<br />
3<br />
4<br />
5<br />
10<br />
16<br />
22<br />
<strong>24</strong><br />
The <strong>Plaxis</strong> <strong>Bulletin</strong> is the combined magazine of <strong>Plaxis</strong> B.V. and the <strong>Plaxis</strong> Users<br />
Association (NL). The <strong>Bulletin</strong> focuses on the use of the finite element method in geotechnical<br />
engineering practise and includes articles on the practical application of the <strong>Plaxis</strong><br />
programs, case studies and backgrounds on the models implemented in <strong>Plaxis</strong>.<br />
The <strong>Bulletin</strong> offers a platform where users of <strong>Plaxis</strong> can share ideas and experiences with<br />
each other. The editors welcome submission of papers for the <strong>Plaxis</strong> <strong>Bulletin</strong> that fall in<br />
any of these categories.<br />
The manuscript should preferably be submitted in an electronic format, formatted as<br />
plain text without formatting. It should include the title of the paper, the name(s) of the<br />
authors and contact information (preferably email) for the corresponding author(s). The<br />
main body of the article should be divided into appropriate sections and, if necessary,<br />
subsections. If any references are used, they should be listed at the end of the article.<br />
The author should ensure that the article is written clearly for ease of reading.<br />
In case figures are used in the text, it should be indicated where they should be placed<br />
approximately in the text. The figures themselves have to be supplied separately from the<br />
text in a common graphics format (e.g. tif, gif, png, jpg, wmf, cdr or eps formats are all<br />
acceptable). If bitmaps or scanned figures are used the author should ensure that they<br />
have a resolution of at least 300 dpi at the size they will be printed. The use of colour in<br />
figures is encouraged, as the <strong>Plaxis</strong> <strong>Bulletin</strong> is printed in full-colour.<br />
Any correspondence regarding the <strong>Plaxis</strong> <strong>Bulletin</strong> can be sent by email to<br />
bulletin@plaxis.nl<br />
or by regular mail to:<br />
<strong>Plaxis</strong> <strong>Bulletin</strong><br />
c/o Erwin Beernink<br />
PO Box 572<br />
2600 AN Delft<br />
The Netherlands<br />
The <strong>Plaxis</strong> <strong>Bulletin</strong> has a total circulation of 15.000 copies and is distributed worldwide.<br />
Editorial Board:<br />
Wout Broere<br />
Ronald Brinkgreve<br />
Erwin Beernink<br />
Arny Lengkeek<br />
2
Editorial<br />
Ronald Brinkgreve<br />
A new <strong>Plaxis</strong> <strong>Bulletin</strong> is in front of you, with interesting articles about <strong>Plaxis</strong> applications,<br />
new developments and a full agenda of activities. We are also pleased to announce<br />
that new <strong>Plaxis</strong> products have been released, which are the 2D version 9.0,<br />
3D Foundation 2.2 and <strong>Plaxis</strong>-GiD. The latter is a general CAD-like 3D pre-processor<br />
which has been configured to address the <strong>Plaxis</strong> calculation kernel.<br />
Regarding ‘<strong>Plaxis</strong> Practice’, it is interesting to see that all three articles involve 3D calculations.<br />
Hence, there is a clear trend to perform 3D calculations, at least for complex<br />
geo-engineering projects. At the same time, the use of 2D FEM is still increasing, since<br />
<strong>Plaxis</strong> 2D is used more and more for daily geotechnical design.<br />
The first article describes an evaluation of suction anchor bearing capacity with the 3D<br />
Foundation program. In general, 3D models are not as accurate as 2D models. As a result,<br />
ultimate limit states (such as safety factors or bearing capacities) may be overestimated.<br />
It is demonstrated that interface elements play a crucial role in the accurate<br />
prediction of the suction anchor bearing capacity.<br />
The second article involves the stability analysis of slurry wall trenches. The situation is<br />
during construction is clearly three-dimensional. In addition to safety factor analysis, the<br />
authors describe a probabilistic design method. The results seem to be in good agreement<br />
with the geo-engineering practice.<br />
In the third article a 3D analysis of a complex offshore foundation is described. Instability<br />
of the seabed is an important issue here. Gravel banks were proposed to stabilize the<br />
foundation. In the calculation different loading situations were considered. A good and<br />
stable solution could be obtained for the designed foundation. The structure has been<br />
build successfully and behaved well according to the predictions.<br />
Hereby we trust to have compiled again an interesting <strong>Plaxis</strong> bulletin for you. Do not hesitate<br />
to contact us with your response on one of the published articles, or with new articles<br />
for future <strong>Bulletin</strong>s. We are looking forward to receive many contributions.<br />
The Editors<br />
3
New Developments<br />
New Developments<br />
Ronald Brinkgreve<br />
in the previous <strong>Bulletin</strong> information was given about the <strong>Plaxis</strong> 3d developments. it is a<br />
pleasure to mention now that the first general 3d program (<strong>Plaxis</strong>-Gid) has been released.<br />
this program is available as a service to those who feel restricted by the geometrical<br />
limitations of 3d tunnel or 3d foundation. more information can be obtained from the<br />
<strong>Plaxis</strong> sales department.<br />
in this <strong>Bulletin</strong> i like to mention another new development that is currently in progress:<br />
fully coupled fl ow-deformation analysis.<br />
most <strong>Plaxis</strong> users are familiar with the consolidation option in <strong>Plaxis</strong> 2d and 3d. so far,<br />
<strong>Plaxis</strong> has only considered Biot coupled consolidation under saturated conditions, forming<br />
a coupling between deformation and excess pore pressures. this works well for cases with<br />
constant hydraulic conditions, where the time interval or loading rate is such that the<br />
situation is neither fully drained nor fully undrained. for cases with changing hydraulic<br />
conditions, a simplifi ed solution is available by combining the standard <strong>Plaxis</strong> program<br />
with the transient fl ow module Plaxflow. However, if pore pressure is influenced by loading<br />
of (partially) undrained soil as well as changing hydraulic conditions, there is a need for<br />
consolidation based on total pore pressures, i.e. fully coupled flow-deformation analysis.<br />
examples where this type of analyses is required are clay embankments in tidal areas or<br />
excavations with dewatering in medium soft soils.<br />
With the change of consolidation based on excess pore pressure to total pore pressure it<br />
becomes important to consider the phreatic surface and the unsaturated zone above. as a<br />
result of loading or changing hydraulic conditions, ground water flow may occur, and the<br />
position of the phreatic surface may change. soil that has been fully saturated may become<br />
unsaturated or vice versa. Hence, together with the implementation of fully coupled<br />
flow-deformation analysis, there is also need for models that can describe unsaturated<br />
soil behaviour in more detail. first of all, there are the Van Genuchten relationships between<br />
suction, relative permeability and degree of saturation, which are also used in<br />
Plaxflow. secondly, there is the well-known Barcelona Basic model that deals with suction<br />
and swelling in the unsaturated zone. all this is implemented in the <strong>Plaxis</strong> calculation<br />
kernel to complete the fully coupled flow-deformation analysis feature.<br />
these new features will be available in <strong>Plaxis</strong> 2d version 9.1, which is planned for release<br />
mid 2009. When the implementation is ready, we can start beta-testing with a selected<br />
group of users. after implementation in <strong>Plaxis</strong> 2d we will proceed with the implementation<br />
in the 3d calculation kernel. We are confident that the new features will help many users<br />
in analysing their coupled and unsaturated soil problems.<br />
ronald Brinkgreve<br />
<strong>Plaxis</strong> bv<br />
4
<strong>Plaxis</strong> Practice<br />
Capacity Analysis of Suction Anchors in Clay<br />
by <strong>Plaxis</strong> 3D Foundation<br />
Lars Andresen, PhD, NGI, Oslo, Norway<br />
Lewis Edgers, PhD, PE, Tufts University, Medford, MA USA<br />
Hans Petter Jostad, PhD, NGI, Oslo, Norway<br />
Introduction<br />
This article describes the use of <strong>Plaxis</strong> 3D Foundation v. 2.1 (<strong>Plaxis</strong>, <strong>2008</strong>) to compute<br />
the undrained capacity of a suction anchor in clay. The objective of this study was to<br />
evaluate the performance of <strong>Plaxis</strong> 3D Foundation for analyzing this particular problem<br />
by comparing the <strong>Plaxis</strong> 3D Foundation results with results from other software including<br />
<strong>Plaxis</strong> 2D and NGI in-house codes. The effects of mesh fineness, use of interface elements<br />
and the wall roughness on the calculated capacity were also studied. There are several<br />
other aspects in the design of skirted anchors in clay which is not covered in this article.<br />
The reader is referred to Andersen and Jostad (1999). A particular issue that this study<br />
focused on was use of interface elements adjacent to cylindrical suction anchors. The lack<br />
of isoparametric interface elements in the 2.1 version of <strong>Plaxis</strong> 3D Foundation is known to<br />
introduce some error to problems where curved soil-structure interfaces are defined by the<br />
volume pile generator. This issue is described in the “Known issue <strong>Plaxis</strong> 3D Foundation<br />
version 2.1” (www.plaxis.nl).<br />
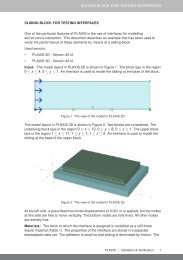
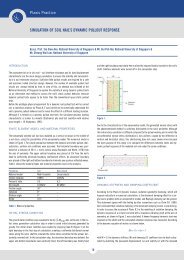
Description of the Problem Considered<br />
Figure 1 illustrates the cylindrical suction anchor analyzed in this study. It is one of<br />
the four hypothetical capacity cases presented by Andersen et al (2005) in an industry<br />
sponsored study on the design and analyses of suction anchors in soft clays. The anchor<br />
was assumed to have a closed top, no tension crack on the active (windward) side and to<br />
be very stiff compared to the soil. The load was attached at the optimal load attachment<br />
point at depth z p<br />
to produce a failure corresponding to pure translation, i.e. maximum<br />
capacity is obtained when there is no rotation of the anchor.<br />
The soil was assumed to be a normally consolidated clay with an average undrained<br />
strength increasing linearly with depth as follows:<br />
s u<br />
(kPa) = 1.25 ·z (m)<br />
A strength intercept at the surface of 0.1 kPa was used. The soil was modeled as an<br />
undrained, cohesive linear elastic- perfectly plastic (Tresca) material. In <strong>Plaxis</strong>, we used<br />
H = 7 .5 m<br />
int<br />
D = 5 m<br />
Clo sed<br />
top<br />
W' = 300 kN<br />
Figure 1: Description of the Suction Anchor Problem<br />
z p<br />
int<br />
F max = ?<br />
???<br />
the Mohr-Coulomb strength model with the friction and dilatancy angles equal to zero<br />
(φ = ψ = 0), cohesion equal to the undrained strength (c = s u<br />
), and no tensile cut-off<br />
strength.<br />
The anchor was modeled by linear elastic wall elements with a high stiffness making<br />
them virtually rigid. Because the governing failure mechanisms do not involve the soil<br />
plug inside the anchor, this soil plug was modeled as a stiff, elastic material. For all the<br />
FE-models in this study we have used interface elements along the outside skirt walls.<br />
These elements are used to improve the results by allowing for slip between the anchor<br />
wall and the soil, and to model a possibly reduced strength s u<br />
, int<br />
= α int·s u<br />
along the outside<br />
skirt walls to account for reduced soil strength due to effects of the anchor installation.<br />
Recommended values of α int<br />
for design situations are given in Andersen and Jostad (2002)<br />
and results from centrifuge testing are presented in Chen and Randolph (2006).<br />
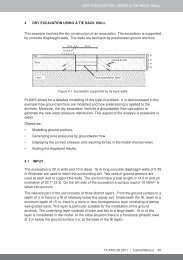
Plane Strain Analyses<br />
The suction anchor on Figure 1 was first analyzed as a plane strain problem using both<br />
<strong>Plaxis</strong> 2D and <strong>Plaxis</strong> 3D Foundation. The objective was to compare results from <strong>Plaxis</strong> 3D<br />
Foundation with the well established 2D code and to the readily available hand calculated<br />
capacity. An extensive study of the discretization error was also performed. Computations<br />
were made with both the 6- and 15-noded elements available in <strong>Plaxis</strong> 2D.<br />
Horizontal interface elements were used along the soil-soil contact underneath the anchor<br />
tip in addition to along the outside skirt wall. The vertical and horizontal interfaces were<br />
extended 0.2·D outside the anchor. This was to allow possibly full slip around the bottom<br />
corners of the anchor. A wall interface factor α int<br />
of 0.65 was used along the outside<br />
skirt while full interface strength (α int<br />
= 1.0) was used under the anchor tip and for the<br />
interface extensions. The load was applied horizontally at a depth (z p<br />
) of 5 m. The in-plane<br />
width D of the anchor was 5 m.<br />
Figure 2 presents the deformed mesh (displacements scaled up 5 times) at the end of<br />
one analysis i.e. at ultimate capacity, from a <strong>Plaxis</strong> 2D plane strain computation. A well<br />
defined failure surface forms on both the active and passive sides and the suction anchor<br />
translates horizontally.<br />
This mesh with approximately ~5000 15-noded elements (~40 000 nodes) illustrates the<br />
degree of mesh refinement necessary for accurate computations although many fewer<br />
elements could have been used within the suction anchor. The effect of mesh fineness and<br />
element type on the computed suction anchor capacity is further illustrated by Figure 3.<br />
More than 40 000 nodes are required for convergence to a capacity of 228 kN/m. However,<br />
a mesh with only about 10 000 nodes (15-noded elements) produces an ultimate capacity<br />
of 230 kN/m, only 1 % higher than the more accurate value. The discretization error<br />
increases dramatically for meshes with less than 5000 nodes (2500 elements). Figure 3<br />
also illustrates that the 6-noded elements produced suction anchor capacities very close<br />
to those with the 15-noded elements provided the mesh is refined to have approximately<br />
the same number of nodes.<br />
5
<strong>Plaxis</strong> Practice<br />
Capacity Analysis of Suction Anchors in Clay<br />
by <strong>Plaxis</strong> 3D Foundation<br />
Continuation<br />
suction anchor translates horizontally. The mesh shown has ~6700 15-noded wedge<br />
elements (~28 000 nodes) and provides a capacity of 233 kN/m for α int<br />
= 0.65. Increasing<br />
the number of nodes to 80 000 gave nearly the same capacity, while decreasing the<br />
number of nodes to less than 10 000 dramatically increased capacity and thus the<br />
discretization error. The results from the mesh sensitivity study are shown in Figure 5.<br />
As for the 2D calculation the failure mechanism involves a cut-off (thin shear band) at<br />
the anchor tip level. It is therefore important to use a thin row of elements at this level to<br />
avoid an artificially deeper failure mechanism. This can be enforced by using additional<br />
work planes at this depth.<br />
Figure 2: <strong>Plaxis</strong> 2D Plane Strain Deformed Mesh at the End of the Analysis (α int = 0.65)<br />
F max, kN/m<br />
255<br />
250<br />
<strong>24</strong>5<br />
, kN/m <strong>24</strong>0<br />
F max<br />
235<br />
230<br />
225<br />
6-noded elements<br />
15-noded elements<br />
0 20000 40000 60000 80000<br />
Number of nodes<br />
Figure 4: <strong>Plaxis</strong> 3D Foundation Plane Strain Deformed Mesh at the End of the Analysis<br />
(α int = 0.65)<br />
Figure 3: The Effects of Mesh Fineness and Element Type on Computed Suction Anchor<br />
Capacity – <strong>Plaxis</strong> 2D Plane Strain Analyses<br />
2 5 0<br />
2 4 5<br />
alpha=0.65<br />
alpha =1<br />
The next series of computations utilized <strong>Plaxis</strong> 3D Foundation to analyze the plane strain<br />
problem discussed above as a first step in comparing its performance with <strong>Plaxis</strong> 2D.<br />
Only one element was used in the out-of-plane direction. This was obtained by using a<br />
small thickness of 0.25 m in that direction. The 3D mesh has vertical interfaces along<br />
the outside walls with extensions underneath the anchor tip but no horizontal interfaces<br />
at the anchor tip level.<br />
F max, kN/m<br />
2 4 0<br />
2 3 5<br />
Fmax, kN/m<br />
2 3 0<br />
2 2 5<br />
Interface extension can be provided by deactivated wall extension. Figure 4 shows<br />
a deformed mesh (displacements scaled up 5 times) at the end of the analysis i.e. at<br />
ultimate capacity from a <strong>Plaxis</strong> 3D Foundation plane strain computation. A well defined<br />
failure surface, similar to the failure surface in Figure 2 for the 2D run, forms and the<br />
0 1 0 0 0 0 2 0 0 0 0 3 0 0 0 0 4 0 0 0 0 5 0 0 0 0 6 0 0 0 0 7 0 0 0 0 8 0 0 0 0<br />
N um be r of node s<br />
Figure 5: The Effects of Mesh Fineness on Plane Strain Suction Anchor Capacity – <strong>Plaxis</strong><br />
3D Foundation<br />
6
<strong>Plaxis</strong> Practice<br />
Discussion of the Plane Strain Analyses<br />
table 1 compares the plane strain suction anchor capacities computed by <strong>Plaxis</strong> 2d and<br />
3d as well as the capacities estimated by a hand-calculation based on classical earth<br />
pressure theory. the capacities of table 1 are all for the runs where the discretization error<br />
is negligible (> 30 000 nodes) and are all in reasonable agreement. the hand-calculation<br />
may have some small error because the earth pressure coefficient used is developed for a<br />
constant strength profi le while the case studied has a linearly increasing strength.<br />
discretization was used along the perimeter of the cylinder to reduce the “effective” pile<br />
diameter. figure 6 illustrates the geometry that was used for these analyses and the<br />
deformed mesh from one of the computations. the computed ultimate holding capacity<br />
for α int<br />
= 1.0 was 1870 kn for pure horizontal loading.<br />
the <strong>Plaxis</strong> 3d foundation capacities are about 2 % higher than the <strong>Plaxis</strong> 2d capacities,<br />
probably because of the lack of horizontal interface elements at the bottom of the<br />
suction anchor or because of the different element type. the higher wall interface factor<br />
(α int<br />
= 1.0) increases the capacities by about 5%.<br />
α int = 0.65 α int = 1.0<br />
Hand calculation 2<strong>24</strong> 232<br />
<strong>Plaxis</strong> 2d 228 239<br />
<strong>Plaxis</strong> 3d foundation 233 <strong>24</strong>4<br />
table 1: Horizontal Plane strain suction anchor capacities (kn/m)<br />
Three Dimensional Analyses<br />
<strong>Plaxis</strong> 3d foundation was then used to analyze a 5 m diameter cylindrical suction anchor.<br />
only half of the problem was represented in the fe model because of symmetry about the<br />
vertical plane in the direction of loading. this feature was important in creating a fine<br />
mesh and in reducing computation time. the half cylinder was generated with the volume<br />
pile generator. three rows of elements with thickness 0.1 m were generated beneath<br />
the anchor tip by using additional working planes. the mesh refinement studies with<br />
strategic refinement led to a mesh of ~26 600 elements and ~76 000 nodes. By plotting<br />
the capacity versus the number of nodes as for the 2d calculations it was found that the<br />
capacity nearly had converged to a constant value for a mesh with about 76 000 nodes,<br />
i.e. this mesh gave only a small discretization error. the load was applied at the optimal<br />
load attachment point which was found to be at a depth of approximately 5 m.<br />
as discussed in the “known issues” section of <strong>Plaxis</strong> 3d foundation 2.1, when using the<br />
Pile designer to generate circular piles, the resulting elements (volume elements, plate<br />
elements and interface elements) are not curved (isoparametric), but they have straight<br />
sides. the ultimate capacity may then be overestimated due to:<br />
- any given reduced (α int<br />
< 1.0) interface shear strength is not taken into effect because<br />
horizontal slip in the soil-structure contact is prevented.<br />
- the earliest possibility to yield is in the stress points of the adjacent soil volume<br />
elements outside the pile, which increases the effective pile diameter.<br />
therefore, full roughness (α int<br />
= 1.0) was used along the outside skirt walls and a fine<br />
figure 6: <strong>Plaxis</strong> 3d foundation Geometry model and deformed mesh at the end of the<br />
analysis - 5 m diameter suction anchor<br />
this computed capacity was compared with the capacity computed by HVmcap (nGi,<br />
2000) and the nGi in-house program BifUrc 3d (nGi, 1999). BifUrc 3d is a general<br />
purpose fe program, while HVmcap is a specially made windows program for design<br />
analyses of suction anchors, including the effects of reduced interface strength, anchor<br />
tilt, tension crack development at the active side, and shear strength anisotropy.<br />
HVmcap uses the BifUrc fe program as a calculation kernel. it is a plane model with<br />
the three dimensional effects modeled by displacement compatible shear stress factors<br />
(side shear) calibrated from full three dimensional fi nite element studies. the capacity<br />
computed by HVmcap for the same case as shown in figure 1 with α int<br />
= 1.0 was 1578<br />
to 1775 kn depending upon the range of values (between 0.5 and 1.0) assumed for<br />
the three dimensional side shear factors. the capacity computed by BifUrc 3d was<br />
1780 kn.<br />
to avoid the issue with the non-isoparametric elements for the cylindrical anchor,<br />
capacities were calculated also for a rectangular anchor having a cross-sectional area<br />
equivalent to a 5m diameter circle (3.93 m x 5 m with the 5m width normal to the loading<br />
direction). this is believed to be a very good approximation to a cylindrical anchor.<br />
Vertical interfaces were used along the outside walls and extended horizontally as shown<br />
in figure 7 to allow full slip around the anchor edges. thin rows of elements were also<br />
used underneath the anchor tip. the computed ultimate holding capacities for α int<br />
= 1.0<br />
was 1895 kn for pure horizontal loading.<br />
7
<strong>Plaxis</strong> Practice<br />
Capacity Analysis of Suction Anchors in Clay<br />
by <strong>Plaxis</strong> 3D Foundation<br />
Continuation<br />
despite a thorough investigation of the <strong>Plaxis</strong> 3d foundation results it has not been<br />
possible to identify with certainty what is the cause for the 5 % overshoot. it may be the<br />
lack of horizontal interfaces at the anchor tip level that prevents full slip underneath the<br />
skirts. for the cylindrical anchor the slightly increased “effective” radius, caused by the<br />
non-isoparametric interface elements may also contribute to a small overshoot, although<br />
a very fine mesh was used outside the skirt wall.<br />
figure 7: <strong>Plaxis</strong> 3d foundation Geometry model and deformed mesh at the end of the<br />
analysis - rectangular suction anchor<br />
Discussion of Three Dimensional Analyses<br />
table 2 presents the suction anchor capacities computed by <strong>Plaxis</strong> 3d foundation for the<br />
cylindrical and rectangular suction anchors and the capacities computed by HVmcap<br />
and BifUrc 3d. results for wall interface factor α int<br />
=0.65 and 1.0 are given, even if, as<br />
noted, it is known that for α < 1.0 <strong>Plaxis</strong> 3d foundation overestimates the capacity for<br />
the cylindrical anchor.<br />
the <strong>Plaxis</strong> 3d foundation capacity of 1870 kn for the 5 m diameter cylindrical anchor<br />
and 1895 kn for the area equivalent rectangular anchor, both with α int<br />
= 1.0, seem<br />
reasonable. the minor difference between the rectangular and the circular cross section<br />
anchors indicate that the area equivalent rectangle is a good approximation. However,<br />
the BifUrc3d results of 1780 kn and the upper bound value of 1775 kn from HVmcap is<br />
5 % less than the <strong>Plaxis</strong> 3d foundation result of 1870 kn. as there is no reason to believe<br />
that the fem produce capacities that are too low, this indicates that <strong>Plaxis</strong> 3d foundation<br />
slightly overestimates the capacity.<br />
the <strong>Plaxis</strong> 3d foundation result for α int<br />
= 0.65 of 1820 kn for the cylindrical anchor is<br />
significantly higher than for the equivalent area rectangular anchor and also significantly<br />
higher than the BifUrc 3d and HVmcap results. these results confirm that the linear <strong>Plaxis</strong><br />
3d foundation interface elements are too inflexible to model the soil-pile lateral slip along<br />
curved surfaces. later versions of <strong>Plaxis</strong> 3d foundation are expected to provide isoparametric,<br />
or curved interface elements, for more accurate modeling of curved interfaces .<br />
Non-Horizontal Loadings<br />
andersen et al (2005) compared calculation procedures for the undrained capacity for<br />
varying loading angles β. figure 8 summarizes results from the independent capacity<br />
calculations by three different organizations. the comparison of results from 3d fi nite<br />
element calculations carried out by norwegian Geotechnical institute (nGi), offshore<br />
technology research center (otrc) and the University of Western australia (UWa) serves<br />
as an excellent benchmark for evaluating the performance of <strong>Plaxis</strong> 3d foundation.<br />
a series of computations were made to evaluate the performance of <strong>Plaxis</strong> 3d foundation<br />
when the applied loads are not horizontal. these computations were made for the capacity<br />
of the 5 m diameter cylindrical suction anchor. However, an interface factor α int<br />
of 1.0<br />
was used for these computations to minimize the effects of non-isoparametric interface<br />
issues. all loadings were applied at the optimal loading point to produce a failure<br />
corresponding to pure translation.<br />
figure 8 compares the results of these <strong>Plaxis</strong> 3d foundation computations (α int<br />
= 1) with<br />
the benchmark 3d finite element results (α int<br />
= 0.65). <strong>Plaxis</strong> 3d foundation shows the<br />
same trends with varying load inclination as the other programs but as expected because<br />
of the higher interface factor computes higher capacities.<br />
Computation α int =0.65 α int = 1.0<br />
Plx 3DF Circle 5 m diameter 1820 (1) 1870<br />
NGi BiFURC3D FEM Circle 5 m diameter 1665 1780<br />
Plx 3DF Eqv. area rectangle 5 m x 3.93 m 1715 1895<br />
NGi HVMCap FEM “2D+side shear” 1463-1723 1578-1775<br />
(1)<br />
capacity is too high because of non-isoparametric formulation<br />
note that it is only in the lateral direction (z-x plane) that the non-isoparametric elements<br />
prevent slip. the interface elements should work well in the vertical direction, thus the<br />
capacity for pure vertical loading should not be overestimated. a <strong>Plaxis</strong> 3d foundation<br />
computation for α int<br />
= 0.65 and pure vertical loading produced a capacity of 2570 kn,<br />
completely consistent with the benchmark finite element analyses of figure 13. this<br />
agreement occurs because the interface issue described above has little or no effect for<br />
vertical suction anchor translation.<br />
table 2: Horizontal suction anchor capacities (kn)<br />
the recent update <strong>Plaxis</strong> 3df version 2.2 includes curved interfaces.<br />
8
<strong>Plaxis</strong> Practice<br />
Vertical Load (kN)<br />
3 0 0 0<br />
2 5 0 0<br />
2 0 0 0<br />
1 5 0 0<br />
Vertical 1 0 0 0Load (kN)<br />
5 0 0<br />
0<br />
NG I<br />
α int<br />
= 0.65<br />
UW A<br />
α int<br />
= 0.65<br />
O T RC<br />
α int<br />
= 0.65<br />
PL A X IS<br />
α int<br />
= 1<br />
0 5 0 0 1 0 0 0 1 5 0 0 2 0 0 0<br />
Ho r iz o n ta l L o a d ( kN)<br />
Figure 8:<br />
Comparison of <strong>Plaxis</strong> 3D Foundation and Benchmark Suction Anchor Computations for<br />
Non-horizontal Loadings after Andersen et al (2005) - 5 m diameter Suction Anchor.<br />
Conclusions<br />
For the plane strain computations<br />
- The <strong>Plaxis</strong> 2D and <strong>Plaxis</strong> 3D Foundation capacities agree within about 2 % and the<br />
<strong>Plaxis</strong> FE results also agree well with the hand calculation.<br />
- The discretization error always contributes to an overshoot for FE capacity analyses. It<br />
was demonstrated how this overshoot can be quantified by plotting the capacity versus<br />
the number of nodes. The error was made negligible by the use of interface elements<br />
and strategically refining the mesh.<br />
- The 6-noded elements of <strong>Plaxis</strong> 2D computed the same capacity as the 15-noded<br />
elements. However, the 6-noded elements require more mesh refinement so that there is<br />
at least an equal number of nodes.<br />
For the three-dimensional computations<br />
- <strong>Plaxis</strong> 3D Foundation provided a capacity for the 5 m diameter cylindrical suction<br />
anchor that is about 5 % higher than the capacities obtained from BIFURC 3D and NGI<br />
HVMCap for a wall roughness α int<br />
= 1.0 and pure horizontal loading.<br />
- The <strong>Plaxis</strong> 3D Foundation results for inclined loading and α int<br />
= 1.0 seems reasonable<br />
and compares well with the Andersen et al (2005) benchmark results.<br />
- The <strong>Plaxis</strong> 3D Foundation capacity for a wall roughness s int<br />
= 0.65 is clearly too high,<br />
confirming the expected overestimation from the issue with the non-isoparametric<br />
interface elements. We recommend that the <strong>Plaxis</strong> 3D Foundation program should not<br />
be used as the only tool for design of suction anchors until this issue is resolved and<br />
correct performance verified.<br />
- Ultimate capacity calculations by FEA are sensitive to discretization error, and in<br />
particular 3D problems. Insight in the geometry of the governing failure mechanism<br />
and the use of interface elements, symmetry, reduced model dimensions and strategic<br />
mesh refinement greatly reduces this error.<br />
- By running a series of calculations for the same problem with varying mesh fineness<br />
and plotting the obtained capacities against number of nodes, number of elements or<br />
the average element size it is possible to quantify the discretization error and possibly<br />
also making it negligible.<br />
References<br />
- Andersen, K. H. & Jostad, H. P. 1999. Foundation design of skirted foundations and<br />
anchors in clay. Proc. 31th Ann. Offshore Technol. Conf., Houston, Paper OTC 108<strong>24</strong>,<br />
1–10.<br />
- Andersen, K. H. & Jostad, H. P. 2002. Shear strength along outside wall of suction<br />
anchors in clay after installation. Proc. 12th Int. Offshore and Polar Engng Conf.,<br />
Kitakyushu, Japan, 785–794.<br />
- Andersen,K.H., Murff J.D., Randolph M.F., Clukey E.C., Erbrich C., Jostad H.P., Hansen<br />
B., Aubeny C., Sharma P., and Supachawarote C. 2005. Suction anchors for deepwater<br />
applications. Int. Symp. on Frontiers in Offshore Geotechnics, ISFOG. Sept. 2005. Perth,<br />
Western Australia. Proc. A.A. Balkema Publishers.<br />
- Chen, W. & Randolph, M. F. 2007. External radial stress changes and axial capacity for<br />
suction caissons in soft clay. Géotechnique 57, No. 6, 499–511<br />
- Norwegian Geotechnical Institute. 2000. Windows Program HVMCap. Version 2.0. Theory,<br />
user manual and certification. Report 5<strong>24</strong>096-7, Rev. 1, 30 June 2000. Conf.<br />
- Norwegian Geotechnical Institute. 1999. BIFURC-3D. A finite element program for 3<br />
dimensional geotechnical problems. Report 514065-1, 31 December 1999.<br />
<strong>Plaxis</strong> BV. <strong>2008</strong>. <strong>Plaxis</strong> 3D Foundation Foundation version 2.1. www.plaxis.nl.<br />
9
<strong>Plaxis</strong> Practice<br />
On Stability Analysis of Slurry–Wall Trenches<br />
Wlodzimierz BRZAKALA, Karolina GORSKA, Institute of Geotechnics and Hydroengineering, Faculty of Civil Engineering<br />
Wroclaw University of Technology, Wybrzeze Wyspianskiego 27, 50–370 Wroclaw, Poland, wlodzimierz.brzakala@pwr.wroc.pl<br />
1. Introduction<br />
The <strong>Plaxis</strong> users at Wroclaw University focus on soil–structure interaction research,<br />
which also covers vertical excavations supported by either steel or reinforced–concrete<br />
retaining walls. The wall-construction process uses deep vertical trenches that are filled<br />
up with a bentonite suspension (Xanthakos, Hanjal). Displacement and stability analyses<br />
of the anchored walls belong to standard calculations and they are reported in many<br />
places, including the <strong>Plaxis</strong> <strong>Bulletin</strong>. In contrast, the stability analysis of the tentative<br />
trench itself, supported by the bentonite liquid, is less popular. Therefore, these aspects<br />
are the objective of this article.<br />
The technological phase of a bentonite supported trench is – to a certain degree –<br />
a critical moment in the construction process. This is so, because the next phase, i.e.<br />
the successive replacement of the bentonite suspension with the fresh concrete, improves<br />
the stability, due to an increase of the stabilizing horizontal pressure applied to trench<br />
faces.<br />
Geotechnical engineers have coped with the trench–stability problems for years using<br />
simple design methods (Piaskowski, Morgenstern, Washbourne, Fox, Tsai, Ng) or recently<br />
FEM–supported calculations Ng (Oblozinski). However, some questions still remain open.<br />
First of all, the slurry–wall trenches consist of sections L×B×H (say, the length L ∼<br />
2÷8m, width B ∼ 0.6÷1.2m, depth H ∼ 10÷15m or more), so a true 3D stability analysis<br />
is required. Indeed, it is a well–established fact that the horizontal ground pressure<br />
is usually much less then the 2D active earth pressure yielding from the Coulomb theory.<br />
Some authors explain this behaviour making use of the silo–pressure analogy, recalling<br />
the Janssen–Terzaghi solution. Other approaches make use of more or less sophisticated<br />
limit equilibrium methods and there exists a great variety of sliding wedges of soil mass<br />
taken arbitrarily by many authors.<br />
Clearly, layered soils can be analyzed only with difficulty within the limit equilibrium<br />
calculations. The same is true for local loads distributed on the ground surface<br />
in the trench vicinity. Eventually, no prediction of the ground surface deformation<br />
is possible if using statically determinate calculation methods. The advantages of FEM<br />
modelling become obvious here.<br />
We used <strong>Plaxis</strong> 3D Foundation to test a very simply design method. In this context,<br />
the simplest elastic–plastic Mohr–Coulomb model seems to be relevant.<br />
2. Deterministic methods<br />
Stability evaluations of slurry–supported trenches use generally 3D models in two versions<br />
which are based on:<br />
- the force equilibrium for the sliding soil mass (wedge),<br />
- simulations of developing displacements of one (or a few) points selected on the trench<br />
face.<br />
Figure 1: Shapes of the sliding wedges studied by: a) Nash and Johns (2D); b) Morgernstern<br />
and Amir–Tahmasseb; c) Washbourne; d) Tsai and Chang; e) Piaskowski<br />
and Kowalewski.<br />
The simplest transition from 2D to 3D solution in Fig.1b bases on taking into account<br />
shear forces on all sides of the sliding wedge (Morgernstern and Amir–Tahmasseb).<br />
Washbourne modified the shape of rigid block assuming the angle α = π/4+φ/2 between<br />
slide surface and face of the trench, Fig.1c. FEM simulations made by the authors indicate<br />
that such a value of the angle α seems to be underestimated.<br />
The latest 3D solutions by Tsai and Chang employ more realistic – smooth and convex<br />
– shear surface. The method uses vertical columns as a generalization of standard 2D<br />
slices. The Piaskowski and Kowalewski solution, proposed as early as in the mid-sixties,<br />
uses a vertical elliptic cylinder cut by a critical plane. The approach has a profound<br />
justification in terms of elliptic compression arches observed in rock mechanics (though<br />
in vertical planes, not the horizontal one).<br />
From our experience and many tests performed, we could recommend the situation<br />
presented in Fig.1b which reconciles simplicity and accuracy.<br />
Figure 2a: The 3D-view of the sliding block; b) the polygon of acting forces in the plane<br />
of symmetry.<br />
2.1. Limit equilibrium methods<br />
As a first approximation within the limit equilibrium analysis, the 2D solution for triangular<br />
wedge and the infinite trench length can be applied [Nash and Johns], in particular using<br />
the Coulomb critical angle of sliding θ cr<br />
= π/4 + φ/2, Fig.1a. This way, the earth pressure<br />
is overestimated and more realistic shapes of the wedge are of interest, Fig.1c–e.<br />
Introduce the acting forces [kN]: W – bulk effective weight of a wedge, R, S – soil<br />
reactions, Q active load in line of symmetry (Q = 0 hereafter), P s<br />
– hydrostatic horizontal<br />
slurry pressure on the vertical face L × H of the trench, P h<br />
– hydrostatic horizontal<br />
ground-water pressure on the face L × (H-h w<br />
) of the trench. Note that the slurry table<br />
is kept on the ground level and the water table is situated h w<br />
meters under the ground<br />
10
<strong>Plaxis</strong> Practice<br />
level. Both P s<br />
and P w<br />
do not depend on the angle θ which is to be found. The reaction<br />
S is calculated by integrating horizontal stresses over the triangle and the horizontal<br />
stresses are, by assumption, proportional to effective vertical ones. Testing calculations<br />
with <strong>Plaxis</strong> 3D Foundation did not confirm large values of such coefficient of lateral<br />
pressure K which could be expected due to arching effects. The values situated between<br />
K a<br />
and K o<br />
were generally observed, so K = K a<br />
can be assumed as a safe approximation,<br />
K a<br />
= tg 2 (π/4+φ/2).<br />
For simplification, it is also assumed that there is no hydraulic contact between ground<br />
water and the slurry - no filtration is considered. To be more realistic, such contacts<br />
occur in noncohesive soils but they are of a specific character. The filtration of slurry<br />
suspension takes place towards the soil mass thus increases safety margins. It is also<br />
reported (Elson, Filz), that the penetration of the slurry suspension has a very limited<br />
scale and a skin-contact colmatation is observed - called “filter cake”. Such a behavior<br />
is not obvious in coarse-grain soils.<br />
The governing equations for cohesionless soils follow the standard Coulomb approach<br />
with the discussed modifications, Fig.2:<br />
Example 1.<br />
Consider the depth of the trench H = 10m and the water table which can change:<br />
h w<br />
= 1m, 2m, 3m, respectively. The material parameters are presented in Table 1.<br />
γ γ’ K a<br />
φ c<br />
kN/m 3 kN/m 3 – ° kPa<br />
Fine sand 18.5 9.0 0.31 32.0 0<br />
Table 1: Parameters of a homogeneous soil used in (1),(2).<br />
The results in Fig.3a confirm that short sections of the trench are more safe.<br />
Therefore, the static analysis in direction perpendicular to the trench width B is out<br />
of considerations.<br />
(1)<br />
Critical failure plane θ cr<br />
can be found such that it maximizes the value of P h<br />
.<br />
Note that in 3D, for realistic values of L/H, the critical angles θ cr<br />
are usually some 10%<br />
greater than π/4+φ/2. Such a behaviour is governed by the stabilizing forces S applied to<br />
the lateral triangular surfaces. Clearly, the critical angles θ c<br />
tend to π/4+φ/2 for L>>H,<br />
i.e. if the relative contribution of the forces S becomes small.<br />
Figure 3a: Plots of FS versus section length L (symbol ∞ stands for the 2D case),<br />
H = 10m.<br />
The role of the slurry density can be presented as follows.<br />
The limit equilibrium in terms of horizontal forces can be expressed as P s<br />
- P h<br />
- P w<br />
= 0 thus<br />
also as FS 1<br />
= P s<br />
/(P h<br />
+ P w<br />
) = 1 or as FS 2<br />
= (P s<br />
- P w<br />
)/P h<br />
= 1. Due to a lack of uniqueness<br />
(FS 1<br />
≠ FS for FS > 1, i=1,2), and bearing in mind a comparison of results with <strong>Plaxis</strong><br />
2 i<br />
calculations, the authors define factor of safety FS in the standard way:<br />
(2)<br />
where the limit equilibrium FS i<br />
= 1 must be reached for φ . red<br />
Clearly, the factor of safety has a global character, as the one using resultant forces, so<br />
it can be less useful when a local loss of stability can happen.<br />
Figure 3b: Plots of FS versus slurry unit weight for L = 6m, H = 10m.<br />
11
<strong>Plaxis</strong> Practice<br />
On Stability Analysis of Slurry–Wall Trenches<br />
Continuation<br />
2.2. The FEM–based testing using <strong>Plaxis</strong> 3DFoundation<br />
The trench dimensions are 6×1×10m (L×B×H) but two axes of symmetry reduce<br />
it to a quarter 3×0.5×10m. The soil spreads within a bounded block 12×14×15m which<br />
vertical boundaries are fixed for horizontal displacements.<br />
Excavation process was performed by successive removing 1m-thick ground layers<br />
at each calculation phase. Also at each phase, the slurry pressure was increased by<br />
application of external loads on trench faces (linearly increasing with depths, starting<br />
from the ground level) as well as on the bottom of the trench. The slurry unit weight was<br />
10.5kN/m 3 . For the water table h w<br />
= 2m was assumed.<br />
The standard φ-c reduction technique was used to determine values of the factor of safety<br />
FS thus the methodology coincides with the one presented by the expression (2).<br />
The material parameters are as follows.<br />
Focusing on horizontal displacements, it can be observed that the failure initiates in the lower<br />
part of the trench, Fig.4b. The same conclusion holds for incremental displacements.<br />
The uniform red color in Fig.4a confirms an almost vertical kinematics of the wedge.<br />
γ γ’ K o<br />
φ c ψ E ν<br />
kN/m 3 kN/m 3 – ° kPa ° MPa –<br />
Fine sand 18.5 9.0 0.47 32.0 0 0 70.0 0.25<br />
Table 2: Parameters of a homogeneous soil analyzed by <strong>Plaxis</strong><br />
Example 2.<br />
When the values of FS start to stabilize during the reduction of φ, the maximal 3D<br />
displacements are close to 20mm (Fig.4a), on the axis of symmetry the sliding wedge<br />
develops almost linearly, the angle θ cr<br />
is close to π/4+φ/2 and the sliding wedge<br />
is relatively large. For engineering purposes, most of the 3D models presented in Fig.1<br />
can be used to model the shape of the wedge.<br />
Clearly, some settlements far from the trench can be also observed – caused by the elastic<br />
soil behavior, unloading first of all.<br />
Figure 4b: The horizontal displacements of soil towards the trench (at failure).<br />
Example 3.<br />
Assume the section length of the trench L = 6m and the water table that can change:<br />
h w<br />
= 1m, 2m, 3m, respectively. Fig.5 presents the decreasing of the factors of safety<br />
FS when the excavation proceeds. Although based on very different assumptions, both<br />
methods coincide.<br />
Figure 4a: The 3D total displacements (at failure).<br />
Figure 5: Comparison of two calculation methods in term of the factors of safety FS.<br />
12
<strong>Plaxis</strong> Practice<br />
To get a more complete comparison of results, a wider spectrum of numerical examples<br />
for H and h w<br />
is presented in Fig.6. Generally, the limit equilibrium method seems to be<br />
more conservative. Significant differences, up to 20-25%, can be observed but only for<br />
high water table h w<br />
= 1m; the influence of the trench depth H is less evident. On the<br />
other hand, the differences are located in the range of small values of FS. In our opinion,<br />
just the small values of FS are the general reason of the differences, not the high water<br />
table itself. This happens due to the simplified wedge shape that can be more decisive<br />
for small values of FS.<br />
Figure 7a: The 3D soil displacements (at failure).<br />
Figure 6a: set of points FS versus FS for the same geoengineering data (the dashed line<br />
would mean a perfect correlation of results).<br />
2.3. Further examples calculated using <strong>Plaxis</strong> 3D Foundation<br />
In addition to the presented material, consider a little weaker 1m-thick sublayer situated<br />
at the depth of 4-5m.<br />
γ γ’ K o<br />
φ c ψ E ν<br />
kN/m 3 kN/m 3 – ° kPa ° MPa –<br />
Fine sand 18.5 9.0 0.47 32.0 0 0 70.0 0.25<br />
Weaker layer 22.0 12.0 1.00 0 15.0 0 32.0 0.30<br />
Table 3: Parameters of a layered soil analyzed by <strong>Plaxis</strong><br />
Example 4.<br />
Fig.7 correspond to Fig.4, respectively. Note that the differences in kinematics are not so<br />
much significant as expected.<br />
Figure 7b: The horizontal displacements of soil towards the trench (at failure).<br />
3. A probabilistic method<br />
Another safety analysis can be based on a probabilistic methodology (Brzakala and<br />
Gorska), following the method of the so-called design point (see Thoft-Christensen<br />
and Baker, Baecher and Christian).<br />
Consider two uncorrelated random variables:<br />
- the water table h w<br />
, with the expected value E{h w<br />
}= 2m and the standard deviation<br />
σ h<br />
= 1m,<br />
- the friction angle φ, with the expected value E{φ}= 32°, and the standard deviation<br />
σφ = 3.2°.<br />
13
<strong>Plaxis</strong> Practice<br />
On Stability Analysis of Slurry–Wall Trenches<br />
Continuation<br />
Note that only two moments of the random variables are required and the probability<br />
distributions are not specified in this method (second-order distribution-free approach).<br />
Other deterministic data follow from the previous section (a homogeneous soil).<br />
In terms of the dimensionless coordinates<br />
and ,<br />
(3)<br />
Hasofer and Lind (see Thoft-Christensen and Baker) introduced a measure of safety<br />
– called the safety index – which means the shortest distance from<br />
the beginning of coordinate system (expected values of the considered random variables)<br />
to a failure surface.<br />
So, first the failure surface can be found making use of <strong>Plaxis</strong> 3D Foundation assuming<br />
a limit displacement. For two considered random variables, the failure surface reduces<br />
to a curve, almost linear one in Fig.8. It is composed of all points (z 1<br />
, z 2<br />
) for which<br />
the displacement limit condition is reached (25mm in this case). In detail, successive<br />
values of h w<br />
were fixed and the limit state in terms of the displacement was reached by<br />
reducing the angle of friction.<br />
As the second step, the shortest distance β has to be found and the design point for which<br />
this distance is reached.<br />
Clearly, less attention is paid to points and the shape of the failure surface in regions<br />
situated far from the design point.<br />
Analysis of a greater number of random variables is in principle the same, making use<br />
of the same two steps. However, for practical applications, Thoft-Christensen and Baker<br />
recommend to focus on the most significant variables. “Significant”means here both<br />
a large parameter-sensitivity of the model and large randomness (standard deviaton) of<br />
the parameter. Neither slurry density nor soil density fulfil this requirements but the water<br />
table and the soil strength do.<br />
Finally, note that the obtained value of β = 1.4 is relatively low - in random conditions we<br />
would recommend a value β > 2.<br />
The direct comparison with <strong>Plaxis</strong> safety evaluation is not easy because of completely<br />
different background. Assuming the mean values as a reference level, so the deterministic<br />
parameters h w<br />
= 2m and φ = 32°, the FS yielding from the φ-c reduction method in <strong>Plaxis</strong><br />
is however similar: FS = 1.7.<br />
Figure 8: The Hasofer and Lind safety index β = 1.4.<br />
4. Conclusions<br />
1. <strong>Plaxis</strong> 3D Foundation appeared to be a useful numerical tool for testing a simplified<br />
design method of stability analysis.<br />
2. for 3D analysis of stability, a significant reduction of the resultant soil pressure P h<br />
can<br />
be observed, especially for small L/H that can increase the trench safety to required<br />
levels.<br />
3. the trench depth H in the numerical examples was limited to 10m but the results can<br />
be representative also for deeper trenches. The calculations reveal that the failure<br />
initiates mainly within the upper 10m, event for H >> 10m. Such a conclusion is in<br />
agreement with other models (Piaskowski and Kowalewski). There is also a coincidence<br />
with the geoengineering practice, though probably many other factors support such<br />
a practical conclusion (suspension weight increasing with depth, soil orthotropy, soil<br />
parameters changing with depth, etc.).<br />
4. in contrast to calculations using <strong>Plaxis</strong> 3D Foundation, more complex studies<br />
(displacements, local inhomogeneities, local loadings, etc.) are far beyond the scope<br />
of the limit equilibrium methods.<br />
Acknowledgement<br />
The research work was supported in 2007–2009 by the Polish Ministry of Science through<br />
the Ph.D. grant N506 010 32/1269.<br />
14
<strong>Plaxis</strong> Practice<br />
References<br />
- Baecher G.B., Christian J.T. (2003), Reliability and Statistics in Geotechnical<br />
Engineering. John Wiley & Sons.<br />
- Brzakala W., Gorska K.: On safety of slurry–wall trenches, Studia Geotechnica et<br />
Mechanica, <strong>2008</strong>, XXX, No.1–2, 199–206<br />
- Elson W. K.: An Experimental Investigation of the Stability of Slurry Trenches,<br />
Geotechnique, 1968, 18, 37–49<br />
- Filz G. M., Adams T., Davidson R. R.: Stability of long trenches in sand supported by<br />
bentonite–water slurry, Journal of Geotechnical and Geoenviromental Engineering,<br />
2004, 130(9), 915–921<br />
- Hanjal I., Marton J., Regele Z. (1984), Construction of slurry walls. Budapest, Akad.<br />
Kiado.<br />
- Morgenstern N.R., Amir-Tahmasseb J. (1965), The stability of a slurry trench<br />
in cohesionless soils. Geotechnique, 15(4), 387–395.<br />
- Nash J.K.T., Jones G.K. (1963), The support of trenches using fluid mud. Grouts<br />
and Drilling Muds in Engineering Practice. London, 177–180.<br />
- Ng C.W.W., Lings M.L., Simpson B., Nash D.F.T. (1995), An approximate analysis<br />
of the three–dimensional effects of diaphragm wall installation. Geotechnique, 45(3),<br />
497–507.<br />
- Oblozinski P., Ugai K., Katagiri M, Saitoh K., Ishii T., Masuda T., Kuwabara K.: A design<br />
method for slurry trench wall stability in sandy ground based on the elasto–plastic FEM,<br />
Computers and Geotechnics, 2001, 28(2), 145–159<br />
- Piaskowski A., Kowalewski Z. (1965), Application of tixotropic clay suspensions for<br />
stability of vertical sides of deep trenches without strutting. 6th Int.Conf.SMFE,<br />
Montreal, Vol.III, 526–529.<br />
- Thoft-Christensen P., Baker M.J. (1982), Structural Reliability Theory and its Applications.<br />
Berlin, Springer-Verlag.<br />
- Tsai J.S., Chang J.C. (1996), Three–dimensional stability analysis for slurry trench wall<br />
in cohesionless soil. Canadian Geotechnical Journal, 33, 798–808,<br />
- Washbourne J. (1984), The three dimensional stability analysis of diaphragm wall<br />
excavation. Ground Engineering, 17(4), <strong>24</strong>–29.<br />
- Xanthakos P.P. (1979), Slurry wall as structural system. New York, McGraw–Hill.<br />
15
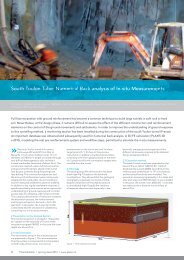
<strong>Plaxis</strong> Practice<br />
Seabed instability and 3D FE jack-up soil-structure<br />
interaction analysis<br />
Lindita Kellezi, GEO – Danish Geotechnical Institute, Denmark<br />
Gregers Kudsk, Maersk Contractors, Denmark<br />
Hugo Hofstede, Marine Structure Consultants, Netherlands<br />
1. Introduction<br />
Seabed instability is an important aspect in the design of different offshore structures.<br />
Particularly for a jack-up drilling rig, which is supported by three independents legs, this<br />
becomes a crucial issue.<br />
The vertical geometry of the spudcan structure is mainly given by: Distance from spudcan<br />
base to tip of outer skirts 2.3 m; Distance from spudcan base to tip of internal skirts<br />
1.1 m;<br />
A geotechnical engineering analysis for the installation (preloading) and storm loading of<br />
the world’s largest jack-up rig, temporarily installed next to a quay of a Norwegian yard, to<br />
be upgraded for production work on the North Sea, is given in this article.<br />
From a preliminary site survey the seabed in the considered area was expected to be rock<br />
outcrop, undulating across the site. Considering that rig’s footings have outer / inner<br />
skirts, which could not penetrate the rocky seabed, modification in the seabed conditions,<br />
creating flat areas at the footing’s locations, through construction of shallow gravel<br />
banks, was initially proposed.<br />
A detailed geotechnical investigation was carried out to verify the soil conditions. From<br />
the investigation a sediment layer of varying thickness overlying the undulating bedrock<br />
was identified.<br />
Several possible rig locations were investigated and discussed to a final one, which was<br />
thoroughly assessed. The sediment layer consisted of a very soft to firm silt (mix) layer<br />
overlain by a thin layer of seabed sand. Therefore, preliminary engineering analyses,<br />
conventional and numerical, with originally low or increased elevations of the gravel<br />
banks, indicated instability of the free skirted spudcans under preloading conditions.<br />
The two-dimensional (2D) and three-dimensional (3D) finite element (FE) analyses of the<br />
free skirted spudcans, which are usually applied for non-uniform soil conditions, were<br />
currently considered conservative. For a more realistic evaluation, jack-up structure -<br />
skirted spudcan - gravel bank - soil interaction effects were included in the analyses.<br />
The full 3D structure-foundation model was applied for varying heights of the gravel<br />
banks. showing non-uniform skirted spudcan penetrations, rotations and sliding. The<br />
FE results from the final location and final heights of the gravel banks, showing that the<br />
structure forces are within the expected limits, are presented in the following.<br />
2. Structure - Foundation System<br />
The current jack-up drilling rig, the world’s largest, is type independent leg cantilever. It<br />
operates in water depths up to 150 m and it has leg lengths of about 205 m.<br />
2.1 Structure elements and stiffness<br />
The considered jack-up rig is a complicated structure to be modelled in details. Therefore,<br />
in the 3D FE model calculations only the main structure elements were considered taking<br />
into account the interaction with the foundations.<br />
Only the three legs and the hull were included in the FE model. The legs were simplified to<br />
3D beam elements, and the hull to plate or floor elements with the equivalent thickness /<br />
area. The rig designer provided the geometry data for the legs and the hull.<br />
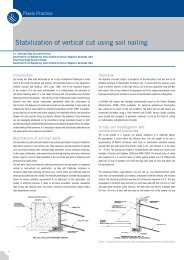
2.2 Footing geometry<br />
The considered jack-up footings have a diameter D = 22 m and are fitted with outer and<br />
internal skirts, which divide the spudcan into 6 compartments. Figure 1 show a photo<br />
view of the spudcan.<br />
Figure 1: Skirted spudcan view<br />
The spudcan itself is almost a flat rigid plate. The transverse stiffnesses of the skirts are<br />
derived from the structural FE model of the spudcan. These thicknesses are applied in the<br />
2D and 3D FE analyses employing beam and wall structural elements, respectively.<br />
2.3 Soil conditions<br />
To identify the seabed / soil conditions at the considered locations a new site survey,<br />
seismic, (sparker and pinger) and bathymetry was carried out.<br />
From the survey, generally sediments of varying thickness overlaying hard ground /<br />
bedrock were found. The largest sediment thicknesses were seen at the largest water<br />
depth.<br />
Gravity vibrocore samples taken from seabed could not reach the bedrock and showed<br />
mostly sediments of clayey, gravely sand. At the shallow water depths the bedrock<br />
outcrops the seabed.<br />
After the interpretation of the seismic survey (sparker) geotechnical investigation<br />
including 5 piezo-cone penetration tests (PCPTs) and one vibrocore for each spudcan<br />
location were carried out. Good definition of the seabed level and the bedrock was found.<br />
However, discrepancies were recognized at some PCPT locations. The inconsistency was<br />
explained by the fact that the PCPTs were not carried out on the seismic lines.<br />
Considering the limitations of the sparker survey, a pinger survey was carried out.<br />
With a less penetrating, but a smaller opening angle seismic source, the pinger survey<br />
was applied to better identify the slope of the bedrock and supplement the previous<br />
investigations in the area. Based on the pinger data combined with the existing soil<br />
information, a re-interpreted model of the sediment and bedrock surface was produced.<br />
As a result, the original proposed locations were reduced to a final one. At each leg<br />
position four vertical cross sections showing the seabed and top bedrock profiles from<br />
centre of the spudcans out to a distance of 50 m, are presented in Figure 2.<br />
16
<strong>Plaxis</strong> Practice<br />
To identify the soil conditions and the soil parameters applicable to the design of the<br />
gravel banks at the final location a new geotechnical investigation consisting of 5<br />
boreholes, about 70 PCPTs and laboratory tests were carried out.<br />
On the basis of all the geotechnical data it was evaluated that the soil conditions consist<br />
of overall quaternary marine sediments, mainly deposits consisting of a seabed layer of<br />
sand overlying clayey, sandy silt with variable thickness (0 - 9) m overlying crystalline<br />
bedrock.<br />
2.4 Water depth<br />
The water depth or the seabed elevations at the centre of the three spudcan locations are<br />
as seen from Figure 2, approximately –23 m at spudcan S1, -19 m at S2 and –26.5 m<br />
at S3.<br />
were taken and laboratory tests performed. From the UU triaxial tests undrained shear<br />
strengths of value minimum c u<br />
= 33 kPa are measured for the extracted samples.<br />
However, at the depths where lower cone strength as shown in Figure 3, is recorded from<br />
the PCPT, no soil sample could be extracted and no correlation is available. Under these<br />
circumstances the correlation N = q net<br />
/ c u<br />
= (15 – 20) is found applicable.<br />
When applying such a correlation on the PCPT data undrained shear strength for the silt<br />
c u<br />
= (15 – 30) kPa is assessed. Based on the test results and the engineering judgement<br />
initially c u<br />
= 25 kPa for the silt layer and a friction angle ϕ = 35° for the seabed sand<br />
layer were assessed as lower bound values. For the bedrock an undrained shear strength<br />
c u<br />
= (1000 – 1500) kPa was assigned to represent the strong subsurface. A summary of<br />
the soil parameters applied in the analyses is given in Table 3.<br />
The gravel bank material is modelled applying a unit weight γ' = 11 kN/m 3 and a friction<br />
angle ϕ = 40°. The deformation parameter E = 100000 kPa.<br />
Spudcan S1<br />
Spudcan S3<br />
Spudcan S2<br />
Figure 2: Seabed bedrock profile, final rig location<br />
2.5 Design soil profiles and parameters<br />
On the basis of the seismic surveys, PCPTs / boreholes and laboratory test results<br />
(classification and triaxial, unconsolidated undrained (UU) and consolidated isotropic<br />
drained (CID)) performed for the final location, the soil profiles and soil parameters<br />
applicable to the engineering assessment are derived. The soil parameters for the bedrock<br />
are evaluated based on the engineering experience.<br />
There seems to be a good correlation with the PCPT data for the depths where samples<br />
Figure 3: PCPT profile at S1 location<br />
17
<strong>Plaxis</strong> Practice<br />
Seabed instability and 3D FE jack-up soil-structure<br />
interaction analysis<br />
Continuation<br />
Soil Type<br />
h<br />
(m)<br />
3. Structure - Foundation Analyses<br />
Different analyses consisting of conventional and 2D / 3D FE modelling are carried out.<br />
3.1 Preliminary 2D and 3D FE modelling, low gravel banks<br />
The 2D FE free skirted spudcan - low gravel bank - soil interaction analyses with <strong>Plaxis</strong><br />
2D Version 8 (2002) showed instability of the S1 and S3. However, the 2D analyses were<br />
considered very conservative due to 3D soil conditions.<br />
Under these circumstances 3D FE modelling of the free skirted spudcan - gravel bank<br />
- soil interaction was performed, The model was built with <strong>Plaxis</strong> 3DFoundation (2006)<br />
assigning boreholes at the location where soil profile changes. An implicit interpolation<br />
between the boreholes is carried out during the calculation. By this method the soil<br />
conditions at the spudcan area are modelled to the extent the seismic survey and the<br />
geotechnical investigation allow.<br />
Mohr Coulomb constitutive soil model for the soil layers in the drained (seabed sand and<br />
gravel bank) and undrained (bedrock and clay / silt / mix) conditions are applied. The<br />
preliminary analyses applying c u<br />
= 25 kPa for the silt layer showed large rotations and<br />
horizontal movement for the free S1.<br />
To take into account the structure foundation interaction it was discussed to apply some<br />
stabilizing loads on the spudcan while preloading. After many calculation attempts it was<br />
found difficult to assess the limited reaction forces needed to stabilize the spudcan and<br />
the procedure was cancelled. The issue of skirted spudcan – structure – skirted spudcan<br />
- soil interaction was raised at this time.<br />
The first full 3D model consisted of low gravel banks at elevations –20.0 m, (about 3<br />
m height), -13.5 m, (about 5.5 m height), -<strong>24</strong>.0 m, (about 2.5 m height), for S1, S2<br />
and S3, respectively. Large penetrations and horizontal movements, particularly for S3<br />
were calculated. The reaction forces in the structure were far beyond the limits. Under<br />
these circumstances the effect of the higher gravel banks at S1 and S3 locations were<br />
investigated.<br />
3.2 Conventional skirted spudcan differential penetration<br />
Based on SNAME (2002) and Hansen (1970) conventional skirted spudcan penetration<br />
analyses were carried out at each spudcan location to get an idea on the effect of the<br />
height of the gravel banks on the spudcan differential penetration. These were also<br />
compared with some FE axisymmetric analyses of the spudcan penetration.<br />
Such analyses are previously carried out by Kellezi & Stromann (2003), Kellezi et al.<br />
(2005a,b),<br />
γ’<br />
(kN/m 3 )<br />
ϕ<br />
(°)<br />
cu<br />
(kN/m 2 )<br />
E<br />
(kN/m 2 )<br />
Sand, loose to medium dense Varying 10.0 35 - 35000<br />
Silt, very soft to firm Varying 9.0 - 15/25/30 100*cu<br />
Bedrock Varying 12.0 - 1000/1500 200*cu<br />
Table 1: Soil profile applied in the FE analyses<br />
In the analyses c u<br />
= 25 kPa for the silt was applied. The results for location S1 and<br />
gravel bank at elevation –19 m are given for illustration in Figure 4. Two extreme soil<br />
profiles within the spudcan area are chosen, which are expected to give max and min<br />
penetrations. The differences in penetrations give the expected differential penetration of<br />
the free spudcan. The elevation of the gravel bank is moved from -21 m to -19 m to -14<br />
m.. No punch through risk is expected for any of the scenarios.<br />
For S2 the height of the gravel bank is determined from the length of the spudcan skirt/<br />
chord, plus some tolerance. The top of the bank will be at -13.5 m and small differential<br />
penetrations are expected.<br />
For S3 two extreme soil profiles are chosen as well expected to give max and min<br />
penetrations. The elevation of the gravel bank is moved from -25 m to -23 m to -21 m to<br />
-18 m to -16 m.. No punch through risk is expected for any of the scenarios.<br />
3.3 Preliminary 3D FE modelling, high gravel banks<br />
To make the location applicable for the rig installation based on the conventional and FE<br />
axisymmetric results, higher gravel banks were proposed. The soil mechanic principle of<br />
load spreading is used. Higher banks will increase the bearing capacity of the silt layer as<br />
a result of increasing fictive bearing area.<br />
Except for the preloading phase this model was also calculated for the storm load, wind<br />
speed 33 m/s. The storm load may come from any direction so different analyses are<br />
needed to define the critical one. The 3D model calculation procedure consists of 3 load<br />
stages, which are:<br />
Preloading to max vertical load V =145 MN; Unload to vertical V = 112 MN, V = 100 MN, V<br />
= 115 MN for S1, S2, S3, respectively; Apply storm loads, horizontal H = 6.4 MN, moment<br />
M = 345.6 MNm at the most critical plane;<br />
The horizontal force is applied at the hull plate pointing towards the critical leg. The<br />
moment is implemented as a set of two vertical loads, applied downward at the critical<br />
leg-hull connection and upwards at a point in the hull between the other two legs as<br />
shown in Figure 6. Except the 3 load phases, an initial phase is calculated consisting of<br />
the construction of the gravel banks.<br />
The limited combined loads at the structure, one single leg, are calculated as:<br />
Horizontal shear force Q = 18 MN; Vertical force (at hull) V = 145 MN; Bending moment<br />
at hull M = 325 MNm;<br />
Taking into account the limits for the structure reaction forces and the result from the 3D<br />
FE structure – foundation models with increased height of the gravel banks at S1 and S3,<br />
a reassessment was found necessary.<br />
The soil strength for the silt layer c u<br />
= 25 kPa, as mentioned previously, was evaluated<br />
based on the engineering judgement. This is however, not a lower bound assessment<br />
based on the PCPT data and usual North Sea (q net<br />
- c u<br />
) correlation.<br />
After reviewing the available soil data, to increase to some level safety concerning the soil<br />
parameters, DNV (1992) it was decided to reduce the shear strength for the silt layer from<br />
c u<br />
= 25 kPa to c u<br />
= 15 kPa. This strength is considered a lower bound design value, when<br />
taking into account the consolidation during construction of the banks and two weeks rig<br />
location with lightweight.<br />
18
<strong>Plaxis</strong> Practice<br />
Investigating different 3D FE models with slightly different heights of the gravel banks,<br />
which could indicate less spudcan rotation / sliding, a final model, was constructed and<br />
given in detail in the next section.<br />
3.4 Final 3D FE modelling, high gravel banks<br />
The model scenario with gravel bank elevations at –14.5 m, (height about 8.5 m), -13.5<br />
m, (height about 5.5 m), -15.8 m, (height about 10.7 m) for S1, S2 and S3 locations,<br />
respectively was chosen as final as the reaction forces and the amount of sliding were<br />
within the structure limits. Despite, this is the largest model with respect to mesh size,<br />
which could be run from the workstation.<br />
The 2D build-up model geometry is given in Figure 5. The skirted spudcans are simplified<br />
by octahedrons. The spudcan is flat and in full contact with the gravel bank soil from the<br />
start of the preloading. The 3 chords and the inner skirts are not included. The tip of the<br />
outer skirts is from the start of the analyses at elevation calculated from bank elevation<br />
minus 2.3 m (the skirt length).<br />
The jack-up structure is modelled in a simple way using vertical 3D beam elements<br />
for the 3 legs and plate / floor elements for the hull, as shown in the Figure 6. The leg<br />
elements are based on the Mindlin’s beam theory. In addition, the elements can change<br />
length due to applied axial force. The leg beams and the spudcan plates at the connection<br />
points can simulate the 6 degrees of freedoms.<br />
Figure 4: Conventional skirted spudcan differential penetration analysis, S1 extreme soil conditions, and gravel bank at –19 m<br />
19
<strong>Plaxis</strong> Practice<br />
Seabed instability and 3D FE jack-up soil-structure<br />
interaction analysis<br />
Continuation<br />
The soil conditions, (soil profiles derived from the seismic, PCPT / borehole data at<br />
different cross sections), are modelled by implementing boreholes, as seen from the<br />
horizontal planes in Figure 5. Some of the soil profiles / sections with final gravel banks<br />
designed based on the 3D FE structure - foundation model are given in Figure 7, 8, 9.<br />
The results for the initial phase, including the construction of the gravel banks, are given<br />
in Figure 10. Vertical non-uniform settlements of about (20 – 40) cm are expected taken<br />
into account in the calculation of the total gravel volume.<br />
The results for the preloading phase as total structure displacements are given in Figure<br />
11. At the end of this phase the maximum calculated reaction forces are M = 211.04<br />
MNm, shear force Q max<br />
= 15.13 MN, differential penetration at S1, about 20 cm, sliding of<br />
S1, about 12 cm. For these values the structure integrity is found satisfactory.<br />
S1<br />
S2<br />
Boreholes<br />
Figure 7: Cross section profile North – South at S1 across the 3D FE model (not to scale)<br />
Figure 5: 3D FE structure-foundation model, 2D build-up, horizontal plane at S1 level,<br />
-14.5 m<br />
The gravel bank sand material was specified to correspond to the soil strength applied in<br />
the analyses. The construction of the banks was performed following a procedure, which<br />
gives the possibility for some consolidation or drainage for the silt layer to occur. The total<br />
volume of the sand material used was about 60000 m 3 .<br />
S3<br />
S2<br />
S3 –15.8 m<br />
Jack-Up Hull<br />
N<br />
S1 –14.5 m<br />
Figure 8: Cross section profile North West – South East at S2 across the 3D FE model<br />
(not to scale)<br />
S3<br />
S2 –13.5 m<br />
Figure 6: 3D FE structure-foundation model, final gravel banks<br />
Jack-Up Legs<br />
Figure 9: Cross section profile North - South at S3 across the 3D FE model (not to scale)<br />
The results for the unloading phase show slight changes in the deformations and<br />
structure reaction forces. The results from the storm analyses show also slight changes<br />
in the deformations and structure reaction forces.<br />
20
<strong>Plaxis</strong> Practice<br />
Conclusions<br />
3D FE structure - foundation interaction analyses are carried out for the installation of a<br />
jack-up rig, offshore, Norway, where seabed instability was a concern.<br />
Gravel banks were designed at the skirted spudcan locations with different heights,<br />
ensuring that the structure reaction forces developed due to footings rotation / sliding, do<br />
not exceed the calculated limits.<br />
The jack-up rig was successfully installed at the location and spudcan penetrations /<br />
displacements similar to the predicted values were recorded.<br />
Acknowledgement<br />
The authors are grateful to Maersk Contractors, Denmark for supporting this project.<br />
References<br />
- DNV (Det Norske Veritas) 1992. Foundations classification notes No. 30.4. February.<br />
- Hansen, J.B. 1970. A revised and extended formula for bearing capacity,. Bull. No.28,<br />
The Danish Geotech. Inst. pp. 5-11.<br />
Figure 10: Initial phase, construction of the final gravel banks<br />
- Kellezi, L., and Stromann H., 2003, FEM analysis of jack-up spudcan penetration for<br />
multi-layered critical soil conditions. ICOF2003, Dundee, Scotland, pp. 410-420.<br />
- Kellezi, L., Kudsk, G. and Hansen, P.B., 2005a, FE modeling of spudcan – pipeline<br />
interaction,. Proc. ISFOG 2005, September, Perth, Australia, pp. 551 – 557.<br />
- Kellezi, L., Hofstede, H. and Hansen, P.B., 2005b, Jack-up footing penetration and fixity<br />
analyses, Proc. ISFOG 2005, Sept., Perth, Australia, pp. 559 – 565.<br />
S3 –15.8 m<br />
S1 –14.5 m<br />
- <strong>Plaxis</strong> 2002, Version 8.4. User Manual 2D, Delft University Technology and <strong>Plaxis</strong> b.v<br />
- <strong>Plaxis</strong> 2006, 3D Foundation Module Version 1.6, Delft University of Technology & <strong>Plaxis</strong><br />
b.v.<br />
S2 –13.5 m<br />
- SNAME 2002, T&R bulletin 5-5A. Site specific assessment of mobile jack-up units.<br />
Figure 11: Preloading phase, structure total displacements (only plate elements shown)<br />
21
Recent Activities<br />
Recent Activities<br />
“Are you a <strong>Plaxis</strong> V8 user and not yet a<br />
V.I.<strong>Plaxis</strong> Service Member?<br />
Sign Up Now and get immediate access<br />
to <strong>Plaxis</strong> 2D V9.0”<br />
We proudly present <strong>Plaxis</strong> 2D V9.0. In september we released this new version. Close to<br />
4,000 <strong>Plaxis</strong> 2D programs are used in the world. By becoming a V.I.<strong>Plaxis</strong> Service program<br />
member users can take advantage of the latest developments like;<br />
1. Hardening Soil Small Strain Stiffness model<br />
2. Soil Test Facilty<br />
3. Parameter Variation/ Sensitivity Analysis<br />
4. Automatic regeneration of stage settings<br />
The first 3 items are also discussed in previous bulletins and for item 4 you can find<br />
some technical information on page 23. For more information please send your request<br />
to info@plaxis.nl.<br />
Furthermore we released update pack 2.2 of 3DFoundation. Besides fixing some known<br />
issues also a pile group wizard has been implemented. With the availability of defining<br />
pile groups instantly as a grid we respond to a frequently asked request after the release<br />
of 3DFoundation version 2.1.<br />
In July our French Agent Terrasol sold 2 extra 3DFoundation licenses to Keller Foundations<br />
Special (Keller France). Keller France has now 5 copies of the <strong>Plaxis</strong> 3DFoundation<br />
program. “With the <strong>Plaxis</strong> 3DFoundation program we are able to model geotechnical<br />
structures of which complexity and sensibility require that all geometrical constraints be<br />
taken into account” said Mr Lambert of Keller France. With this order we welcomed our<br />
1,000 th 3D <strong>Plaxis</strong> user.<br />
<strong>Plaxis</strong> America<br />
In the Americas we participated in 2 major geotechnical events. The first one was<br />
GeoCongress <strong>2008</strong> in New Orleans, USA. The theme, a spin-off of the effects of the<br />
hurricane Katrina, gave a lot of extra exposure in the geotechnical sustainability<br />
simulations of <strong>Plaxis</strong> programs both 2D and 3D. The second conference was Cobramseg<br />
<strong>2008</strong> in Buzios Brasil. Because of the increasing demand on exchange of geotechnical<br />
experiences in Brasil this conference will be organised every 2 years in stead of 4. Courses<br />
were held in Buenos Aires - Argentina and Houston - U.S.A.<br />
<strong>Plaxis</strong> Courses<br />
The requests for courses has significantly increased in <strong>2008</strong>, resulting in fully booked<br />
courses sometimes weeks before the actual course date. In that respect the very successful<br />
course in Argentina was the most outspoken example of this with over 70 registrations<br />
for only 45 available course seats. It is currently under investigation whether we can soon<br />
organize a second course in Argentina to accommodate the remaining registrants. Until<br />
now it was impossible to increase the amount of courses per year as the available staff for<br />
lecturing at courses was limited. However, with our recent increase of capacity in the field<br />
of courses we can now work on an increase of the amount of courses in the next year.<br />
In the last quarter of <strong>2008</strong> the first <strong>Plaxis</strong> course in Spain has been scheduled, and is by<br />
now already fully booked. After the success of the standard course at Griffith University<br />
last February we continue our scheme of courses in Australia with another standard<br />
course this November in close cooperation with and held at the University of Newcastle.<br />
For details on this course please contact our local agent in Australia.<br />
<strong>Plaxis</strong> Asia<br />
In Asia we participated in the 6 th International Symposium Geotechnical Aspects of<br />
Underground Construction in Soft Ground in Shanghai, China in April. We later went on<br />
a <strong>Plaxis</strong> roadshow in major cities like Beijing, Wuhan, Xian, Chengdu and Guangzhou to<br />
promote <strong>Plaxis</strong>. In May, we exhibited at a 2 days International Conference on Geotechnical<br />
and Highway Engineering (Geotropika <strong>2008</strong>) in Kuala Lumpur, Malaysia. During the 2<br />
days there, we met many existing <strong>Plaxis</strong> users as well as potential customers in highway<br />
engineering who express interest in <strong>Plaxis</strong>. On the last week of June, we organised a one<br />
day <strong>Plaxis</strong> seminar in cities of Ho Chi Min and Hanoi. Both of the seminars attracted<br />
more than 70 participants and many of them are from local engineering consulting<br />
and contractor firms. <strong>Plaxis</strong> Asia has also made her presence in the 10 th International<br />
Symposium on Landslides and Engineered Slopes held in Xi’an, China from 30 th June to<br />
4 th July <strong>2008</strong>. The symposium is one of the most important activities of the Joint Technical<br />
Committee on Landslides and Engineered Slopes (JTC1) under the ISSMGE, ISRM and<br />
IAEG. On the 25 th July, <strong>Plaxis</strong> Asia jointly organised a one day 3D <strong>Plaxis</strong> hands-on workshop<br />
with our Hong Kong Agent (see photo). There is an increasing demand on 3D FEM analysis<br />
in geotechnical application from the <strong>Plaxis</strong> users in Hong Kong. We intend to organise<br />
more of this type of courses in the near future. Please visit the agenda on our website on<br />
regular basis for such upcoming events.<br />
We hope to see you soon at the 15 th European <strong>Plaxis</strong> User Meeting in November, the 3 rd<br />
Asian Advanced <strong>Plaxis</strong> User Course in December or one of our other events.<br />
New managing director for <strong>Plaxis</strong> bv<br />
After having moved to a brand new office at Delftechpark in Delft (NL) earlier this<br />
year, PLAXIS has now appointed a new managing director. Jan-Willem Koutstaal joined<br />
<strong>Plaxis</strong> on April 1 st, <strong>2008</strong>. This gives PLAXIS a solid foundation for further growth and<br />
professionalisation of the organisation, its products and services. Mr. Koutstaal has<br />
held several (international) management positions in ICT. He will employ the extensive<br />
experience gained to enforce and expand the position of PLAXIS as top player in the area of<br />
advanced software for geotechnical applications and services for geotechnical experts.<br />
“PLAXIS is a company with in-depth knowledge and high quality products which,<br />
also through relationships with various national and international scientific institutes, is<br />
capable to play a world class role in its field. Definitely something to be very proud of!”<br />
according to Mr. Koutstaal.<br />
22
Recent Activities<br />
<strong>Plaxis</strong> 2D Version 9 stage regeneration<br />
One of the practical inconveniences of <strong>Plaxis</strong> V8 is the fact that staged construction<br />
phases have to be redefined whenever the mesh is regenerated, even if the geometry<br />
of the project has not been changed. In <strong>Plaxis</strong> V9 this inconvenience is overcome<br />
by a new functionality called “stage regeneration’. This stage regeneration, that is<br />
performed automatically every time the mesh is regenerated, applies the already<br />
defined stage settings to the newly created mesh. This includes per phase:<br />
- Material assignment to clusters<br />
- Load values<br />
- Definition of phreatic levels and user-defined pore pressure settings including the<br />
regeneration of the pore pressures for phreatic line calculations. The settings for a<br />
groundwater flow are regenerated, but the user should recalculate the groundwater<br />
flow: this is not done automatically due to the duration of the groundwater flow<br />
calculation.<br />
- If the K 0<br />
procedure is used, the previous settings of K 0<br />
, OCR and POP are applied<br />
to the new mesh. Note that material changes do not have any effect on the values<br />
of K 0<br />
, OCR and POP: the absolute values of the previous K 0<br />
-procedure are used to<br />
regenerate the initial stresses.<br />
This means that any change in the material assignments and load definition in<br />
the geometry will not be applied to the regenerated phases, including the initial<br />
conditions phase: the original phase settings of material assignment and load<br />
definitions are kept.<br />
Material replacement in <strong>Plaxis</strong> 2D V8 and <strong>Plaxis</strong> 2D V9.0<br />
One important topic in the stage regeneration is the replacement of soil materials.<br />
A lot of users do their first calculations with material datasets that do not have very<br />
detailed parameter information. Then, in a later stage of the project, more detailed<br />
information is available, and the same <strong>Plaxis</strong> project will be recalculated with<br />
changed materials.<br />
Changing materials<br />
There are three ways to change your materials:<br />
a change the parameters of the current material dataset<br />
B add a new material dataset, and replace the material in the geometry<br />
c add a new material dataset, remove the old dataset, and apply the new datasets<br />
to the appropriate clusters<br />
In <strong>Plaxis</strong> 2D Version 8, methods A and B could be used. With method A, the material<br />
dataset was changed, which would effect all new calculations. With method B, the<br />
user still had to change all material assignments for the appropriate clusters in<br />
each phase.<br />
Method C lead to a warning that material sets had not been assigned to all clusters.<br />
In that case, all phases had to be redefined.<br />
In <strong>Plaxis</strong> 2D Version 9, method A and B still behave the same as in <strong>Plaxis</strong> 2D Version<br />
8. Method C, however, does no longer lead to undefined clusters. When a stage is<br />
regenerated the regeneration process will reassign the material that was already<br />
applied in that phase. If that material data set has been removed from the material<br />
database, the regeneration process will assign the material from the geometry<br />
definition.<br />
Note: After changing the material assignment, please check the values for the<br />
K 0<br />
-procedure: the regeneration process will use the values from the previous K 0<br />
-<br />
procedure.<br />
23
<strong>Plaxis</strong> finite element code for soil and rock analyses<br />
Activities <strong>2008</strong> - 2009<br />
October 1 - 6, <strong>2008</strong><br />
12th IACMAG<br />
Goa, India<br />
October 6 - 8, <strong>2008</strong><br />
Congres International de l’AFTES<br />
Monaco<br />
October 8, <strong>2008</strong><br />
Funderingsdag<br />
Ede, The Netherlands<br />
October 15 - 17, <strong>2008</strong><br />
Course on Computational Geotechnics<br />
Paris, France<br />
October 27 - 29, <strong>2008</strong><br />
NUCGE <strong>2008</strong><br />
Skikda, Algeria<br />
October 27 - 29, <strong>2008</strong><br />
Course on Computational Geotechnics<br />
Barcelona, Spain<br />
November 5 - 7, <strong>2008</strong><br />
15th European <strong>Plaxis</strong> Users Meeting<br />
Karlsruhe, Germany<br />
November 10, <strong>2008</strong><br />
Course on Computational Geotechnics<br />
Newcastle, Australia<br />
December 17 - 19, <strong>2008</strong><br />
Indian Geotechnical Conference IGC <strong>2008</strong><br />
Bangalore, India<br />
December 15 - 18, <strong>2008</strong><br />
3rd Asian Advanced <strong>Plaxis</strong> Users Course<br />
Chiang Mai, Thailand<br />
January 13, 2009<br />
Course on Computational Geotechnics<br />
Berkeley, U.S.A.<br />
January 26 - 28, 2009<br />
International Course on Computational<br />
Geotechnics<br />
Schiphol, The Netherlands<br />
February 9, 2009<br />
TAE course<br />
Germany<br />
March 15 - 19, 2009<br />
IFCEE 09<br />
Orlando, Florida, USA<br />
March 23 - 26, 2009<br />
International Course on Computational<br />
Geotechnics<br />
Schiphol, The Netherlands<br />
November 14, <strong>2008</strong><br />
<strong>Plaxis</strong> Introduction Seminar<br />
Auckland, New Zealand<br />
<strong>Plaxis</strong> BV<br />
PO Box 572<br />
2600 AN Delft<br />
The Netherlands<br />
Tel: +31 (0)15 251 77 20<br />
Fax: +31 (0)15 257 31 07<br />
E-Mail: info@plaxis.nl<br />
Website: www.plaxis.nl<br />
8007276