Iss31 Art3 - Numerical Analysis of Piled Embankments ... - Plaxis
Iss31 Art3 - Numerical Analysis of Piled Embankments ... - Plaxis
Iss31 Art3 - Numerical Analysis of Piled Embankments ... - Plaxis

You also want an ePaper? Increase the reach of your titles
YUMPU automatically turns print PDFs into web optimized ePapers that Google loves.
<strong>Numerical</strong> analysis <strong>of</strong> geosynthetic reinforced piled embankment scale<br />
model tests<br />
Ir. Theresa den Boogert, TU Delft (now Mobilis), Ing. Piet van Duijnen, Mobilis and Ir. Suzanne van Eekelen, Deltares/TU-Delft<br />
Foto: Project N210, Huesker<br />
<strong>Piled</strong> embankments with geosynthetic reinforcement are applied on s<strong>of</strong>t soils and have several advantages. For<br />
example, the piled embankment can be constructed rather fast and has a small settlement after construction or is<br />
even settlement-free. Another advantage is that a piled embankment can be built next to sensitive constructions.<br />
A piled embankment consists <strong>of</strong> a field <strong>of</strong> piles with pile caps. On top <strong>of</strong> that, one or more layers <strong>of</strong> geosynthetic<br />
reinforcement (GR) are applied. On top <strong>of</strong> the GR the embankment can be constructed.<br />
In the Dutch design guideline, CUR226<br />
»(2010), for the design <strong>of</strong> piled embankmenst<br />
was published. To validate the guideline,<br />
several field tests have been performed. From<br />
the field measurements it has been concluded<br />
that the design method is rather conservative.<br />
Improving the design guideline would reduce<br />
the construction costs <strong>of</strong> piled embankments. To<br />
understand the physical behaviour <strong>of</strong> the piled<br />
embankment and to validate design models,<br />
experimental scale tests have been performed<br />
by Deltares in partnership with Huesker, Naue,<br />
TenCate and Tensar. The results <strong>of</strong> the scale tests<br />
were analysed and published by Van Eekelen, et al.<br />
(2011a, 2011b and 2011c).<br />
<strong>Plaxis</strong> simulations <strong>of</strong> the test series were<br />
performed to improve the understanding <strong>of</strong> the<br />
arching mechanism in the piled embankment, and<br />
where possible, to confirm the conclusions from<br />
the analysis <strong>of</strong> the scale tests. The simulations<br />
are part <strong>of</strong> the master thesis performed by Den<br />
Boogert (2011).<br />
First the definition <strong>of</strong> the load distribution in<br />
the embankment will be presented. The scale<br />
tests are described in the second paragraph.<br />
Then the content <strong>of</strong> the finite element model is<br />
discussed. The results <strong>of</strong> the finite element model<br />
are analysed and compared to the results <strong>of</strong> the<br />
scale test. The paper ends with conclusions and<br />
recommendations.<br />
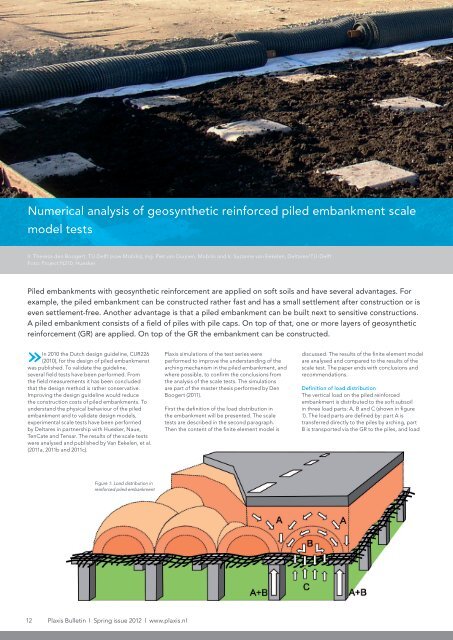
Definition <strong>of</strong> load distribution<br />
The vertical load on the piled reinforced<br />
embankment is distributed to the s<strong>of</strong>t subsoil<br />
in three load parts: A, B and C (shown in figure<br />
1). The load parts are defined by: part A is<br />
transferred directly to the piles by arching, part<br />
B is transported via the GR to the piles, and load<br />
Figure 1: Load distribution in<br />
reinforced piled embankment<br />
12 <strong>Plaxis</strong> Bulletin l Spring issue 2012 l www.plaxis.nl
part C is carried by the s<strong>of</strong>t subsoil. The load parts<br />
are vertical loads and are given in kN/pile.<br />
Scale tests<br />
A section <strong>of</strong> an embankment is modelled in a<br />
metal box <strong>of</strong> 1.1 x 1.1 x 1 m 3 . Four piles are situated<br />
on the bottom <strong>of</strong> the box. The s<strong>of</strong>t subsoil<br />
between the piles is modelled with a watertight<br />
foam cushion filled with water. A tap allows<br />
drainage from the foam cushion during the test,<br />
which models the consolidation process <strong>of</strong> the s<strong>of</strong>t<br />
subsoil. The GR is attached to a steel frame and<br />
situated on top <strong>of</strong> the foam cushion with a sand<br />
layer <strong>of</strong> ca. 2 cm in between. On top <strong>of</strong> the GR, an<br />
embankment <strong>of</strong> 0.42 m is constructed <strong>of</strong> granular<br />
material (crushed rubble). The top load on the<br />
embankment is applied with a water cushion. This<br />
provides an equally distributed top load. The<br />
metal box is closed by a cover and tie rods. A side<br />
and top view <strong>of</strong> the scale test set-up is given in<br />
figure 2.<br />
The scale tests are performed in several steps<br />
<strong>of</strong> consolidation by draining the foam cushion<br />
and increasing top load. The load steps and<br />
consolidation steps alternate: each top load step<br />
is followed by ca. 3 consolidation steps. At the end<br />
<strong>of</strong> the scale test, vacuum pressure is applied to the<br />
foam cushion. This reduces the subsoil support<br />
to zero. After every drainage or top load step, the<br />
system is allowed to stabilise for several hours.<br />
The load distribution is measured with pressure<br />
cells. Pressure cells are placed on top <strong>of</strong> piles, one<br />
above and one underneath the GR. The pressure<br />
cell above the GR measures load part A and the<br />
pressure cell underneath the GR measures load<br />
parts A+B. Load part B is calculated by subtracting<br />
load part A from load parts A+B. Additionally, the<br />
pressure in the foam cushion is measured, which<br />
gives load part C. The top load is measured with<br />
a water pressure meter in the water cushion. The<br />
vertical deformation <strong>of</strong> the GR is measured on<br />
three locations with a liquid levelling system. The<br />
locations <strong>of</strong> the measurements are given in figure<br />
2.<br />
Figure 2: Side view and top view <strong>of</strong> scale test set-up<br />
www.plaxis.nl l Spring issue 2012 l <strong>Plaxis</strong> Bulletin 13
<strong>Numerical</strong> analysis <strong>of</strong> geosynthetic reinforced piled embankment scale model tests<br />
Finite element model<br />
The scale tests are simulated with 3DTunnel<br />
version 2.4. 3DTunnel was used, because updated<br />
mesh could be applied and arching in the<br />
embankment is a 3D problem. Updated mesh is<br />
necessary to use, because the function <strong>of</strong> the GR<br />
depends on the deformation and the tension force<br />
cannot be modelled if the deformation is not<br />
captured in the calculation. The updated mesh<br />
function captures the tensile strains in the<br />
geosynthetic elements and the geosynthetic is no<br />
longer horizontal. Next to that the new PLAXIS 3D<br />
version was not available at the time. The<br />
geometry <strong>of</strong> the model is based on the geometry<br />
<strong>of</strong> the scale test. Because the geometry <strong>of</strong> the<br />
scale test is symmetric, one quarter <strong>of</strong> the scale<br />
test, one pile with surrounding soil, is modelled.<br />
The boundary conditions are horizontally fixed.<br />
The side and top view <strong>of</strong> the model are presented<br />
in figure 3. The material properties are<br />
summarized in table 1 and 2 and will be described<br />
in the next section.<br />
pressure in the foam cushion. To simulate the<br />
drainage <strong>of</strong> the scale test, the measured water<br />
pressure is prescribed in the model by applying a<br />
phreatic level to the clusters <strong>of</strong> the foam cushion.<br />
Therefore the measured water pressure is<br />
converted into a pressure head.<br />
The axial stiffness <strong>of</strong> the GR is determined from<br />
five tensile tests. The tensile tests are performed<br />
according to DIN EN ISO 10319. The GR is<br />
attached to a steel frame. The steel frame is<br />
modelled, the weight <strong>of</strong> the frame disturbs the<br />
load distribution. The parameters <strong>of</strong> the steel<br />
frame are based on the properties <strong>of</strong> steel.<br />
The sand layer on the pile and foam cushion and<br />
the granular material are modelled with the<br />
Hardening Soil model. The parameters <strong>of</strong> the sand<br />
and granular material are determined with triaxial<br />
tests. The sand layer is split up in two parts, a part<br />
above the pile and a part directly on the subsoil.<br />
The parameters are different for both parts. The<br />
sand on top <strong>of</strong> the pile is expected to behave very<br />
stiff, because the sand on the pile will be clamped<br />
between the GR and the pile. Therefore, the sand<br />
on the pile will be compressed more and will have<br />
higher stiffness and strength properties. The sand<br />
on the subsoil will follow the settlements <strong>of</strong> the<br />
subsoil and geosynthetics. In figure 4 the 3D finite<br />
element mesh created by <strong>Plaxis</strong> is shown.<br />
During the execution <strong>of</strong> the scale tests, part <strong>of</strong> the<br />
load is dissipated due to friction. The friction<br />
between the wall and the granular material is<br />
between 10% and 20%. Normally an interface is<br />
applied to model the friction. This interface should<br />
be applied along the box walls, which means at<br />
the left and back side <strong>of</strong> the model. In <strong>Plaxis</strong> 3D<br />
In the test series, circular piles are applied. For the<br />
<strong>Plaxis</strong> simulations, the geometry <strong>of</strong> the circular pile<br />
is converted to a square pile. The properties <strong>of</strong> the<br />
pile are based on the parameters <strong>of</strong> PVC. PVC is<br />
modelled linear elastic and non-porous material.<br />
Next to the pile the foam cushion is modelled. The<br />
watertight and soaked foam cushion behaves<br />
linear elastic in the scale test. The scale tests were<br />
controlled by both top load and draining the foam<br />
cushion and therefore decreasing the water<br />
Table 1: material properties <strong>of</strong> pile, subsoil, GR and frame (linear elastic)<br />
g[kN/m 3 ] E ref<br />
[kN/m 2 ] u[-] EA [kN/m]<br />
Pile 13.6 2.9E6 0.0 -<br />
Subsoil 10.2 10 0.2 -<br />
GR - - - 2269<br />
Frame 70.5 2.1E8 0 -<br />
Table 2: material properties <strong>of</strong> sand and granular material (Hardening Soil model)<br />
g[kN/m 3 ] c [kN/m 2 ] f [°] y [°]<br />
ref<br />
E 50<br />
[kN/m 2 ]<br />
ref<br />
E oed<br />
[kN/m 2 ] m [-]<br />
ref<br />
E ur<br />
[kN/m 2 ] u ur<br />
[-] r ref [kN/m 2 ] R 1<br />
[-]<br />
Sand above pile 20.1 1 40.9 10.9 51470 51470 0.5 154410 0.2 100 0.9<br />
Sand next to pile 18.7 1 32.5 2.5 19660 19660 0.5 58980 0.2 100 0.9<br />
Granular material 16.7 1 47.0 11.0 58870 58870 0.7 176610 0.2 100 0.9<br />
Figure 3: Top view and side view <strong>of</strong> finite element model<br />
14 <strong>Plaxis</strong> Bulletin l Spring issue 2012 l www.plaxis.nl
<strong>Numerical</strong> analysis <strong>of</strong> geosynthetic reinforced piled embankment scale model tests<br />
Figure 4: 3D finite element model<br />
Figure 5: Effective principal stresses <strong>of</strong> the vacuum phase<br />
Tunnel an interface cannot be applied at the back<br />
side. To keep the amount <strong>of</strong> load distribution<br />
comparable to the scale test, the top load is<br />
reduced by the amount <strong>of</strong> friction, and no<br />
interface is applied. The disturbance <strong>of</strong> the friction<br />
on the load distribution in the embankment is<br />
therefore neglected in the model. The friction<br />
between the piles and the foam cushion is<br />
assumed to be small and its influence on arching<br />
within the fill is limited. Therefore the friction<br />
between the pile and foam cushion is also<br />
neglected.<br />
The calculation phases <strong>of</strong> the model are based on<br />
the scale test procedure. The top load and water<br />
pressure measured during each step <strong>of</strong> the scale<br />
test procedure is an input value in the calculation<br />
phases. During the initial phase, the water<br />
pressure and SMweight are set to zero, to avoid<br />
an asymmetric situation. In the following phases,<br />
the scale test is build up and the soil weight is<br />
activated. Then the measured load with<br />
corresponding water pressure is applied. During<br />
the last phase, where there is no subsoil support<br />
against the GR, the subsoil and water pressure are<br />
deactivated.<br />
Figure 6: Vertical displacement <strong>of</strong> the vacuum phase<br />
Results<br />
During the vacuum phase there is a constant high<br />
top load applied and there is no subsoil support.<br />
Therefore, the vacuum phase has the largest<br />
deformation. This is the most representative<br />
situation and will be presented in the figures<br />
below. The calculated principal stresses in the<br />
vacuum phase are shown in figure 5. From the<br />
figure, soil arching can be observed. The<br />
calculated vertical displacements are shown in<br />
figure 6. The differential displacements on top <strong>of</strong><br />
the embankment are very small. The tensile forces<br />
in the GR are presented in figure 7. The tensile<br />
forces in the GR are concentrated in ‘tensile strips’.<br />
The tensile strips are the areas <strong>of</strong> that GR that lie<br />
on top <strong>of</strong> and between adjacent piles. The<br />
maximum tensile forces are found in the GR at the<br />
edge <strong>of</strong> the piles. The exact location <strong>of</strong> the peak<br />
values cannot be determined, because the mesh is<br />
too coarse.<br />
The load distribution for the FEM model and the<br />
scale test are plotted in figure 8. The horizontal<br />
axis presents the net load. The net load is the top<br />
load minus subsoil support and friction. Load<br />
parts A and B are presented on the vertical axis in<br />
kN per pile and as percentage <strong>of</strong> the total load<br />
(A+B+C). The figures show two types <strong>of</strong> loading:<br />
top load increase and drainage <strong>of</strong> subsoil<br />
(consolidation). The load transferred directly to the<br />
piles due to arching is load A and the load<br />
transferred through the GR to the piles is load B.<br />
During the first part <strong>of</strong> the test, until the net load is<br />
ca.11 kN/pile, the calculated results <strong>of</strong> load parts A<br />
and B agree quite well with the measured results.<br />
Then the calculated results diverge from the<br />
measured results. Load part A is overestimated<br />
and load part B is underestimated. The calculated<br />
load parts A and B show a smooth relationship<br />
with the net load. This agrees with the conclusion<br />
<strong>of</strong> the measurements. During the first drainage<br />
step with zero top load, the percentage <strong>of</strong> load<br />
part A (A %) increases significantly. This means<br />
that arching occurs immediately. Not only during<br />
the first drainage step, but also in the following<br />
drainage steps load part A % increases. This shows<br />
that subsoil settlement is needed for the<br />
development <strong>of</strong> arching. This conclusion can be<br />
drawn for both the measured and calculated<br />
results. During the steps with increasing top load,<br />
load part A % on the embankment decreases.<br />
From this it follows that during increasing top load<br />
the arching effect decreases, as long as<br />
consolidation does not occur.<br />
www.plaxis.nl l Spring issue 2012 l <strong>Plaxis</strong> Bulletin 15
<strong>Numerical</strong> analysis <strong>of</strong> geosynthetic reinforced piled embankment scale model tests<br />
Figure 7: Tensile forces in GR <strong>of</strong> vacuum phase in x-direction (left) and in y- direction (right)<br />
Figure 8: Load part A and B in kN/pile and in % <strong>of</strong> total load A+B+C<br />
Figure 9: Displacement<br />
16 <strong>Plaxis</strong> Bulletin l Spring issue 2012 l www.plaxis.nl
<strong>Numerical</strong> analysis <strong>of</strong> geosynthetic reinforced piled embankment scale model tests<br />
Displacements have been measured at three<br />
places: in the middle <strong>of</strong> four piles (z1), in the<br />
middle <strong>of</strong> two piles (z2) and close to a pile (z3).<br />
Displacements z1 and z3 are shown in figure 9.<br />
Displacement z2 is not shown, because this<br />
displacement does not differ from displacement<br />
z3. The displacement is presented as a function <strong>of</strong><br />
the net load. From the comparison <strong>of</strong> results<br />
between <strong>Plaxis</strong> and the measurements it can be<br />
concluded that the displacement is<br />
underestimated significantly by <strong>Plaxis</strong>. Farag<br />
(2008) also found much lower settlements in his<br />
<strong>Plaxis</strong> calculations. In CUR 226 (2010) this is solved<br />
by modelling a gap underneath the GR in the<br />
<strong>Plaxis</strong> calculations.<br />
Several possible causes <strong>of</strong> the underestimated<br />
displacements have been investigated: among<br />
them the behaviour <strong>of</strong> the subsoil, <strong>of</strong> the GR and<br />
<strong>of</strong> the granular material. Each individual aspect<br />
gives a very limited improvement conform the<br />
measured displacements. Therefore, the cause <strong>of</strong><br />
the underestimated displacements should be<br />
investigated in more detail.<br />
References<br />
• CUR 226, 2010, Ontwerprichtlijn paalmatrassystemen<br />
ISBN 978-90-376-0518-1 (in Dutch)<br />
• Den Boogert, T.J.M., 2011. <strong>Piled</strong> embankments<br />
with geosynthetic reinforcement, <strong>Numerical</strong><br />
analysis <strong>of</strong> scale model tests, Master <strong>of</strong> Science<br />
thesis, Delft University <strong>of</strong> Technology.<br />
• Van Eekelen, S.J.M., Bezuijen, A., Lodder, H.-J.<br />
& Van Tol, A.F., 2011a. Model experiments<br />
on piled embankments Part I, Geotextiles<br />
and Geomembranes, 2011, http://dx.doi.<br />
org/10.1016/j.geotexmem.2011.11.002<br />
• Van Eekelen, S.J.M., Lodder, H.J., Bezuijen, A.,<br />
2011b, Paalmatrasproeven I, Vervormingen van<br />
geokunstst<strong>of</strong>fen in een paalmatras en de daaruit<br />
volgende belastingsverdeling, GeoKunst<br />
42, april 2011, 42-44<br />
• Van Eekelen, S.J.M., Van der Vegt, J.W.G.,<br />
Lodder, H.J., Bezuijen, A., 2011c, Paalmatrasproeven<br />
II, belangrijkste conclusies, GeoKunst 43,<br />
juli 2011, pp 46-50<br />
Conclusions and recommendations<br />
From the FEM model is concluded that arching<br />
occurs in the granular material. The effective<br />
vertical stresses are concentrated on top and the<br />
area next to the piles. The tensile forces in the GR<br />
are concentrated in ‘tensile strips’ between the<br />
piles. The exact location <strong>of</strong> the greatest tensile<br />
forces could not be determined because <strong>of</strong> the<br />
coarseness <strong>of</strong> the mesh.<br />
In accordance with the measurements, <strong>Plaxis</strong><br />
calculations give a smooth relationship between<br />
the net load and load parts A and B, and the<br />
GR settlements. During the first part <strong>of</strong> the test,<br />
the load distribution <strong>of</strong> the model agrees quite<br />
well with the measured load distribution. During<br />
the second part <strong>of</strong> the test, the load transferred<br />
through arching is overestimated and the load<br />
transferred through the GR is underestimated.<br />
In general, <strong>Plaxis</strong> finds an increasing arch<br />
during drainage <strong>of</strong> the subsoil (consolidation),<br />
this is in agreement with the measurements.<br />
The displacements calculated with <strong>Plaxis</strong> are<br />
underestimated compared to the scale test<br />
results. However, the largest displacement <strong>of</strong> the<br />
GR is found at the middle <strong>of</strong> four piles.<br />
To increase the accuracy <strong>of</strong> the <strong>Plaxis</strong> results, the<br />
model should be calculated with a more refined<br />
mesh. The loss <strong>of</strong> load (due to friction) during the<br />
scale test is an important part <strong>of</strong> the scale test.<br />
It produces disturbance in the load distribution<br />
<strong>of</strong> the granular material. The friction should be<br />
included in the <strong>Plaxis</strong> model by an interface,<br />
therefore it is advised to perform numerical<br />
analysis <strong>of</strong> the scale model test with the full 3D<br />
version <strong>of</strong> <strong>Plaxis</strong>. The cause <strong>of</strong> the differences in<br />
calculated and measured displacement <strong>of</strong> the GR<br />
has to be investigated in more detail.<br />
www.plaxis.nl l Spring issue 2012 l <strong>Plaxis</strong> Bulletin 17