Chenik Lake - Cook Inlet Aquaculture Association, Kenai, Alaska
Chenik Lake - Cook Inlet Aquaculture Association, Kenai, Alaska
Chenik Lake - Cook Inlet Aquaculture Association, Kenai, Alaska

You also want an ePaper? Increase the reach of your titles
YUMPU automatically turns print PDFs into web optimized ePapers that Google loves.
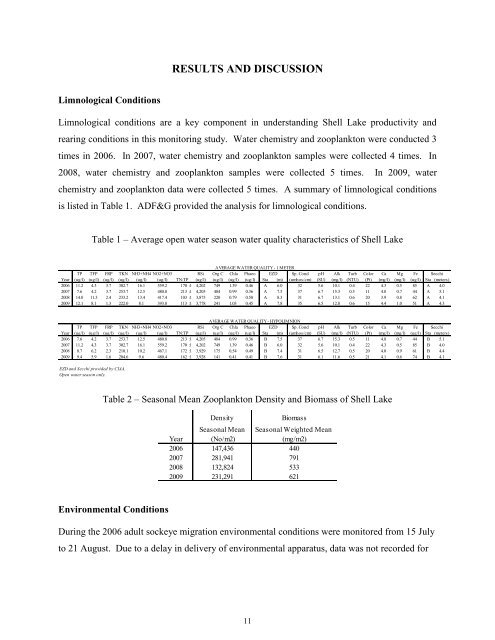
RESULTS AND DISCUSSION<br />
Limnological Conditions<br />
Limnological conditions are a key component in understanding Shell <strong>Lake</strong> productivity and<br />
rearing conditions in this monitoring study. Water chemistry and zooplankton were conducted 3<br />
times in 2006. In 2007, water chemistry and zooplankton samples were collected 4 times. In<br />
2008, water chemistry and zooplankton samples were collected 5 times. In 2009, water<br />
chemistry and zooplankton data were collected 5 times. A summary of limnological conditions<br />
is listed in Table 1. ADF&G provided the analysis for limnological conditions.<br />
Table 1 – Average open water season water quality characteristics of Shell <strong>Lake</strong><br />
AVERAGE WATER QUALITY - 1 METER<br />
TP TFP FRP TKN NH3+NH4 NO2+NO3 RSi Org C Chla Phaeo EZD Sp. Cond pH Alk Turb Color Ca Mg Fe Secchi<br />
Year (ug/l) (ug/l) (ug/l) (ug/l) (ug/l) (ug/l) TN:TP (ug/l) (ug/l) (ug/l) (ug/l) Sta (m) (umhos/cm) (SU) (mg/l) (NTU) (Pt) (mg/l) (mg/l) (ug/l) Sta (meters)<br />
2006 11.2 4.3 3.7 302.7 16.1 559.2 170 :1 4,202 749 1.39 0.46 A 6.0 32 5.6 10.1 0.4 22 4.3 0.5 85 A 4.0<br />
2007 7.6 4.2 3.7 253.7 12.5 480.8 213 :1 4,205 484 0.99 0.36 A 7.5 37 6.7 15.3 0.5 11 4.8 0.7 44 A 5.1<br />
2008 14.0 11.3 2.4 233.2 13.4 417.4 103 :1 3,875 220 0.79 0.50 A 8.3 31 6.7 13.1 0.6 20 3.9 0.8 62 A 4.1<br />
2009 12.1 8.1 1.3 222.0 8.1 393.8 113 :1 3,778 241 1.03 0.45 A 7.8 35 6.5 12.8 0.6 15 4.4 1.0 51 A 4.3<br />
AVERAGE WATER QUALITY - HYPOLIMNION<br />
TP TFP FRP TKN NH3+NH4 NO2+NO3 RSi Org C Chla Phaeo EZD Sp. Cond pH Alk Turb Color Ca Mg Fe Secchi<br />
Year (ug/l) (ug/l) (ug/l) (ug/l) (ug/l) (ug/l) TN:TP (ug/l) (ug/l) (ug/l) (ug/l) Sta (m) (umhos/cm) (SU) (mg/l) (NTU) (Pt) (mg/l) (mg/l) (ug/l) Sta (meters)<br />
2006 7.6 4.2 3.7 253.7 12.5 480.8 213 :1 4,205 484 0.99 0.36 B 7.5 37 6.7 15.3 0.5 11 4.8 0.7 44 B 5.1<br />
2007 11.2 4.3 3.7 302.7 16.1 559.2 170 :1 4,202 749 1.39 0.46 B 6.0 32 5.6 10.1 0.4 22 4.3 0.5 85 B 4.0<br />
2008 8.7 6.2 2.3 210.1 10.2 467.1 172 :1 3,929 175 0.54 0.49 B 7.4 31 6.5 12.7 0.5 20 4.0 0.9 61 B 4.4<br />
2009 9.4 5.9 1.6 204.6 9.6 480.4 162 :1 3,928 141 0.41 0.41 B 7.6 31 6.1 11.6 0.5 21 4.1 0.6 74 B 4.1<br />
EZD and Secchi provided by CIAA.<br />
Open water season only.<br />
Table 2 – Seasonal Mean Zooplankton Density and Biomass of Shell <strong>Lake</strong><br />
Density<br />
Biomass<br />
Seasonal Mean Seasonal Weighted Mean<br />
Year (No/m2) (mg/m2)<br />
2006 147,436 440<br />
2007 281,941 791<br />
2008 132,824 533<br />
2009 231,291 621<br />
Environmental Conditions<br />
During the 2006 adult sockeye migration environmental conditions were monitored from 15 July<br />
to 21 August. Due to a delay in delivery of environmental apparatus, data was not recorded for<br />
11