Chenik Lake - Cook Inlet Aquaculture Association, Kenai, Alaska
Chenik Lake - Cook Inlet Aquaculture Association, Kenai, Alaska
Chenik Lake - Cook Inlet Aquaculture Association, Kenai, Alaska

You also want an ePaper? Increase the reach of your titles
YUMPU automatically turns print PDFs into web optimized ePapers that Google loves.
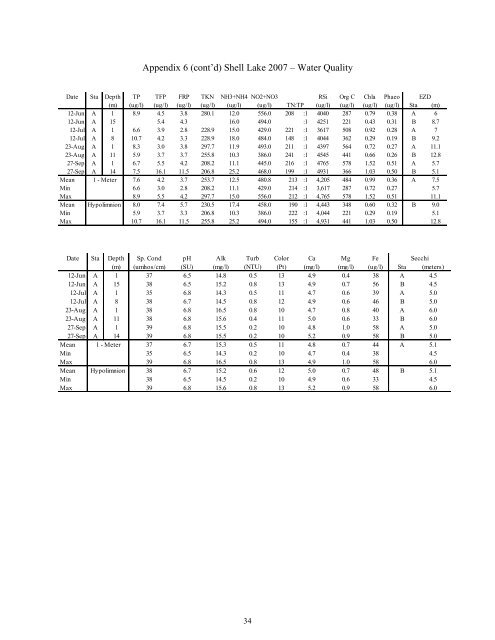
Appendix 6 (cont’d) Shell <strong>Lake</strong> 2007 – Water Quality<br />
Date Sta Depth TP TFP FRP TKN NH3+NH4 NO2+NO3 RSi Org C Chla Phaeo EZD<br />
(m) (ug/l) (ug/l) (ug/l) (ug/l) (ug/l) (ug/l) TN:TP (ug/l) (ug/l) (ug/l) (ug/l) Sta (m)<br />
12-Jun A 1 8.9 4.5 3.8 280.1 12.0 556.0 208 :1 4040 287 0.79 0.38 A 6<br />
12-Jun A 15 5.4 4.3 16.0 494.0 :1 4251 221 0.43 0.31 B 8.7<br />
12-Jul A 1 6.6 3.9 2.8 228.9 15.0 429.0 221 :1 3617 508 0.92 0.28 A 7<br />
12-Jul A 8 10.7 4.2 3.3 228.9 18.0 484.0 148 :1 4044 362 0.29 0.19 B 9.2<br />
23-Aug A 1 8.3 3.0 3.8 297.7 11.9 493.0 211 :1 4397 564 0.72 0.27 A 11.1<br />
23-Aug A 11 5.9 3.7 3.7 255.8 10.3 386.0 241 :1 4545 441 0.66 0.26 B 12.8<br />
27-Sep A 1 6.7 5.5 4.2 208.2 11.1 445.0 216 :1 4765 578 1.52 0.51 A 5.7<br />
27-Sep A 14 7.5 16.1 11.5 206.8 25.2 468.0 199 :1 4931 366 1.03 0.50 B 5.1<br />
Mean 1 - Meter 7.6 4.2 3.7 253.7 12.5 480.8 213 :1 4,205 484 0.99 0.36 A 7.5<br />
Min 6.6 3.0 2.8 208.2 11.1 429.0 214 :1 3,617 287 0.72 0.27 5.7<br />
Max 8.9 5.5 4.2 297.7 15.0 556.0 212 :1 4,765 578 1.52 0.51 11.1<br />
Mean Hypolimnion 8.0 7.4 5.7 230.5 17.4 458.0 190 :1 4,443 348 0.60 0.32 B 9.0<br />
Min 5.9 3.7 3.3 206.8 10.3 386.0 222 :1 4,044 221 0.29 0.19 5.1<br />
Max 10.7 16.1 11.5 255.8 25.2 494.0 155 :1 4,931 441 1.03 0.50 12.8<br />
Date Sta Depth Sp. Cond pH Alk Turb Color Ca Mg Fe Secchi<br />
(m) (umhos/cm) (SU) (mg/l) (NTU) (Pt) (mg/l) (mg/l) (ug/l) Sta (meters)<br />
12-Jun A 1 37 6.5 14.8 0.5 13 4.9 0.4 38 A 4.5<br />
12-Jun A 15 38 6.5 15.2 0.8 13 4.9 0.7 56 B 4.5<br />
12-Jul A 1 35 6.8 14.3 0.5 11 4.7 0.6 39 A 5.0<br />
12-Jul A 8 38 6.7 14.5 0.8 12 4.9 0.6 46 B 5.0<br />
23-Aug A 1 38 6.8 16.5 0.8 10 4.7 0.8 40 A 6.0<br />
23-Aug A 11 38 6.8 15.6 0.4 11 5.0 0.6 33 B 6.0<br />
27-Sep A 1 39 6.8 15.5 0.2 10 4.8 1.0 58 A 5.0<br />
27-Sep A 14 39 6.8 15.5 0.2 10 5.2 0.9 58 B 5.0<br />
Mean 1 - Meter 37 6.7 15.3 0.5 11 4.8 0.7 44 A 5.1<br />
Min 35 6.5 14.3 0.2 10 4.7 0.4 38 4.5<br />
Max 39 6.8 16.5 0.8 13 4.9 1.0 58 6.0<br />
Mean Hypolimnion 38 6.7 15.2 0.6 12 5.0 0.7 48 B 5.1<br />
Min 38 6.5 14.5 0.2 10 4.9 0.6 33 4.5<br />
Max 39 6.8 15.6 0.8 13 5.2 0.9 58 6.0<br />
34