Color Palette Generation for Nominal Encodings - Visualization
Color Palette Generation for Nominal Encodings - Visualization
Color Palette Generation for Nominal Encodings - Visualization

You also want an ePaper? Increase the reach of your titles
YUMPU automatically turns print PDFs into web optimized ePapers that Google loves.
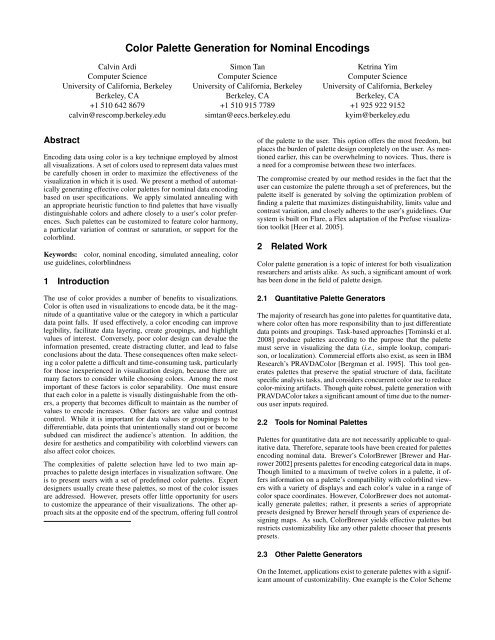
<strong>Color</strong> <strong>Palette</strong> <strong>Generation</strong> <strong>for</strong> <strong>Nominal</strong> <strong>Encodings</strong><br />
Calvin Ardi<br />
Computer Science<br />
University of Cali<strong>for</strong>nia, Berkeley<br />
Berkeley, CA<br />
+1 510 642 8679<br />
calvin@rescomp.berkeley.edu<br />
Simon Tan<br />
Computer Science<br />
University of Cali<strong>for</strong>nia, Berkeley<br />
Berkeley, CA<br />
+1 510 915 7789<br />
simtan@eecs.berkeley.edu<br />
Ketrina Yim<br />
Computer Science<br />
University of Cali<strong>for</strong>nia, Berkeley<br />
Berkeley, CA<br />
+1 925 922 9152<br />
kyim@berkeley.edu<br />
Abstract<br />
Encoding data using color is a key technique employed by almost<br />
all visualizations. A set of colors used to represent data values must<br />
be carefully chosen in order to maximize the effectiveness of the<br />
visualization in which it is used. We present a method of automatically<br />
generating effective color palettes <strong>for</strong> nominal data encoding<br />
based on user specifications. We apply simulated annealing with<br />
an appropriate heuristic function to find palettes that have visually<br />
distinguishable colors and adhere closely to a user’s color preferences.<br />
Such palettes can be customized to feature color harmony,<br />
a particular variation of contrast or saturation, or support <strong>for</strong> the<br />
colorblind.<br />
Keywords: color, nominal encoding, simulated annealing, color<br />
use guidelines, colorblindness<br />
1 Introduction<br />
The use of color provides a number of benefits to visualizations.<br />
<strong>Color</strong> is often used in visualizations to encode data, be it the magnitude<br />
of a quantitative value or the category in which a particular<br />
data point falls. If used effectively, a color encoding can improve<br />
legibility, facilitate data layering, create groupings, and highlight<br />
values of interest. Conversely, poor color design can devalue the<br />
in<strong>for</strong>mation presented, create distracting clutter, and lead to false<br />
conclusions about the data. These consequences often make selecting<br />
a color palette a difficult and time-consuming task, particularly<br />
<strong>for</strong> those inexperienced in visualization design, because there are<br />
many factors to consider while choosing colors. Among the most<br />
important of these factors is color separability. One must ensure<br />
that each color in a palette is visually distinguishable from the others,<br />
a property that becomes difficult to maintain as the number of<br />
values to encode increases. Other factors are value and contrast<br />
control. While it is important <strong>for</strong> data values or groupings to be<br />
differentiable, data points that unintentionally stand out or become<br />
subdued can misdirect the audience’s attention. In addition, the<br />
desire <strong>for</strong> aesthetics and compatibility with colorblind viewers can<br />
also affect color choices.<br />
The complexities of palette selection have led to two main approaches<br />
to palette design interfaces in visualization software. One<br />
is to present users with a set of predefined color palettes. Expert<br />
designers usually create these palettes, so most of the color issues<br />
are addressed. However, presets offer little opportunity <strong>for</strong> users<br />
to customize the appearance of their visualizations. The other approach<br />
sits at the opposite end of the spectrum, offering full control<br />
of the palette to the user. This option offers the most freedom, but<br />
places the burden of palette design completely on the user. As mentioned<br />
earlier, this can be overwhelming to novices. Thus, there is<br />
a need <strong>for</strong> a compromise between these two interfaces.<br />
The compromise created by our method resides in the fact that the<br />
user can customize the palette through a set of preferences, but the<br />
palette itself is generated by solving the optimization problem of<br />
finding a palette that maximizes distinguishability, limits value and<br />
contrast variation, and closely adheres to the user’s guidelines. Our<br />
system is built on Flare, a Flex adaptation of the Prefuse visualization<br />
toolkit [Heer et al. 2005].<br />
2 Related Work<br />
<strong>Color</strong> palette generation is a topic of interest <strong>for</strong> both visualization<br />
researchers and artists alike. As such, a significant amount of work<br />
has been done in the field of palette design.<br />
2.1 Quantitative <strong>Palette</strong> Generators<br />
The majority of research has gone into palettes <strong>for</strong> quantitative data,<br />
where color often has more responsibility than to just differentiate<br />
data points and groupings. Task-based approaches [Tominski et al.<br />
2008] produce palettes according to the purpose that the palette<br />
must serve in visualizing the data (i.e., simple lookup, comparison,<br />
or localization). Commercial ef<strong>for</strong>ts also exist, as seen in IBM<br />
Research’s PRAVDA<strong>Color</strong> [Bergman et al. 1995]. This tool generates<br />
palettes that preserve the spatial structure of data, facilitate<br />
specific analysis tasks, and considers concurrent color use to reduce<br />
color-mixing artifacts. Though quite robust, palette generation with<br />
PRAVDA<strong>Color</strong> takes a significant amount of time due to the numerous<br />
user inputs required.<br />
2.2 Tools <strong>for</strong> <strong>Nominal</strong> <strong>Palette</strong>s<br />
<strong>Palette</strong>s <strong>for</strong> quantitative data are not necessarily applicable to qualitative<br />
data. There<strong>for</strong>e, separate tools have been created <strong>for</strong> palettes<br />
encoding nominal data. Brewer’s <strong>Color</strong>Brewer [Brewer and Harrower<br />
2002] presents palettes <strong>for</strong> encoding categorical data in maps.<br />
Though limited to a maximum of twelve colors in a palette, it offers<br />
in<strong>for</strong>mation on a palette’s compatibility with colorblind viewers<br />
with a variety of displays and each color’s value in a range of<br />
color space coordinates. However, <strong>Color</strong>Brewer does not automatically<br />
generate palettes; rather, it presents a series of appropriate<br />
presets designed by Brewer herself through years of experience designing<br />
maps. As such, <strong>Color</strong>Brewer yields effective palettes but<br />
restricts customizability like any other palette chooser that presents<br />
presets.<br />
2.3 Other <strong>Palette</strong> Generators<br />
On the Internet, applications exist to generate palettes with a significant<br />
amount of customizability. One example is the <strong>Color</strong> Scheme
Chooser [WebsiteTips.com 2008], an application that produces a<br />
palette given a base color and color scheme options. Some applications<br />
can even produce palettes based on an uploaded image [Adobe<br />
2008]. In general, these generators produce palettes that are high in<br />
aesthetic value but are not meant <strong>for</strong> data encodings. The interfaces<br />
of such tools, however, provided a significant amount of inspiration<br />
<strong>for</strong> our generator’s user interface.<br />
3 Methods and Implementation<br />
3.1 User Options<br />
Since our solution provides a way <strong>for</strong> users to input preferences <strong>for</strong><br />
influencing the palette generation, it is necessary to describe what<br />
each of these preferences are be<strong>for</strong>e delving into how our system<br />
utilizes them.<br />
3.1.1 Size<br />
This is the number of colors desired in the resulting palette. We can<br />
theoretically support any number of colors in a palette, but we find<br />
that very large palettes would inevitably contain colors that would<br />
be difficult to differentiate from each other. We allow anywhere<br />
from 3 to 50 colors per palette in our implementation, but resulting<br />
palettes of 20 colors or more are usually undesirable. The default<br />
setting is 10 colors.<br />
3.1.2 Harmony<br />
The concept of color harmony refers to palettes that have “thematic”<br />
colors. For example, a “warm” palette would primarily have<br />
colors from the red-orange-yellow part of the hue spectrum. In our<br />
implementation, we allow the user to specify these types of color<br />
harmony in the resulting palettes:<br />
Warm colors palettes that have a majority of their colors in the<br />
red-yellow/green hue range<br />
Cool colors palettes that have a majority of their colors in the<br />
green-violet hue range<br />
Specific color palettes that tend to have their hues near the hue of<br />
a specified color<br />
3.1.3 Variations<br />
<strong>Color</strong> palette variations are other types of color schemes that might<br />
be desirable <strong>for</strong> a visualization designer using nominal color encodings.<br />
We allow the user to specify one of the following options <strong>for</strong><br />
color variation:<br />
Pastel colors palettes with colors that have low saturation values<br />
Bright colors palettes with colors that have high saturation values<br />
High contrast colors palettes with colors that have high contrast<br />
with each other and a specified background color<br />
Low contrast colors palettes with colors that have lower contrast<br />
levels with each other and a specified background color<br />
3.1.4 <strong>Color</strong>blindness<br />
One of the more difficult tasks <strong>for</strong> a palette designer is in choosing<br />
colors that would not be confused by a person with colorblindness.<br />
We offer the ability to generate palettes that avoids sets of colors<br />
that would look too similar to a colorblind person:<br />
Red-Green colorblindness Avoids having both red and green<br />
hues appear in the palette<br />
Blue-Yellow colorblindness Avoids having both blue and yellow<br />
hues appear in the palette<br />
Together, these two options allow <strong>for</strong> the creation of palettes that<br />
have colors fully distinguishable from each other <strong>for</strong> the vast majority<br />
of those who have some sort of colorblindness. (∼1.3% of<br />
the people in the United States [WrongDiagnosis.com 2008])<br />
3.1.5 Background <strong>Color</strong><br />
The user can specify the hex-value of the color used as a background<br />
<strong>for</strong> the visualization with this option. This is needed to<br />
prevent the generation of palettes with colors too similar to the<br />
background (one of Brewer’s <strong>Color</strong> Use Guidelines [Brewer 1999]).<br />
This option is white (0xFFFFFF) by default.<br />
3.2 Simulated Annealing<br />
Our use of simulated annealing to approach this problem was born<br />
out of a desire <strong>for</strong> an algorithm with these traits:<br />
• The opportunity to use a heuristic function to judge the quality<br />
of color palettes<br />
• The ability to traverse the possible space of color palettes iteratively,<br />
in order to use our heuristic in such a way as to<br />
determine the “best” palettes of that space.<br />
Our implementation of simulated annealing is not the pure <strong>for</strong>m of<br />
annealing that is described in most artificial intelligence literature.<br />
We have made modifications to make it more suitable <strong>for</strong> our purpose.<br />
An outline of our algorithm follows in Algorithm 1.<br />
Algorithm 1 Simulated Annealing Algorithm<br />
currentP alette ← default palette<br />
currentScore ← heuristic(currentP alette)<br />
<strong>for</strong> i = 1 to numRounds do<br />
newP alette ← perturb(currentP alette)<br />
newScore ← heuristic(newP alette)<br />
if newScore > currentScore or rand(0, 1) < exp − ∆score<br />
T<br />
then<br />
currentP alette ← newP alette<br />
currentScore ← newScore<br />
end if<br />
i ← i + 1<br />
end <strong>for</strong><br />
3.2.1 Starting <strong>Palette</strong><br />
Depending on the user’s options <strong>for</strong> desired “color harmony” (none,<br />
warm, cool, or a revolving around a specific color), we started<br />
the algorithm with different initial palettes. For warm and cool<br />
options, we start with palettes generated from the Flare library’s<br />
<strong>Color</strong><strong>Palette</strong>.hot() and <strong>Color</strong><strong>Palette</strong>.cool() functions<br />
respectively. If the user wants a palette that harmonizes<br />
around a specific color, we start with a palette composed only of<br />
that particular color. Another option would be to start with a diverging<br />
palette centered on that particular color, which we did not<br />
explore.<br />
If the user has no desired color harmony <strong>for</strong> the palette, we<br />
start with the nominal encodings given by the Flare library<br />
<strong>Color</strong><strong>Palette</strong>.category() function. Although this means<br />
that the process begins with a quality, hand-chosen color palette,
3.2.4 Stopping Condition<br />
We did not consider a more intelligent stopping condition <strong>for</strong> our<br />
algorithm; rather, we decided to have a set number of rounds of<br />
simulated annealing and adjusted that to study the impact of our<br />
annealing on the resulting palettes. We generally ran about 10,000<br />
rounds, but could feasibly run 100,000 rounds be<strong>for</strong>e the runtime<br />
environment became unstable (see Per<strong>for</strong>mance).<br />
3.3 Heuristics<br />
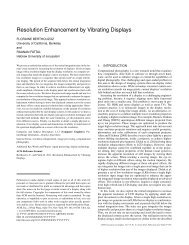
Figure 1: Adjustments of Hue, Saturation, and Value in a 3-<br />
dimensional representation of the color space. [SharkD 2008]<br />
we hope that the random properties of the algorithm result in movement<br />
away from the Flare palette to other unique palettes, perhaps<br />
just as high or higher in score.<br />
3.2.2 Perturbations<br />
At each iteration, we perturb the current palette by altering a random<br />
feature of a random color within it. In order to better control<br />
the effects we have on the colors in the dimensions we care<br />
about within the heuristic, we perturb by randomly incrementing or<br />
decrementing a color’s hue, saturation, or value at each step. The<br />
Hue-Saturation-Value (HSV) color space is shown in Figure 1.<br />
The amount we affect these values by at each iteration is constant<br />
(0.05, where hue, saturation, and value ∈ [0, 1]). However, we<br />
divide this factor in half <strong>for</strong> Hue modifications when we detect that<br />
the user has chosen a color harmony preference, since this implies<br />
that colors should not stray much from a defined range of hues.<br />
By affecting palettes in this way, we essentially have the ability to<br />
efficiently traverse the entire three-dimensional space of color <strong>for</strong><br />
each element of the palette. With an infinite amount of rounds,<br />
we can theoretically reach every possible combination of colors <strong>for</strong><br />
palettes of any size.<br />
3.2.3 Iterations<br />
We calculate a score <strong>for</strong> every palette we generate through our perturbations<br />
using our modular heuristic function (see Heuristics),<br />
and decide whether to accept or reject each new palette by comparing<br />
it with the previous palette.<br />
Normally, we accept a new palette if it scores better than the previous<br />
one. However, to prevent our algorithm from inflexibility at<br />
a local maximum, we accept palettes that are worse with a small<br />
probability that goes down as more iterations are completed. The<br />
probability that a worse palette is accepted is e − ∆scores<br />
T , where T is<br />
the number of rounds of the algorithm left to run. Hence, as T approaches<br />
zero, our algorithm gradually reduces to the pure greedy<br />
algorithm which will only accept palettes if they are better.<br />
In order to evaluate a generated palette, a set of heuristics is employed<br />
in the <strong>for</strong>m of a general scoring function. The scoring function<br />
returns a linear combination of various weights multiplied with<br />
scores returned from different modules that evaluate certain aspects<br />
of each color within the palette, or the palette itself. All of the<br />
modules evaluate the palette based on the HSV color model, which<br />
allows <strong>for</strong> easier identification of the colors: a specific hue value defines<br />
a color, while a color represented in the RGB additive model<br />
is a combination of the three primary colors.<br />
A default set of “good” values are created. If none of the user<br />
options are selected, the scoring function will evaluate the palette<br />
based on values previously prescribed (Figure 2). Options selected<br />
otherwise will modify certain values and ranges based on the preference<br />
(e.g., if the cool “color’ harmony’ option is selected, we<br />
explicitly define the range in hue values that are acceptable).<br />
All modules in the heuristic return normalized scores with range<br />
[−1, 1]. This allows <strong>for</strong> greatest flexibility when determining<br />
weights, as the individual can tailor the scoring function based on<br />
his or her preferences. This also opens up future work regarding<br />
how the weights are calculated.<br />
Aspect Values<br />
Contrast [0.2 − 0.8]<br />
Hue [0 ◦ − 360 ◦ ]<br />
Saturation [0.5 − 1.0]<br />
Value [0.5 − 1.0]<br />
Figure 2: Prescribed default values<br />
3.3.1 Pre-<strong>Generation</strong> Modules<br />
Be<strong>for</strong>e the scoring function is run, these modules make the appropriate<br />
modifications to acceptable HSV values based on what<br />
palette preference or color harmony the user selects. Depending on<br />
the configuration or preference that a user has, the preferred values<br />
<strong>for</strong> each characteristic of a color is redefined and updated if the user<br />
changes input values.<br />
In particular, “harmony” choices change optimal hue values, while<br />
choices in “variations” change contrast, saturation, or value ranges<br />
(Figure 3). Pastel colors, <strong>for</strong> example, require a saturation range<br />
between 0.30 and 0.65; in all cases, as color is highly subjective,<br />
values were chosen based on group consensus. Unless otherwise<br />
noted, any ranges not modified were left to the default values listed<br />
in Figure 2.<br />
3.3.2 HSV Evaluation Modules<br />
Several modules in the heuristic are dedicated to the validation of<br />
various HSV values; although implemented in separate modules in<br />
the Flare library, their discussion and implementation can be summarized<br />
together under the same heading. In general, these modules<br />
iterate through the palette, checking to make sure each aspect of the
t <strong>Palette</strong> Preference Aspect Values<br />
Warm Hue [0 ◦ − 63 ◦ , 330 ◦ − 360 ◦ ]<br />
Cool Hue [90 ◦ − 300 ◦ ]<br />
Specific base color Hue [hue − 10 ◦ , hue + 10 ◦ ]<br />
High contrast Contrast [0.6 − 1.0]<br />
Low contrast Contrast [0.0 − 0.5]<br />
Pastel colors Saturation [0.30 − 0.65]<br />
Bright colors Value [0.85 − 1.0]<br />
Figure 3: Preferences and Corresponding Ranges<br />
colors fit within a specified threshold (Figure 2, 3) and score the<br />
palette appropriately.<br />
Brewer [Brewer 1999] also notes that most people prefer blue colors<br />
to yellow; this has been implemented, but weighted lower relative<br />
to the other heuristic modules as it would not be ideal to have a<br />
palette that consisted of only blue hues.<br />
Finally, our palette should have “spacing” between attributes and<br />
values of each color. For example, it will not be an optimal palette<br />
if there are two colors with similar hues. Likewise, palettes containing<br />
colors with different hues yet low values of saturation and value<br />
would not be optimal either. All the colors would have muted hues<br />
and be almost indistinguishable from each other. The “neighboring<br />
values” module penalizes palettes that have colors whose values are<br />
too similar with one another.<br />
3.3.3 Saturation/Lightness Variation Modules<br />
In addition to variations in hue, Brewer [Brewer 1999] noted<br />
that qualitative schemes benefit from small variations in lightness<br />
(value) and saturation. The standard deviation of the lightness<br />
and saturation is taken from all the colors in the palette and subtracted<br />
by an optimal saturation and lightness deviation value, 0.3<br />
and 0.086, respectively. The resulting score is the difference between<br />
the absolute difference between the two standard deviations<br />
and 1.0.<br />
3.3.4 <strong>Color</strong>blindness Module<br />
<strong>Palette</strong>s can be created and tailored to colorblind audiences. In each<br />
major type of colorblindness (red-green and blue-yellow), we not<br />
only check to make sure that certain hues are avoided, but also that<br />
they must fit within a specific saturation and value threshold in order<br />
<strong>for</strong> a “penalty” to be assessed. By navigating the HSV color space,<br />
one can determine that most colors with saturation or value less<br />
than 0.5 tend to have their hues indistinguishable. A color with<br />
saturation and value equal to 0.0 will be black, regardless of hue.<br />
3.3.5 Contrast Modules<br />
<strong>Color</strong>s in palettes, in general, should have an appropriate amount<br />
of contrast between each other, and with the background. First, the<br />
relative luminance, defined by equation (1) [Stokes et al. 1996], of<br />
each color is calculated. We then calculate the Michelson contrast,<br />
equation (2) [Michelson 1927], found by dividing the sum of the<br />
two luminance values by the absolute value of their difference.<br />
luminance = 0.2126R + 0.7152G + 0.07522B (1)<br />
contrast =<br />
Imax − Imin<br />
I max − I min<br />
(2)<br />
The Michelson contrast is used when comparing the contrast of a<br />
color to the background color due to potential divide-by-zero errors<br />
associated with the Weber contrast (3).<br />
3.3.6 Language Module<br />
contrast = I − I background<br />
I background<br />
(3)<br />
Module Weight (α).<br />
hue 10.0<br />
blue/yellow 1.0<br />
colorblindness 30.0<br />
contrast 1.0<br />
background 1.0<br />
neighbor 15.5<br />
saturation threshold 5.5<br />
saturation variation 1.5<br />
lightness variation 1.5<br />
language 1.0<br />
Figure 4: Weights and Modules<br />
Brewer [Brewer 1999] notes “[in] addition to red, green, yellow,<br />
and blue, the other basic colors named in all fully-developed languages<br />
are pink, purple, orange, brown, gray, white, and black.” A<br />
module was developed that encompasses these ranges of colors and<br />
positively affects the heuristic score if these hues exist within the<br />
palette. To avoid excessive influence on the palette results, however,<br />
the weight associated with this module is significantly lower<br />
than the weights of other modules.<br />
3.3.7 Scoring Function<br />
Given the modules, we can then generalize the scoring function in<br />
equation (4), where N is the number of modules that exist, module<br />
refers to a heuristic module that evaluates and scores a palette<br />
<strong>for</strong> a certain quality (normalized to the range [−1, 1]) and α is the<br />
associated weight given to that particular module.<br />
heuristic score =<br />
NX<br />
α i × module i (4)<br />
The list of weights and their corresponding modules used can be<br />
found in Table 4.<br />
3.4 Extension to Flare<br />
Because Flare is an open-source visualization toolkit, we were able<br />
to implement our palette generator as a Flex library based on Flare,<br />
in hopes of presenting it as an extension package. The generator<br />
consists of three classes:<br />
<strong>Nominal</strong><strong>Color</strong>EncodingGenerator.as This class contains the<br />
simulated annealing algorithm used to generate palettes iteratively.<br />
It also contains the perturbation function used to traverse<br />
the color space.<br />
NCEGHeuristic.as This Strategy class contains the heuristic<br />
function used to evaluate each intermediate palette during the<br />
annealing process.<br />
<strong>Color</strong>Options.as This class is the type of the object used to pass<br />
user-specified options to the palette generator. It also contains<br />
the static variables used to refer to each parameter value by<br />
name.<br />
i=1
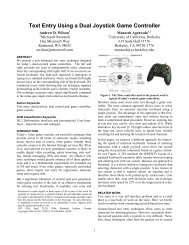
Figure 5: A screenshot of the graphical frontend<br />
3.4.1 Graphical User Interface Wrapper<br />
To provide a visual demonstration of how our palette generator<br />
works, we implemented a graphical user interface to our Flex library.<br />
It displays the available palette options as a control panel<br />
and the results of running the algorithm with these options on the<br />
right. The resulting palettes are represented as a list consisting of<br />
each color and its corresponding 32-bit hexadecimal value (with the<br />
first two digits being the color’s alpha, which is always 0xFF). The<br />
graphical user interface is shown in Figure 5.<br />
The control panel consists of six components. From top to bottom,<br />
they are:<br />
<strong>Palette</strong> size input adjusted by clicking the “+” and “−” buttons on<br />
either side of the displayed number<br />
<strong>Color</strong> harmony input when the “Custom Base” option is selected<br />
here, a text box to enter the custom base color as a 24-bit<br />
hexadecimal value becomes active<br />
<strong>Color</strong> style input<br />
<strong>Color</strong>blindness compatibility input<br />
Background color input affects both the heuristic and the background<br />
that the generated palette is displayed against<br />
“Generate” button when pressed, this reads in the user input<br />
specified above it and runs the generator with those options<br />
4 Results<br />
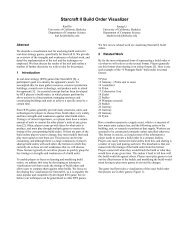
4.1 Sample <strong>Palette</strong>s<br />
Figure 6 presents a set of screenshots of palettes generated through<br />
the graphical interface.<br />
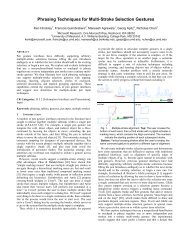
4.2 In Context with Data<br />
In her guidelines, Brewer explains that the appearance of a color is<br />
often affected by its context [Brewer 1999]. There<strong>for</strong>e, a true measure<br />
of a palette’s effectiveness can only be obtained by actually<br />
mapping the colors to some data and examining the resulting visualization.<br />
We present our generated palettes in context with data<br />
Figure 6: Samples of generated 10 color palettes<br />
by using them to encode the nominal variable of decay mode in an<br />
interactive table of isotopes [Yim 2008] implemented in Flex/Flare.<br />
Screenshots of the resulting visualizations are shown in Figures 8<br />
and 9.<br />
4.3 Per<strong>for</strong>mance<br />
Per<strong>for</strong>mance requirements vary depending on the usage scenario.<br />
That is, the number of rounds may require adjustment based on the<br />
application. As stated earlier, the color palette generator is a Flex library<br />
which outputs a color palette that can be used immediately <strong>for</strong><br />
visualization. An alternative is to use the included graphical frontend<br />
to view the generated colors and export them <strong>for</strong> use in another<br />
application or visualization tool. Thus, if being used with visualizations<br />
designed in Flare, the number of rounds should be decreased<br />
such that there is no excessive delay in generating a palette. Likewise,<br />
a user selecting colors from the interface can af<strong>for</strong>d to take<br />
the time to increase the number of rounds and implement the colors<br />
into his or her visualization manually.<br />
<strong>Color</strong> generation was done with the default settings: a palette size<br />
of ten with no additional options enabled. Debug statements were<br />
suppressed and the user interface was run using Adobe Flash 9 and<br />
Mozilla Firefox 3.0.4 on Apple’s Mac OS X on an Intel Core 2<br />
Duo 2.4 GHz system. Running 1,000 rounds resulted in times varying<br />
from 690ms to 774ms, with a linear correlation between time<br />
and rounds (Figure 7). Running at 40,000 rounds resulted in run<br />
times around 28,000ms. We found that running anything greater<br />
than 100,000 rounds resulted in a timeout built into Adobe Flex;<br />
regardless, the amount of time required running that many rounds<br />
would be highly impractical <strong>for</strong> Flare visualizations. If this many<br />
rounds were needed, the generator should be implemented in a more
efficient language <strong>for</strong> more optimal run times.<br />
Rounds Times (ms)<br />
1,000 690 − 774<br />
10,000 7101 − 7261<br />
20,000 13976 − 14368<br />
40,000 28427 − 28989<br />
Figure 7: <strong>Generation</strong> running times<br />
Part of the per<strong>for</strong>mance issue is due to the way we implemented<br />
the heuristic. The heuristic is designed to remain flexible and allow<br />
quick modification or removal of each of the individual scoring<br />
modules. A more optimized version could potentially be implemented<br />
by combining several of the modules with related calculations<br />
into a more efficient larger module.<br />
5 Discussion<br />
Currently, there are two main issues with our generated palettes.<br />
First, palettes sometimes have colors that are visually difficult to<br />
distinguish, even though the colors have significantly different hexadecimal<br />
values. Our heuristic does take into consideration the pairwise<br />
contrast of colors in a palette, so it is likely that these undesirable<br />
subsets emerge when the simulated annealing is trapped at a<br />
local maximum. This can occur despite the fact that the simulated<br />
annealing algorithm has provisions to continue exploring the color<br />
space, even when local maxima are hit. Another issue is that since<br />
aesthetic value is difficult to encode as a numeric feature, and thus<br />
was not included as part of our heuristic, a high heuristic score does<br />
not necessarily mean the palette is aesthetically pleasing. A user<br />
may have to go through several rounds of palette generation with<br />
the same parameters be<strong>for</strong>e an attractive palette is obtained.<br />
From our work, it can be realized that evaluating a palette’s overall<br />
“quality” with a score is nontrivial. Expert designers who create<br />
color palettes <strong>for</strong> visualizations consider many factors beyond<br />
what we have encoded in our heuristic function. For designers who<br />
require good color schemes without the time expense associated<br />
with handpicking colors <strong>for</strong> the most optimal palette, we believe<br />
our color palette generation system can be used <strong>for</strong> its efficiency<br />
and effectiveness.<br />
6 Future Work<br />
We have several ideas on how to build upon the work that has been<br />
presented here.<br />
6.1 Heuristic Modules and Weights<br />
Potential work could be done with regards to adjustments to the<br />
weights of the scoring function. Weights and values are subjectively<br />
chosen and attempt to optimize palettes that cater to a variety of audiences<br />
and users. Using machine learning or supervised learning,<br />
weights and other values can be learned and automatically adjusted<br />
based on user preference. In particular, one could train the system<br />
to adapt to a user’s preferences by showing two different palette<br />
choices multiple times, then adjusting and saving the weights based<br />
on their choices. For future use, especially if implemented using<br />
the Flare visualization library, these weights can be passed in as parameters<br />
so the system does not have to be continuously retrained.<br />
In addition, the library has been developed such that new modules<br />
can be added with ease. Modules may be created in response to<br />
new work in color representation, newfound color guidelines, or<br />
the changing preferences of a target audience.<br />
6.2 Aesthetics and “Frozen <strong>Color</strong>s”<br />
Often, palette designers are highly selective about the colors they<br />
wish to use. Our system may try its best to follow color use guidelines,<br />
but it currently cannot consider the aesthetics of palettes it<br />
creates. One could imagine drawing from a source of color aesthetics<br />
guidelines to complement our heuristic. However, it should<br />
be noted that aesthetics are very subjective and even this approach<br />
would not be guaranteed to produce palettes that are aesthetically<br />
pleasing to all people.<br />
Alternatively, our graphical frontend to the system could provide a<br />
way <strong>for</strong> users to specify which colors they definitely want in their<br />
palette and which they do not care <strong>for</strong>. This could be done by allowing<br />
users to “freeze” colors after a palette is generated and then run<br />
the generation again with those colors protected from perturbation.<br />
6.3 Improved Termination Condition<br />
Currently, our simulated annealing terminates at a set number of<br />
rounds. A better solution would be to stop when a certain score<br />
threshold is crossed, when perturbations are detected to do more<br />
harm than good to the palette’s score, or when perturbations have<br />
little effect on the score.<br />
Another approach would be to determine an appropriate minimum<br />
number of rounds of simulated annealing to run. This could be<br />
accomplished by running many trials where scores are recorded at<br />
each round. These records could then be examined to figure out<br />
where scores typically converge, leading to an ideal baseline of iterations.<br />
6.4 Using Data<br />
We note that some of Brewer’s <strong>Color</strong> Use Guidelines [Brewer 1999]<br />
require a palette to be judged in context with the data that the colors<br />
are going to be encoding. For example, Brewer suggests using saturation<br />
to emphasize smaller categories as they are naturally hard<br />
to see on a graphic.<br />
Currently, our algorithm produces palettes with no consideration of<br />
the data they will be used to encode. In addition, the colors are<br />
displayed in the style of a legend, which Brewer warns is a poor<br />
view <strong>for</strong> palette evaluation. These issues can be addressed with one<br />
of two methods.<br />
One would be to do as Brewer herself does and generate fake data to<br />
visualize with the palettes. This would involve dynamically generating<br />
fake data <strong>for</strong> each palette generation or loading a prepared set<br />
of fake data as part of the application. However, this does not factor<br />
into the algorithm and may require users to run the algorithm many<br />
times over to find a palette that works with a data set that they would<br />
not even use. Alternatively, real data sets could be passed into the<br />
algorithm to be analyzed as part of a heuristic module. This would<br />
require much overhead in data processing, which may not be desired<br />
in a package such as ours. However, it does open the doors<br />
to many possibilities <strong>for</strong> data analysis to play a role in determining<br />
which colors should be placed near each other on a graphic, which<br />
our algorithm currently cannot consider.<br />
7 Conclusion<br />
We have presented a method <strong>for</strong> algorithmically generating original,<br />
high-quality color palettes <strong>for</strong> use in nominal (categorical) encodings.<br />
We have applied the technique of simulated annealing to<br />
traverse the space of color palettes iteratively, using a heuristic to
score palettes and work our way towards palettes that follow sound<br />
color use guidelines.<br />
Our novel method <strong>for</strong> iterating through the space of color palettes<br />
is a modified version of the simulated annealing algorithm that is<br />
affected by the palette options it is initialized with. While based<br />
on a randomized search, our iterative process begins with palettes<br />
that are not actually random; rather, they are tailored to the user’s<br />
preferences <strong>for</strong> color harmony. In addition, the amounts by which<br />
we perturb color values are dependent on this preference as well.<br />
We have also introduced a modular heuristic function that is able<br />
to score palettes based on many sound color use guidelines. This<br />
heuristic could possibly be used in other applications to judge the<br />
quality of a color palette used <strong>for</strong> visualizations.<br />
This work is presented as an extension to the Prefuse/Flare visualization<br />
library by Jeffery Heer, and we hope that it can be useful to<br />
anyone using the library to create visualizations requiring color as<br />
an encoding <strong>for</strong> nominal variables.<br />
Acknowledgements<br />
We thank Professor Maneesh Agrawala <strong>for</strong> allowing us to produce<br />
this system as part of a graduate course on visualization. We also<br />
thank Jeffery Heer <strong>for</strong> his Prefuse/Flare toolkit, on which this system<br />
and graphical frontend is built.<br />
References<br />
ADOBE, 2008. Kuler. http://kuler.adobe.com.<br />
BERGMAN, L. D., ROGOWITZ, B. E., AND TREINISH, L. 1995.<br />
A rule-based tool <strong>for</strong> assisting colormap selection. In IEEE <strong>Visualization</strong>,<br />
118–125.<br />
BREWER, C. A., AND HARROWER, M. A., 2002. <strong>Color</strong>brewer.<br />
http://www.colorbrewer.org.<br />
BREWER, C. 1999. <strong>Color</strong> use guidelines <strong>for</strong> data representation.<br />
In Proceedings of the Section on Statistical Graphics, American<br />
Statistical Association, 55–60.<br />
HEER, J., CARD, K., S., LANDAY, AND A., J. 2005. prefuse:<br />
a toolkit <strong>for</strong> interactive in<strong>for</strong>mation visualization. In Proceedings<br />
of ACM CHI 2005 Conference on Human Factors in Computing<br />
Systems, vol. 1 of Interactive in<strong>for</strong>mation visualization,<br />
421–430.<br />
MICHELSON, A. 1927. Studies in Optics. U. of Chicago Press.<br />
SHARKD, 2008. Comparison of the hsl and hsv color spaces when<br />
mapped to a cylinder, with corner cut-away shown.<br />
STOKES, M., ANDERSON, M., CHANDRASEKA, S., , AND<br />
MOTTA, R., 1996. A standard default color space <strong>for</strong> the internet<br />
- srgb. http://www.w3.org/Graphics/<strong>Color</strong>/sRGB.<br />
TOMINSKI, C., FUCHS, G., AND SCHUMANN, H. 2008. Taskdriven<br />
color coding. In IV, IEEE Computer Society, 373–380.<br />
WEBSITETIPS.COM, 2008. <strong>Color</strong> scheme chooser. http://<br />
websitetips.com/colortools/sitepro.<br />
WRONGDIAGNOSIS.COM, 2008. Prevalence and incidence of<br />
color blindness. http://www.wrongdiganosis.com/<br />
c/color_blindness/prevalence.htm.<br />
YIM, K., 2008. Interactive table of nuclides. http:<br />
//vis.berkeley.edu/courses/cs294-10-fa08/<br />
wiki/index.php/A3-KetrinaYim.
Figure 8: Samples of generated palettes applied to a table of nuclides implemented in Flare.
Figure 9: Additional samples of generated palettes applied to the table of nuclides.