Screenshot from id Software's Quake III: Arena showing ... - CiteSeerX
Screenshot from id Software's Quake III: Arena showing ... - CiteSeerX
Screenshot from id Software's Quake III: Arena showing ... - CiteSeerX

You also want an ePaper? Increase the reach of your titles
YUMPU automatically turns print PDFs into web optimized ePapers that Google loves.
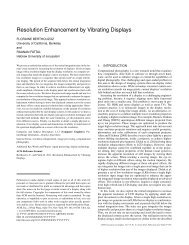
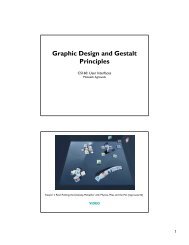
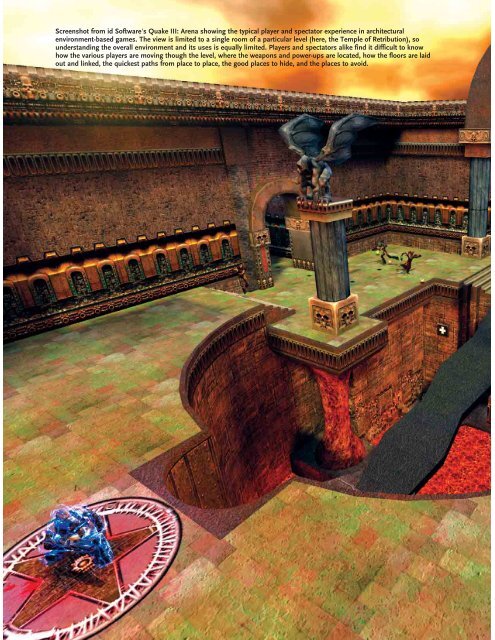
<strong>Screenshot</strong> <strong>from</strong> <strong>id</strong> <strong>Software's</strong> <strong>Quake</strong> <strong>III</strong>: <strong>Arena</strong> <strong>showing</strong> the typical player and spectator experience in architectural<br />
environment-based games. The view is limited to a single room of a particular level (here, the Temple of Retribution), so<br />
understanding the overall environment and its uses is equally limited. Players and spectators alike find it difficult to know<br />
how the various players are moving though the level, where the weapons and power-ups are located, how the floors are la<strong>id</strong><br />
out and linked, the quickest paths <strong>from</strong> place to place, the good places to h<strong>id</strong>e, and the places to avo<strong>id</strong>.
VISUALIZING DYNAMIC<br />
ARCHITECTURAL<br />
ENVIRONMENTS<br />
[<br />
How to expose the internal 3D structures<br />
of multiplayer games and architectural<br />
models by automatically generating<br />
interactive exploded views.<br />
[<br />
Recent advances in consumer graphics technology make it<br />
possible to interactively explore extremely complex 3D<br />
environments. Architects routinely build detailed 3D<br />
computer-a<strong>id</strong>ed design (CAD) models of buildings to visualize<br />
both their internal spaces and their external structures. The trend<br />
toward greater complexity is ev<strong>id</strong>ent in v<strong>id</strong>eo games involving<br />
increasingly detailed interactive 3D worlds. These environments<br />
are comprised of many rooms, passageways, characters, and players,<br />
but also tend to be densely occluded.<br />
Few applications are able to simultaneously display their interior<br />
spaces and the external structures. Two related interfaces are ArcBall<br />
[10], which allows rotation, scaling, and zooming of the environment,<br />
and walkthroughs, which allow viewers to move through<br />
rooms within the environment. ArcBall interfaces are often used in<br />
model-viewing applications and can be useful for understanding an<br />
By Mike Houston, Chris Niederauer,<br />
Maneesh Agrawala, and<br />
Greg Humphreys<br />
COMMUNICATIONS OF THE ACM August 2004/Vol. 47, No. 8 55
environment’s external structure. Walkthrough interfaces,<br />
used in first-person shooter-style games, are useful<br />
for understanding and navigating an<br />
environment’s interior spaces. However, neither of<br />
them allows viewers to understand the environment<br />
as a whole, because the walls and floors h<strong>id</strong>e most of<br />
the structure. In dynamic 3D environments (such as<br />
multiplayer games like <strong>Quake</strong> <strong>III</strong> [4]), the occlusions<br />
make it impossible to see all the action at once.<br />
Architects and technical illustrators often use techniques<br />
like cutaways, transparency, and exploded<br />
views to reduce or eliminate occlusion and expose the<br />
overall structures of architectural environments.<br />
Because exploded views are especially effective for<br />
conveying structure, they are often used in illustrations<br />
of mechanical assemblies [2, 11]. Designers<br />
Stephen Biesty [1] and Edward Tufte [12] are well<br />
known for using exploded views to reveal the structure<br />
of multistory buildings and machines. To form<br />
an exploded view of an architectural model, designers<br />
typically section the building into stories just below<br />
the ceilings, then separate the stories <strong>from</strong> one<br />
another (see Figure 1). These views expose both the<br />
structure of the internal spaces within each story and<br />
the vertical spatial relationships between adjacent stories.<br />
But producing an exploded view <strong>from</strong> a 3D<br />
model of an architectural environment requires the<br />
designer to annotate the location of each story, as well<br />
as a viewing application that generates the appropriate<br />
exploded view <strong>from</strong> the annotated model [5, 6, 9].<br />
We have now developed an interactive system—<br />
called ArchSplit—that prov<strong>id</strong>es automated support<br />
for generating exploded views of any architectural<br />
environment [8]. Requiring little semantic understanding<br />
of the environment, it assumes the environment<br />
is “architectural” and searches for geometric<br />
primitives representing ceilings. Once the system<br />
finds the ceilings, it automatically sections the environment<br />
into stories, rendering each one separately in<br />
exploded form. The system prov<strong>id</strong>es interactive control<br />
over the viewpoint and the separation distance in<br />
terms of height between the stories. This control<br />
makes it easy to understand both the structure of the<br />
environment and the relationships among its<br />
dynamic objects and characters.<br />
We tested this visualization technique on several<br />
OpenGL applications, implementing it noninvasively.<br />
Borrowing the approach proposed in [7], we<br />
used Chromium, a stream-processing framework for<br />
interactive rendering on clusters [3], to intercept and<br />
manipulate sequences of OpenGL commands generated<br />
by the underlying application. Chromium’s<br />
stream-processing units (SPUs) prov<strong>id</strong>e the flexibility<br />
needed to modify, delete, replace, or augment any of<br />
the graphics API calls made by the OpenGL applications<br />
while it is running. The SPUs are easily adapted<br />
to affect semantic transformations on streams of<br />
graphics commands. Thus, our architectural visualization<br />
system can be applied to many OpenGL<br />
applications, including <strong>Quake</strong> <strong>III</strong>, without modification<br />
or recompilation.<br />
Geometric Analysis and Rendering<br />
The system processes the graphics API stream <strong>from</strong><br />
any OpenGL application in two stages. The first—<br />
geometric analysis—determines where to split the<br />
architectural model into its stories by analyzing the<br />
stream of polygons issued by the original application.<br />
The analysis is performed once, whenever a<br />
new architectural model is loaded into the original<br />
application.<br />
The second stage—rendering—draws the<br />
exploded view by modifying the OpenGL graphics<br />
stream of the original application. Based on the geometric<br />
analysis, the system inserts clipping planes<br />
between each story and performs multipass rendering,<br />
one pass per story, to produce the exploded view.<br />
The renderer also replaces the viewpoint—the projection<br />
and modelview matrices—specified by the original<br />
application with a new viewpoint that may be<br />
specified interactively by the user. The rendering stage<br />
modifies every frame of the original application on<br />
the fly.<br />
The most natural segmentation of any architectural<br />
model is into stories. A story is usually defined<br />
by a floor, a ceiling, and all the geometry in between.<br />
For a visualization, the system does not include the<br />
ceiling in each story because it occludes the very<br />
structure we are trying to reveal. Therefore, the best<br />
place to split the model is just below each ceiling. The<br />
goal of the geometric analysis stage is to determine<br />
which of the polygons in the environment represent<br />
ceilings. The rendering stage then inserts a clipping<br />
plane into the environment just below each discovered<br />
ceiling to separate the environment into indiv<strong>id</strong>ual<br />
stories.<br />
To find the ceiling polygons, the user specifies a<br />
vector defining the up direction for the environment.<br />
Ceiling polygons are oriented so their normals point<br />
in the opposite direction of this vector. As the original<br />
application submits geometry to OpenGL for rendering,<br />
Chromium intercepts the vertices of each polygon.<br />
Assuming polygons are specified using<br />
consistent counterclockwise ordering, as in many<br />
OpenGL applications, the system computes the polygon<br />
normal as the cross-product of two edges of the<br />
polygon that share a common vertex. This is generally<br />
a safe assumption, as most applications are careful<br />
56 August 2004/Vol. 47, No. 8 COMMUNICATIONS OF THE ACM
about their geometry’s winding order, which results<br />
<strong>from</strong> OpenGL backface culling semantics.<br />
While this approach finds all downward-facing<br />
polygons, not all such polygons represent ceilings.<br />
Downward-facing polygons may appear in other parts<br />
of the environment (such as in portions of characters<br />
or objects) or in smaller architectural elements (such<br />
as in windowsills, ledges, stairs, and ornamental decorations).<br />
To find the polygons most likely to represent<br />
ceilings, the system computes the height of each<br />
downward-facing polygon, then builds a table mapping<br />
each potential ceiling height to the total surface<br />
area of all downward-facing polygons at that height.<br />
The user interactively specifies NumSplits, or<br />
the number of stories the environment should be split<br />
into. Starting with an unsplit environment, the user<br />
interactively increases or decreases NumSplits. Initially,<br />
the system finds the NumSplits largest surface<br />
areas in the<br />
height-to-surface area table as<br />
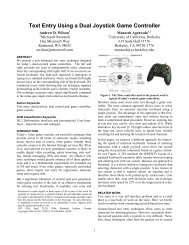
Figure 1. Exploded view<br />
of the Soda Hall model<br />
generated by ArchSplit<br />
<strong>from</strong> a model-viewer<br />
application. Representing<br />
a more traditional<br />
example of how<br />
to present static<br />
architectural models<br />
in exploded form, it is<br />
similar to hand-drawn<br />
techniques.<br />
cand<strong>id</strong>ate heights for splitting<br />
the environment. However,<br />
environments often contain<br />
large ceiling areas that are<br />
slightly offset <strong>from</strong> one another,<br />
and splitting the model at each<br />
of these offset heights would<br />
generate extremely low ceilings<br />
that would not be part of the<br />
desired segmentation. To counteract<br />
this effect, the system<br />
applies an additional heuristic<br />
that maintains a minimum distance, or height,<br />
between neighboring splitting planes. In general, this<br />
distance should be set to the height of a typical character,<br />
as measured with respect to the environment,<br />
since no ceiling can be lower than this minimum<br />
height. The user adjusts the height as necessary for a<br />
particular model. In practice, it’s easy to find the right<br />
minimum height parameter. For multiplayer games,<br />
the minimum ceiling height is specified as the average<br />
height of the player/character’s geometry. For a more<br />
in-depth description of the algorithm, see [8]; a brief<br />
v<strong>id</strong>eo <strong>showing</strong> the system in action with various applications,<br />
including <strong>Quake</strong> <strong>III</strong>, is at graphics.stanford.<br />
edu/papers/archsplit.<br />
Axonometric View<br />
After the system’s geometric analysis stage determines<br />
where to split the environment into stories, its<br />
rendering stage modifies each frame of the original<br />
application to produce an interactive exploded view.<br />
The system uses Chromium to buffer the stream of<br />
OpenGL calls corresponding to a frame, or all of the<br />
COMMUNICATIONS OF THE ACM August 2004/Vol. 47, No. 8 57
functions and their parameters<br />
called between calls to<br />
glSwapBuffers(). The<br />
frame is then replayed, one per<br />
story, with each playback pass<br />
responsible for rendering one of<br />
the stories in the exploded view.<br />
Each playback stream modifies<br />
the original OpenGL stream in<br />
several ways:<br />
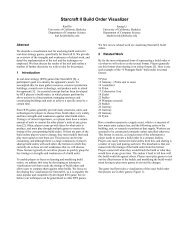
Figure 2. Exploded view<br />
of <strong>Quake</strong> <strong>III</strong> (demo7)<br />
noninvasively generated<br />
by ArchSplit <strong>showing</strong> the<br />
environment <strong>from</strong> an<br />
external axonometric<br />
viewpoint, first<br />
unexploded, then<br />
exploded with a zoom<br />
into one of the floors.<br />
While the unexploded<br />
view shows external<br />
structure, the exploded<br />
view simultaneously<br />
reveals both internal<br />
and external structure.<br />
• The original viewing projection<br />
is replaced by an external<br />
axonometric view, or a projection in which<br />
horizontal and vertical axes are drawn to scale but<br />
in which diagonals and curves are distorted;<br />
• Clipping planes are inserted into the stream to<br />
ensure only a single story is drawn; and<br />
• The geometry is translated along the up vector to<br />
separate the current story <strong>from</strong> the previous story.<br />
Technical illustrators often use an axonometric<br />
projection when producing exploded views of architectural<br />
environments to eliminate perspective distortions.<br />
Our system generates an axonometric view by<br />
replacing the original application’s projection matrix<br />
with its own axonometric projection. The system<br />
allows users to interactively adjust the viewpoint<br />
using an ArcBall interface [10]. To allow such control,<br />
the system locates the viewing transformations in the<br />
transformation matrix stack of the original application<br />
and replaces them with its own collection of<br />
transformations. The system assumes the application<br />
first sets up the viewing transformation for the environment;<br />
subsequent changes to the modelview stack<br />
represent relative motions of other graphical elements<br />
(such as players, objects, and overlays). Thus, the system<br />
can change the viewpoint by replacing the very<br />
first matrix placed on the OpenGL modelview stack.<br />
When nonenvironmental graphical elements (such as<br />
players and objects) are drawn, it uses the inverse of<br />
the environment’s original projection matrix to place<br />
them correctly relative to the new axonometric view.<br />
To ensure each playback stream draws only the<br />
geometry associated with a single story, the system<br />
inserts two OpenGL clipping planes into the graphics<br />
stream just before the environment geometry. One is<br />
placed immediately below the ceiling of the current<br />
story so it clips all geometry above it. Similarly, the<br />
other one is placed right below the previous ceiling so<br />
it clips all geometry below it. The results of these<br />
transformations are shown in Figure 2.<br />
By interactively adjusting separation distance, users<br />
quickly see how the stories fit together and connect<br />
with one another in another form of interaction that<br />
helps reveal the 3D structure of the architectural environment.<br />
Assumptions<br />
Although retrofitting existing applications noninvasively<br />
is a strength of this approach, it is also a limitation.<br />
In particular, it requires that the system<br />
analyze the environment at a very low level while<br />
making several assumptions about the semantics of<br />
the OpenGL stream issued by the original application.<br />
It also affects the performance of the application.<br />
For example, for each story at which the system<br />
splits, the system must resend all of the graphics primitives<br />
to the graphics card. Also, as noted in [8], for<br />
many applications, like <strong>Quake</strong> <strong>III</strong>, some of the rendering<br />
optimizations traditionally used must first be<br />
disabled. To maintain interactivity, the system makes<br />
use of a cluster of machines with graphics boards,<br />
with each machine rendering a single story. This<br />
approach mitigates the performance decrease caused<br />
by the extra rendering load.<br />
When many players interact simultaneously in,<br />
say, a large gaming environment, the action can be<br />
58 August 2004/Vol. 47, No. 8 COMMUNICATIONS OF THE ACM
perspective is far more satisfying than<br />
observing them through the eyes of indiv<strong>id</strong>ual<br />
players, as it prov<strong>id</strong>es a more complete<br />
understanding of the environment and the<br />
dynamic character interactions taking place<br />
within it. c<br />
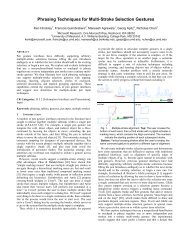
Figure 3. Mock-up of zoomed-in view of a single floor <strong>from</strong> <strong>Quake</strong><br />
<strong>III</strong> (demo7) <strong>showing</strong> a game in progress. Using Photoshop, we<br />
added semantic information to the center split image generated by<br />
ArchSplit in Figure 2 to show the name and location of each<br />
player, number of kills (frags) for each team, and the paths each<br />
player has taken through the environment.<br />
difficult for them, as well as for any spectators, to follow,<br />
even though everything is visible in the exploded<br />
view. A combination of geometric and semantic simplification<br />
would greatly increase the ability of players<br />
and spectators alike to understand the environment.<br />
For example, players appear quite small when the<br />
entire map is shown; they could be simplified or even<br />
“iconified” without sacrificing much semantic content.<br />
The movement of players could also be displayed<br />
in the exploded view to give all viewers a sense of how<br />
they are moving through and using different aspects<br />
of the environment (such as power-ups and weapons<br />
in games like <strong>Quake</strong> <strong>III</strong>), as shown in Figure 3.<br />
Conclusion<br />
Our aim is not simply to argue that noninvasive techniques<br />
should be used when exploded views might be<br />
useful, but to demonstrate a compelling new visualization<br />
technique for architectural environments.<br />
Application writers have access to higher-level semantic<br />
knowledge about these environments, including<br />
the locations of the ceilings and the viewing parameters.<br />
Access to such information would make it much<br />
easier to build our exploded-view visualization technique<br />
into the original application, as well as to use<br />
level of detail, or geometric and texture simplification,<br />
and prov<strong>id</strong>e semantic information to help users<br />
understand the environment. We thus hope to<br />
encourage designers of future systems to incorporate<br />
such visualizations directly into their applications.<br />
Observing multiplayer games <strong>from</strong> a third-person<br />
References<br />
1. Biesty, S. and Platt, R. Stephen Biesty’s Incredible Explosions:<br />
Exploded Views of Astonishing Things. Scholastic,<br />
Inc., New York, 1996.<br />
2. Giesecke, F., Mitchell, A., and Spencer, H. Technical<br />
Drawing, 3rd Ed. Macmillan, New York, 1949.<br />
3. Humphreys, G., Houston, M., Ng, R., Ahern, S., Frank,<br />
R., Kirchner, P., and Klosowski, J. Chromium: A stream<br />
processing framework for interactive graphics on clusters<br />
of workstations. ACM Transact. Graph. 21, 3 (July<br />
2002), 693–702.<br />
4. <strong>id</strong> Software. <strong>Quake</strong> <strong>III</strong>: <strong>Arena</strong>. Tech. Rep. <strong>id</strong> Software,<br />
Inc., Mesquite, TX, 2002; www.<strong>id</strong>software.<br />
com/games/quake/quake3-arena/.<br />
5. Kroll, E., Lenz, E., and Wolberg, J. Rule-based generation<br />
of exploded views and assembly sequences. Artificial<br />
Intelligence for Engineering Design, Analysis, and Manufacturing<br />
3, 3 (1989), 143–155.<br />
6. Mohammad, R. and Kroll, E. Automatic generation of<br />
exploded views by graph transformation. In Proceedings<br />
of IEEE AI for Applications (1993), 368–374.<br />
7. Mohr, A. and Gleicher, M. Noninvasive, interactive, stylized rendering.<br />
In Proceedings of the ACM Symposium on Interactive 3D Graphics<br />
(Chapel Hill, NC, Mar. 19–21). ACM Press, New York 2001,<br />
175–178.<br />
8. Niederauer, C., Houston, M., Agrawala, M., and Humphreys, G. Noninvasive<br />
interactive visualization of dynamic architectural environments.<br />
In Proceedings of the 2003 Symposium on Interactive 3D Graphics<br />
(Monterey, CA, Apr. 28–30). ACM Press, New York, 2003, 55–58.<br />
9. Raab, A. and Rüger, M. 3D-ZOOM interactive visualization of structures<br />
and relations in complex graphics. In 3D Image Analysis and Synthesis,<br />
G. Girod, H. Niemann, and H. Se<strong>id</strong>el, Eds. Verlag, Sankt<br />
Augustin, Germany, 1996, 87–93.<br />
10. Shoemake, K. ArcBall: A user interface for specifying three-dimensional<br />
orientation using a mouse. In Proceedings of Graphics Interface ‘92 (Vancouver,<br />
Canada). Morgan Kaufmann Publishers, Inc., 1992, 151–156.<br />
11. Thomas, T. Technical Illustration, 3rd Ed. McGraw Hill, New York,<br />
1978.<br />
12. Tufte, E. Visual Explanations. Graphics Press, Cheshire, CT, 1997.<br />
Mike Houston (mhouston@graphics.stanford.edu) is a Ph.D.<br />
cand<strong>id</strong>ate in the Stanford University Computer Graphics Laboratory in<br />
the Department of Computer Science at Stanford University in<br />
Stanford, CA.<br />
Christopher Niederauer (ccn@ccntech.com) is an OpenGL<br />
software engineer in the Graphics and Imaging Group at Apple<br />
Computer, Inc., in Cupertino, CA.<br />
Maneesh Agrawala (maneesh@graphics.stanford.edu) is a<br />
researcher in the Microsoft Research Document Processing and<br />
Understanding Group in Redmond, WA.<br />
Greg Humphreys (humper@cs.virginia.edu) is an assistant<br />
professor in the Department of Computer Science at the University of<br />
Virginia in Charlottesville.<br />
Permission to make digital or hard copies of all or part of this work for personal or<br />
classroom use is granted without fee prov<strong>id</strong>ed that copies are not made or distributed<br />
for profit or commercial advantage and that copies bear this notice and the full citation<br />
on the first page. To copy otherwise, to republish, to post on servers or to redistribute<br />
to lists, requires prior specific permission and/or a fee.<br />
© 2004 ACM 0001-0782/04/0800 $5.00<br />
COMMUNICATIONS OF THE ACM August 2004/Vol. 47, No. 8 59