Graph Compare - Visualization
Graph Compare - Visualization
Graph Compare - Visualization

Create successful ePaper yourself
Turn your PDF publications into a flip-book with our unique Google optimized e-Paper software.
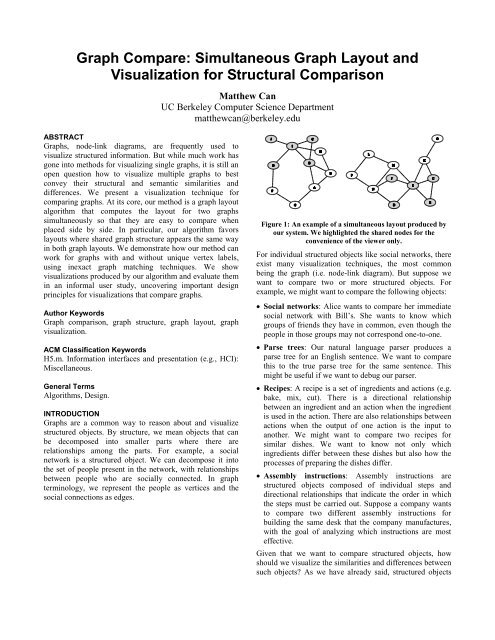
<strong>Graph</strong> <strong>Compare</strong>: Simultaneous <strong>Graph</strong> Layout and<br />
<strong>Visualization</strong> for Structural Comparison<br />
Matthew Can<br />
UC Berkeley Computer Science Department<br />
matthewcan@berkeley.edu<br />
ABSTRACT<br />
<strong>Graph</strong>s, node-link diagrams, are frequently used to<br />
visualize structured information. But while much work has<br />
gone into methods for visualizing single graphs, it is still an<br />
open question how to visualize multiple graphs to best<br />
convey their structural and semantic similarities and<br />
differences. We present a visualization technique for<br />
comparing graphs. At its core, our method is a graph layout<br />
algorithm that computes the layout for two graphs<br />
simultaneously so that they are easy to compare when<br />
placed side by side. In particular, our algorithm favors<br />
layouts where shared graph structure appears the same way<br />
in both graph layouts. We demonstrate how our method can<br />
work for graphs with and without unique vertex labels,<br />
using inexact graph matching techniques. We show<br />
visualizations produced by our algorithm and evaluate them<br />
in an informal user study, uncovering important design<br />
principles for visualizations that compare graphs.<br />
Author Keywords<br />
<strong>Graph</strong> comparison, graph structure, graph layout, graph<br />
visualization.<br />
ACM Classification Keywords<br />
H5.m. Information interfaces and presentation (e.g., HCI):<br />
Miscellaneous.<br />
General Terms<br />
Algorithms, Design.<br />
INTRODUCTION<br />
<strong>Graph</strong>s are a common way to reason about and visualize<br />
structured objects. By structure, we mean objects that can<br />
be decomposed into smaller parts where there are<br />
relationships among the parts. For example, a social<br />
network is a structured object. We can decompose it into<br />
the set of people present in the network, with relationships<br />
between people who are socially connected. In graph<br />
terminology, we represent the people as vertices and the<br />
social connections as edges.<br />
Figure 1: An example of a simultaneous layout produced by<br />
our system. We highlighted the shared nodes for the<br />
convenience of the viewer only.<br />
For individual structured objects like social networks, there<br />
exist many visualization techniques, the most common<br />
being the graph (i.e. node-link diagram). But suppose we<br />
want to compare two or more structured objects. For<br />
example, we might want to compare the following objects:<br />
Social networks: Alice wants to compare her immediate<br />
social network with Bill’s. She wants to know which<br />
groups of friends they have in common, even though the<br />
people in those groups may not correspond one-to-one.<br />
Parse trees: Our natural language parser produces a<br />
parse tree for an English sentence. We want to compare<br />
this to the true parse tree for the same sentence. This<br />
might be useful if we want to debug our parser.<br />
Recipes: A recipe is a set of ingredients and actions (e.g.<br />
bake, mix, cut). There is a directional relationship<br />
between an ingredient and an action when the ingredient<br />
is used in the action. There are also relationships between<br />
actions when the output of one action is the input to<br />
another. We might want to compare two recipes for<br />
similar dishes. We want to know not only which<br />
ingredients differ between these dishes but also how the<br />
processes of preparing the dishes differ.<br />
Assembly instructions: Assembly instructions are<br />
structured objects composed of individual steps and<br />
directional relationships that indicate the order in which<br />
the steps must be carried out. Suppose a company wants<br />
to compare two different assembly instructions for<br />
building the same desk that the company manufactures,<br />
with the goal of analyzing which instructions are most<br />
effective.<br />
Given that we want to compare structured objects, how<br />
should we visualize the similarities and differences between<br />
such objects? As we have already said, structured objects
are commonly expressed as graphs, and in this paper, that is<br />
the approach we take. Thus, the problem we face is how to<br />
visually display graphs so that they can easily be compared.<br />
We would like our visualization to facilitate comparison<br />
between individual nodes and between larger structures<br />
such as subgraphs. An ideal visualization would help the<br />
user create a mental mapping from one graph to the other.<br />
For simplicity, in this paper we limit ourselves to the case<br />
where we want to compare only two graphs. Our approach<br />
is to display the graphs side by side so that common graph<br />
structure has the same appearance in both graphs. Suppose<br />
we were to use a standard graph layout algorithm to lay out<br />
each graph separately and then place them next to each<br />
other. This display would have none of the properties that<br />
we desire. Instead, we design a layout algorithm that<br />
simultaneously calculates the layout for two graphs. Our<br />
algorithm attempts to maintain the same distances between<br />
corresponding nodes in the graphs. In other words, if a pair<br />
of nodes appears in both graphs, the algorithm attempts to<br />
keep the distance between the nodes the same in both<br />
graphs. This results in corresponding nodes having the<br />
same relative position to each other in both graphs, such<br />
that the shared structure between the graphs appears the<br />
same way in both.<br />
RELATED WORK<br />
There are two primary areas of work related to visualization<br />
for graph comparison: graph layout and dynamic graph<br />
drawing. We discuss each of these in turn.<br />
<strong>Graph</strong> Layout<br />
The work on graph layout examines ways to draw graphs<br />
with certain desirable properties. These properties can vary<br />
from one application to another, but a few are common. In<br />
general, a good layout will minimize the amount of physical<br />
space taken up by the graph. A good layout will eliminate<br />
node overlaps and minimize the number of edge crossings.<br />
For directed graphs, a good layout will maximize the<br />
number of directed edges that point downward. The goal of<br />
these heuristics is to make the graph visualization easier to<br />
comprehend.<br />
A comprehensive review of the literature on graph layout<br />
algorithms that attempt to address these properties is<br />
beyond the scope of this paper. Instead, we describe some<br />
of the common classes of graph layout algorithms.<br />
Undirected graph layout is typically done using forcedirected<br />
placement (FDP) algorithms. In practice, these<br />
algorithms produce aesthetically pleasing layouts with nice<br />
symmetries. Their layouts generally also minimize edge<br />
crossings and keep all edge lengths the same. A well known<br />
FDP algorithm is that of Fruchterman and Reingold [5]. It<br />
treats the graph as a physical system, where the edges are<br />
springs and the vertices are charged particles. To compute<br />
the layout, their algorithm solves for the steady state of this<br />
system. Another flavor of FDP is based on the stress<br />
function, introduced by Kamada and Kawai [9]. These<br />
layouts minimize a stress function defined on the edges of<br />
the graph. Our algorithm for simultaneous graph layout is<br />
based on this approach. The most common methods for<br />
directed graph layout are based on the algorithm of<br />
Sugiyama et al. [13]. These algorithms use the y-axis to<br />
convey hierarchy. They divide the y-axis into layers and<br />
place nodes into layers so as to minimize edge length.<br />
Preprocessing is required to handle graphs with cycles.<br />
Dwyer and Koren introduced the DIG-COLA layout<br />
algorithm [3], which uses FDP to perform directed graph<br />
layout. Specifically, they minimize the stress function using<br />
majorization, a technique borrowed from multidimensional<br />
scaling. This technique iteratively bounds the stress<br />
function with a quadratic. To produce a nice directed<br />
layout, they add hierarchical constraints to the objective<br />
function and solve the resulting convex optimization<br />
problem, a quadratic program. DIG-COLA produces<br />
layouts that convey hierarchy and contain some of the nice<br />
qualities of FDP-based layouts.<br />
Dynamic <strong>Graph</strong> Drawing<br />
Dynamic graph drawing is the problem of drawing a graph<br />
that changes over time. The changes are visualized as a<br />
sequence of graphs, one for each time step that is depicted.<br />
The challenge is how to lay out the sequence of graphs so<br />
that the viewer can make the most sense of what nodes and<br />
edges were inserted and removed across time steps. In the<br />
literature, this is known as “preserving the mental map.”<br />
North’s DynaDAG is a system for drawing dynamic<br />
directed acyclic graphs [12]. It uses a heuristic to perform<br />
incremental layout, whereas our algorithm minimizes the<br />
stress function. Diehl and Görg introduced a generic<br />
algorithm for dynamic graph drawing that can utilize<br />
different layout algorithms [2]. Their approach considers all<br />
graphs in the sequence, so it is an offline method rather than<br />
an online one. Similarly, we compute the layouts of two<br />
graphs simultaneously. In follow up work, Görg et al.<br />
explore the use of their generic algorithm in the context of<br />
orthogonal and hierarchical layouts [6]. Frishman and Tal<br />
present an algorithm for the dynamic drawing of clustered<br />
graphs [4]. It attempts to maintain the clustered structure of<br />
the graphs during incremental layout. In some sense, our<br />
algorithm also attempts to highlight clusters that are<br />
common between two graphs, but without knowing the<br />
clusters a priori. Archambault introduces the difference<br />
map, a technique for comparing the structure of two graphs<br />
in the context of dynamic graph drawing [1]. The difference<br />
map displays the union of two graphs using three colors:<br />
nodes only in the first graph are shown in one color, nodes<br />
only in the second graph are shown in a second color, and<br />
nodes common to both graphs are shown in the third color.<br />
We are also interested in visualizing structural similarities<br />
between two graphs, but our approach is to jointly compute<br />
a side-by-side graph layout.
initialize X;<br />
for n from 0 to num_iter:<br />
initialize dX;<br />
for i from 0 to num_vertices:<br />
dX[i] = deriv(X, i);<br />
X = X – dX * eps;<br />
Figure 2: The algorithm for stress-based layout minimizes the<br />
stress function by performing gradient descent.<br />
In dynamic graph drawing, the assumption is that a node in<br />
one time step corresponds to a node in another if they have<br />
the same identity. That is, dynamic graph drawing operates<br />
on graphs where the nodes can be uniquely identified. But,<br />
we would like to compare graphs where the nodes do not<br />
have unique identifiers. For example, if we encode a recipe<br />
as a graph, the same ingredient or action may appear in the<br />
graph multiple times as different nodes. Our method<br />
addresses this situation.<br />
METHOD<br />
We now describe our algorithm for simultaneous graph<br />
layout and visualization. Since our layout algorithm is<br />
based on minimizing the stress function in [9], we begin by<br />
introducing stress-based layout for a single graph. Then we<br />
explain how we use this to lay out two graphs<br />
simultaneously. Furthermore, we describe how we extend<br />
our method to graphs with non-unique node labels by<br />
computing an inexact graph matching.<br />
Stress-based <strong>Graph</strong> Layout<br />
Formally speaking, we are given a graph G = (V,E) of<br />
vertices and edges. Computing a layout for G means<br />
computing x,y positions for each vertex in G. We assume<br />
the vertices have unique labels from a finite label set L. Let<br />
X i be the coordinates of vertex i and X be the coordinates of<br />
all vertices. The stress function is defined as follows:<br />
stress (X) = ∑ i
Figure 4: A side-by-side graph layout produced by our system. Note that the common structure, J-I-C-D-E, has the same<br />
appearance in both graphs because distances and relative positions between common nodes are the same.<br />
Figure 5: These are the same graphs as above, with the layouts computed by <strong>Graph</strong>viz’s neato algorithm. The common<br />
structure does not have the same appearance in both graphs.<br />
Inexact graph matching is related to the concept of graph<br />
edit distance. Let us assume the following edit operations<br />
on a graph: vertex insertion and removal, edge insertion and<br />
removal, and vertex relabeling. Each of these operations has<br />
an associated cost. The graph edit distance between two<br />
graphs is the least cost sequence of edit operations that<br />
transforms one graph into the other. By computing the<br />
graph edit distance, we also compute an inexact matching<br />
between the graphs. A vertex in the first graph matches a<br />
vertex in the second if its label is changed to match it.<br />
The problem of computing graph edit distance is NPcomplete.<br />
We frame it as a search problem and use<br />
uniform-cost search to search through the space of edit<br />
sequences for the least-cost sequence. Our method is based<br />
on the A* search algorithm presented by Neuhaus et al.<br />
[11], except that we do not use a heuristic.<br />
IMPLEMENTATION<br />
We implemented our algorithm in the Java programming<br />
language. This includes the stress-based layout and the<br />
graph edit distance computation. Both were our own<br />
implementation. While our algorithm computes the node<br />
positions in the graph layout, it does not render the visual<br />
display. Instead, we output the layout to the DOT language<br />
and use <strong>Graph</strong>viz [7] to render the graph. <strong>Graph</strong>viz uses our<br />
calculated positions as the final node positions.<br />
RESULTS<br />
We now provide the results of our simultaneous graph<br />
layout algorithm for graph comparison. First, we show<br />
example layouts produced by our system and discuss their<br />
strengths and weaknesses. We then evaluate our<br />
visualizations in an informal user study.
Figure 6: Comparison of two chocolate chip cookie recipes, represented as directed graphs, using our algorithm. Our layout<br />
makes it easy to notice the common, general structure of mixing wet and dry ingredients, followed by baking.<br />
Figure 7: The same graphs as above, with the layouts computed by <strong>Graph</strong>viz’s dot algorithm. This Sugiyama-style layout does<br />
a better job than our algorithm at conveying the process flow of baking chocolate chip cookies.<br />
Examples<br />
Undirected <strong>Graph</strong><br />
Figure 4 shows the output of our system for a pair of<br />
undirected graphs that share a 5-node subgraph. In our<br />
simultaneous layout, the shared subgraph has the same<br />
appearance in both graphs. That is, if you look only at the<br />
layout of that subgraph in both graphs, it is nearly identical.<br />
In this case, our algorithm works as we had hoped it would.<br />
But, what is not yet clear is whether this helps convey the<br />
shared structure to the viewer. We come back to this point<br />
in our evaluation.<br />
We also lay out the same pair of graphs in Figure 5 using a<br />
standard undirected layout procedure in the <strong>Graph</strong>viz graph<br />
drawing tool. Unlike our output, the shared graph structure<br />
does not have the same appearance in both graphs. Nodes<br />
common to both graphs are not in the same relative<br />
positions to each other.<br />
Directed <strong>Graph</strong><br />
So far in our system description, we have not made any<br />
distinction between directed and undirected graphs. Since<br />
our simultaneous layout algorithm is based on stress<br />
minimization, we designed it with undirected graphs in<br />
mind. However, nothing prevents us from using it to lay out<br />
graphs with directed edges. Aside from rendering directed<br />
edges in the display, the only change we make to the<br />
algorithm is to compute the graph theoretic distances on an<br />
undirected copy of the graph. But because our algorithm<br />
does nothing to visualize hierarchy in graphs, it is likely to<br />
yield poor layouts for directed graphs. In any case, we show<br />
the results.<br />
The visualization in Figure 6 is a comparison of two<br />
chocolate chip cookie recipes. The recipes are encoded as<br />
directed graphs. Ingredients are pink nodes and cooking<br />
actions are blue nodes. A directed edge from an ingredient<br />
to an action indicates that the ingredient was an input to that<br />
action. A directed edge from one action to another indicates<br />
that the output of the first action was an input to the second.<br />
One good property of our simultaneous layout is that it<br />
highlights the general structure shared by both cookie<br />
recipes; wet ingredients are combined with dry ingredients,<br />
and the result goes through a baking process. Even without
eading the labels on the nodes, a viewer can glean that this<br />
general structure exists and is common to both graphs. This<br />
is less salient in the layouts produced by <strong>Graph</strong>viz’s<br />
standard layout for directed graphs. However, <strong>Graph</strong>viz’s<br />
Sugiyama-style layout does a better job than ours at<br />
showing the hierarchical information in the graphs. That is,<br />
it is easier to follow the flow of ingredients and<br />
intermediate outputs through the actions. Note that in our<br />
layouts, many directed edges point upwards, making this<br />
harder.<br />
Evaluation<br />
To get some understanding of the efficacy of our side-byside<br />
layout for graph comparison, we conducted an<br />
informal user study. Our goal was not only to judge how<br />
well our visualization technique performs, but also to learn<br />
some general principles for creating visualizations that<br />
make it easy for people to compare graphs.<br />
We conducted our study with six participants, all<br />
undergraduates at UC Berkeley. Each participant was<br />
presented with the visualizations in Figure 4 and Figure 6.<br />
For Figure 4, we told them that the graphs were social<br />
networks where edges indicated friendship. For Figure 6,<br />
we explained to them how we encoded the recipes as<br />
graphs.<br />
We asked participants to look at the side-by-side graphs and<br />
tell us what similarities and differences they noticed<br />
between the graphs. They were instructed to compare<br />
specific graph elements such as nodes and more general<br />
graph elements like subgraphs. We asked participants to<br />
talk aloud as they did this, and in particular, we asked that<br />
they attempt to describe what helps them locate and<br />
visualize the structure that they compare.<br />
For the undirected graphs in Figure 4, participants had a<br />
difficult time making a comparison. Only a couple<br />
participants noticed the entirety of the shared structure.<br />
Others noticed that the I-C-E “triangle” was common to<br />
both graphs. One participant did not notice any shared<br />
components at all. When explaining how they made<br />
comparisons, participants described that they began by<br />
scanning the nodes in the graphs to find a single one that<br />
the two had in common. Often, node I was the first<br />
comparison made. From that first node, they branched out<br />
and looked for other neighbors that were shared. One<br />
participant described that this comparison was difficult<br />
because the shape of the two graphs did not give off any<br />
patterns, so he had to start scanning the nodes. In general,<br />
participants noticed “lonely” nodes like O and J, which<br />
extended from the graphs and stood out alone.<br />
Participants had a much easier time comparing the cookie<br />
recipes in Figure 6. All participants noticed that the two<br />
graphs shared the same macro structure made of three<br />
clusters: dry ingredients, wet ingredients, and the baking<br />
process. They noticed this structure before reading the<br />
labels on the nodes, and read the labels afterward to verify<br />
the similarity. One person said that while the clusters were<br />
not exactly the same, the two graphs appeared to have the<br />
same pattern. Participants described that they made the<br />
mapping between clusters of nodes based on the fact that<br />
clusters looked the same way in both graphs. We probed<br />
further, asking participants to be as explicit as possible<br />
about how they made a mapping between the graphs. The<br />
general process is that participants first noticed a structure<br />
in one graph, and then checked to see if it was present in the<br />
other. The first place they checked was the same relative<br />
location on the other graph. Three participants also<br />
described that they started looking at the graphs at the top<br />
left. They also mentioned that the color coding helped them<br />
make comparisons.<br />
DISCUSSION<br />
Based on our informal evaluation of our simultaneous graph<br />
layout algorithm, we have come up with a few design<br />
implications for visualizations that compare graphs.<br />
Use color to improve comparison<br />
In the chocolate chip cookie comparison, one of the things<br />
that helped our participants make comparisons was the<br />
color coding on the nodes. There are two ways that color<br />
can facilitate comparison. In the case of the recipes, color<br />
adds structure. For example, consider the dry ingredients in<br />
the bottom left of the graphs in Figure 6. Without the color,<br />
all the viewer knows is that the commonality is three nodes<br />
pointing to another node. With the color, she knows that it<br />
is three ingredients being used in an action. In the latter<br />
case, she has a stronger basis for the similarity. The second<br />
way in which color can help is if it explicitly highlights<br />
common structure. In Figure 1, the nodes common to both<br />
graphs are colored gray. This makes it immediately<br />
apparent to the viewer which nodes the graphs have in<br />
common.<br />
Same structure looks the same<br />
As we had hypothesized, our evaluation revealed that<br />
making shared graph structure appear visually similar in<br />
both graphs improves the viewer’s ability to see it. For our<br />
cookie recipe graphs, participants made mappings between<br />
the graphs based on visually similar groups of nodes<br />
(comparison based on appearance of graph structure), and<br />
then checked the labels on the nodes to further verify<br />
similarity.<br />
Same structure in same relative location<br />
We also learned from our evaluation that it is not enough<br />
for common structure to look the same in both graphs.<br />
What we also need for ease of comparison is that the<br />
common structure appear in the same relative location in<br />
both graphs. Consider Figure 4 as an example. Although the<br />
common subgraph looks the same in both graphs, it is in a<br />
different location. In the graph on the left, it is in the upper<br />
left. In the graph on the right, it is in the lower right. This is<br />
what made it difficult for participants of our study to locate
the common structure. In contrast, in the cookie recipe<br />
graphs, most of the common structures were in the same<br />
relative location in both graphs. And when they were not,<br />
participants took notice and commented that while the<br />
structures were the same, they were not placed in the same<br />
location. They remarked upon this as something that was<br />
“wrong” with the layout.<br />
Convey hierarchical information<br />
One of the complaints with our recipe graph visualization is<br />
that participants had a preference for reading it from top to<br />
bottom, but our directed edges had a general flow from left<br />
to right. In fact, when commenting on hierarchical<br />
relationships, participants saw the top-to-bottom<br />
relationships better. For directed graphs, it is important to<br />
have as many directed edges point downwards as possible.<br />
When edges must point in another direction, we<br />
recommend that corresponding edges between the two<br />
graphs point in the same direction.<br />
FUTURE WORK<br />
Our algorithm for simultaneous graph layout is just a first<br />
step toward creating visualizations that facilitate graph<br />
comparison. There is much yet to be done in this area and<br />
there are many possible extensions to our current method.<br />
Directed graphs<br />
Our existing algorithm does not faithfully support directed<br />
graphs in the sense that it does not compute layouts that<br />
convey the hierarchical information in directed graphs. We<br />
plan to extend our algorithm to directed graphs by<br />
modifying the stress-based objective function that our<br />
algorithm minimizes. We will incorporate the hierarchy<br />
constraints used by the DIG-COLA algorithm [3].<br />
Evaluation<br />
Our evaluation merely evaluated our visualizations in<br />
isolation. In the future, we would like to compare our<br />
simultaneous side-by-side layout to other visualizations for<br />
graph comparison, such as the difference map [1].<br />
In addition, we would like to have a better understanding of<br />
what mappings people make when they compare graphs.<br />
And perhaps a way to evaluate visualizations for graph<br />
comparison is to examine how the visualizations differ<br />
based on what mappings they elicit from users.<br />
We plan to use Mechanical Turk to gather mappings for<br />
pairs of graphs by asking workers to draw marks around<br />
what they perceive to be common structure. Kittur et al.<br />
have shown that with careful experimental design,<br />
Mechanical Turk can be viable way to perform user studies<br />
quickly and cheaply [10]. In the field of visualization, Heer<br />
and Bostock replicated known results in graphical<br />
perception with workers on Mechanical Turk, providing a<br />
basis for conducting graphical perception experiments on<br />
the system [8].<br />
Better use of inexact graph matching<br />
Our method used inexact graph matching to create a<br />
mapping between the nodes of two graphs when the nodes<br />
did not have unique labels. However, we might want to<br />
create such a mapping even when the nodes do have unique<br />
labels. Here is the justification:<br />
Remember that our algorithm favors layouts where<br />
corresponding nodes in the two graphs are the same<br />
distances from other corresponding nodes. This tends to<br />
result in layouts where shared structure looks the same in<br />
both graphs. But, as there are more correspondences<br />
between nodes (i.e. as the matching becomes more inexact),<br />
we have more soft constraints on the layout our algorithm<br />
can produce. This will tend to give us layouts where the<br />
common structure not only has the same appearance, but<br />
also appears in the same relative location. We believe the<br />
use of inexact graph matching is the reason why the graphs<br />
in Figure 6 preserved relative location in many cases.<br />
Furthermore, we would like to experiment with different<br />
cost functions in the graph edit distance computation to see<br />
how they affect the simultaneous layout. In particular, we<br />
would like to know how robust the layout is with respect to<br />
the cost function. Our function gave a cost of 1 to all<br />
insertion and deletion operations, a cost of 0 to relabeling<br />
operations where the labels were identical, and infinity to<br />
relabeling operations where the labels were different. We<br />
anticipate that different applications will require different<br />
cost functions.<br />
We have also thought of using the results of the graph edit<br />
distance to modulate the stress function of the combined<br />
graph that we actually lay out. Currently, we place an edge<br />
of zero weight between corresponding nodes of the two<br />
input graphs. Instead, we might let that weight vary based<br />
on the strength of the correspondence, as computed by the<br />
graph edit distance.<br />
Finally, we plan to implement some form of approximate<br />
graph edit distance rather than our exact algorithm because<br />
the computational complexity of graph edit distance<br />
prevents us from using it on large graphs.<br />
Miscellaneous<br />
We used gradient descent to minimize the stress function.<br />
In the future, we plan to use the majorization technique<br />
used by DIG-COLA [3]. It is a global optimization with the<br />
nice property that it guarantees a monotonic decrease of the<br />
stress function.<br />
Currently, our method only supports comparing two graphs.<br />
We would like to explore ways of comparing several<br />
graphs, perhaps in a small multiples type of visualization. A<br />
naïve way to do this is by using our method on pairs of<br />
adjacent graphs, fixing the layout of the first graph. But,<br />
there might be a more sophisticated method that considers<br />
all of the graphs simultaneously.
Lastly, we would like to explore the use of other visual<br />
variables like color and node size in our visualizations. We<br />
have already discussed the potential for color to improve<br />
the viewer’s ability to make mappings between the graphs.<br />
CONCLUSION<br />
We have presented a visualization technique for comparing<br />
two graphs. Our method is to place the graphs side-by-side<br />
with a layout that maintains the same visual appearance of<br />
structure that is common between the two graphs. We have<br />
described an algorithm based on stress minimization that<br />
produces layouts with this property. Examples show that<br />
our algorithm produces the kinds of layouts we desire. An<br />
informal evaluation of our visualizations reveals several<br />
design principles for graph comparison visualizations.<br />
While it is the case that common structure should have the<br />
same visual appearance, that alone is not enough. It is also<br />
important that common structure appear in the same relative<br />
location in both graphs. Most importantly, we have outlined<br />
the work yet to be done in this area of research.<br />
ACKNOWLEDGMENTS<br />
We thank Maneesh Agrawala and Björn Hartmann for the<br />
discussions that have led to this work and their invaluable<br />
suggestions that have helped guide it.<br />
REFERENCES<br />
1. Archambault, D. Structural differences between two<br />
graphs through hierarchies. In Proc. of <strong>Graph</strong>ics<br />
Interface, 2009.<br />
2. Diehl, S. and Görg, C. <strong>Graph</strong>s, they are changing –<br />
dynamic graph drawing for a sequence of graphs. In<br />
Proc. of <strong>Graph</strong> Drawing, 2002.<br />
3. Dwyer, T. and Koren, T. DIG-COLA: Directed <strong>Graph</strong><br />
Layout through Constrained Energy Minimization. In<br />
Proc. of IEEE Symposium on Information <strong>Visualization</strong>,<br />
2005.<br />
4. Frishman, Y. and Tal, A. Dynamic drawing of clustered<br />
graphs. In Proc. of IEEE Symposium on Information<br />
<strong>Visualization</strong>, 2004.<br />
5. Fruchterman, T. and Reingold, E. <strong>Graph</strong> Drawing by<br />
Force-directed Placement. In Software – Practice &<br />
Experience, 1991.<br />
6. Görg, C., Birke, P., Pohl, M., and Diehl, S. Dynamic<br />
graph drawing of sequences of orthogonal and<br />
hierarchical graphs. In Proc. of <strong>Graph</strong> Drawing, 2004.<br />
7. <strong>Graph</strong>viz. http://www.graphviz.org/.<br />
8. Heer, J. and Bostock, M. Crowdsourcing <strong>Graph</strong>ical<br />
Perception: Using Mechanical Turk to Assess<br />
<strong>Visualization</strong> Design. In Proc. CHI ’10, 2010.<br />
9. Kamada, T. and Kawai, S. An Algorithm for Drawing<br />
General Undirected <strong>Graph</strong>s. Information Processing<br />
Letters, 1989.<br />
10. Kittur, A., Chi, E., and Suh, B. Crowdsourcing User<br />
Studies With Mechanical Turk. In Proc. CHI ’08, 2008.<br />
11. Neuhaus, M., Riesen, K., and Bunke, H. Fast<br />
Suboptimal Algorithms for the Computation of <strong>Graph</strong><br />
Edit Distance. In Structural, Syntactic, and Statistical<br />
Pattern Recognition, Springer 2006.<br />
12. North, S. Incremental layout in dynaDAG. In Proc. of<br />
<strong>Graph</strong> Drawing, 1995.<br />
13. Sugiyama, K., Tagawa, S., and Toda, M. Methods for<br />
Visual Understanding of Hierarchical Systems. In IEEE<br />
Transactions on Systems, Man, and Cybernetics, 1981.