Optimal Component Sizing and Forward-looking Dispatch of an ...
Optimal Component Sizing and Forward-looking Dispatch of an ...
Optimal Component Sizing and Forward-looking Dispatch of an ...

Create successful ePaper yourself
Turn your PDF publications into a flip-book with our unique Google optimized e-Paper software.
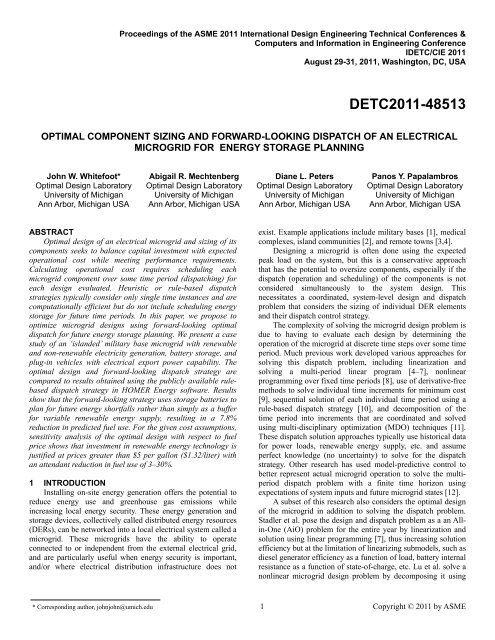
Proceedings <strong>of</strong> the ASME 2011 International Design Engineering Technical Conferences &<br />
Computers <strong><strong>an</strong>d</strong> Information in Engineering Conference<br />
IDETC/CIE 2011<br />
August 29-31, 2011, Washington, DC, USA<br />
DETC2011-48513<br />
OPTIMAL COMPONENT SIZING AND FORWARD-LOOKING DISPATCH OF AN ELECTRICAL<br />
MICROGRID FOR ENERGY STORAGE PLANNING<br />
John W. Whitefoot*<br />
<strong>Optimal</strong> Design Laboratory<br />
University <strong>of</strong> Michig<strong>an</strong><br />
Ann Arbor, Michig<strong>an</strong> USA<br />
Abigail R. Mechtenberg<br />
<strong>Optimal</strong> Design Laboratory<br />
University <strong>of</strong> Michig<strong>an</strong><br />
Ann Arbor, Michig<strong>an</strong> USA<br />
Di<strong>an</strong>e L. Peters<br />
<strong>Optimal</strong> Design Laboratory<br />
University <strong>of</strong> Michig<strong>an</strong><br />
Ann Arbor, Michig<strong>an</strong> USA<br />
P<strong>an</strong>os Y. Papalambros<br />
<strong>Optimal</strong> Design Laboratory<br />
University <strong>of</strong> Michig<strong>an</strong><br />
Ann Arbor, Michig<strong>an</strong> USA<br />
ABSTRACT<br />
<strong>Optimal</strong> design <strong>of</strong> <strong>an</strong> electrical microgrid <strong><strong>an</strong>d</strong> sizing <strong>of</strong> its<br />
components seeks to bal<strong>an</strong>ce capital investment with expected<br />
operational cost while meeting perform<strong>an</strong>ce requirements.<br />
Calculating operational cost requires scheduling each<br />
microgrid component over some time period (dispatching) for<br />
each design evaluated. Heuristic or rule-based dispatch<br />
strategies typically consider only single time inst<strong>an</strong>ces <strong><strong>an</strong>d</strong> are<br />
computationally efficient but do not include scheduling energy<br />
storage for future time periods. In this paper, we propose to<br />
optimize microgrid designs using forward-<strong>looking</strong> optimal<br />
dispatch for future energy storage pl<strong>an</strong>ning. We present a case<br />
study <strong>of</strong> <strong>an</strong> ‘isl<strong><strong>an</strong>d</strong>ed’ military base microgrid with renewable<br />
<strong><strong>an</strong>d</strong> non-renewable electricity generation, battery storage, <strong><strong>an</strong>d</strong><br />
plug-in vehicles with electrical export power capability. The<br />
optimal design <strong><strong>an</strong>d</strong> forward-<strong>looking</strong> dispatch strategy are<br />
compared to results obtained using the publicly available rulebased<br />
dispatch strategy in HOMER Energy s<strong>of</strong>tware. Results<br />
show that the forward-<strong>looking</strong> strategy uses storage batteries to<br />
pl<strong>an</strong> for future energy shortfalls rather th<strong>an</strong> simply as a buffer<br />
for variable renewable energy supply, resulting in a 7.8%<br />
reduction in predicted fuel use. For the given cost assumptions,<br />
sensitivity <strong>an</strong>alysis <strong>of</strong> the optimal design with respect to fuel<br />
price shows that investment in renewable energy technology is<br />
justified at prices greater th<strong>an</strong> $5 per gallon ($1.32/liter) with<br />
<strong>an</strong> attend<strong>an</strong>t reduction in fuel use <strong>of</strong> 3–30%.<br />
1 INTRODUCTION<br />
Installing on-site energy generation <strong>of</strong>fers the potential to<br />
reduce energy use <strong><strong>an</strong>d</strong> greenhouse gas emissions while<br />
increasing local energy security. These energy generation <strong><strong>an</strong>d</strong><br />
storage devices, collectively called distributed energy resources<br />
(DERs), c<strong>an</strong> be networked into a local electrical system called a<br />
microgrid. These microgrids have the ability to operate<br />
connected to or independent from the external electrical grid,<br />
<strong><strong>an</strong>d</strong> are particularly useful when energy security is import<strong>an</strong>t,<br />
<strong><strong>an</strong>d</strong>/or where electrical distribution infrastructure does not<br />
exist. Example applications include military bases [1], medical<br />
complexes, isl<strong><strong>an</strong>d</strong> communities [2], <strong><strong>an</strong>d</strong> remote towns [3,4].<br />
Designing a microgrid is <strong>of</strong>ten done using the expected<br />
peak load on the system, but this is a conservative approach<br />
that has the potential to oversize components, especially if the<br />
dispatch (operation <strong><strong>an</strong>d</strong> scheduling) <strong>of</strong> the components is not<br />
considered simult<strong>an</strong>eously to the system design. This<br />
necessitates a coordinated, system-level design <strong><strong>an</strong>d</strong> dispatch<br />
problem that considers the sizing <strong>of</strong> individual DER elements<br />
<strong><strong>an</strong>d</strong> their dispatch control strategy.<br />
The complexity <strong>of</strong> solving the microgrid design problem is<br />
due to having to evaluate each design by determining the<br />
operation <strong>of</strong> the microgrid at discrete time steps over some time<br />
period. Much previous work developed various approaches for<br />
solving this dispatch problem, including linearization <strong><strong>an</strong>d</strong><br />
solving a multi-period linear program [4–7], nonlinear<br />
programming over fixed time periods [8], use <strong>of</strong> derivative-free<br />
methods to solve individual time increments for minimum cost<br />
[9], sequential solution <strong>of</strong> each individual time period using a<br />
rule-based dispatch strategy [10], <strong><strong>an</strong>d</strong> decomposition <strong>of</strong> the<br />
time period into increments that are coordinated <strong><strong>an</strong>d</strong> solved<br />
using multi-disciplinary optimization (MDO) techniques [11].<br />
These dispatch solution approaches typically use historical data<br />
for power loads, renewable energy supply, etc. <strong><strong>an</strong>d</strong> assume<br />
perfect knowledge (no uncertainty) to solve for the dispatch<br />
strategy. Other research has used model-predictive control to<br />
better represent actual microgrid operation to solve the multiperiod<br />
dispatch problem with a finite time horizon using<br />
expectations <strong>of</strong> system inputs <strong><strong>an</strong>d</strong> future microgrid states [12].<br />
A subset <strong>of</strong> this research also considers the optimal design<br />
<strong>of</strong> the microgrid in addition to solving the dispatch problem.<br />
Stadler et al. pose the design <strong><strong>an</strong>d</strong> dispatch problem as a <strong>an</strong> Allin-One<br />
(AiO) problem for the entire year by linearization <strong><strong>an</strong>d</strong><br />
solution using linear programming [7], thus increasing solution<br />
efficiency but at the limitation <strong>of</strong> linearizing submodels, such as<br />
diesel generator efficiency as a function <strong>of</strong> load, battery internal<br />
resist<strong>an</strong>ce as a function <strong>of</strong> state-<strong>of</strong>-charge, etc. Lu et al. solve a<br />
nonlinear microgrid design problem by decomposing it using<br />
* Corresponding author, johnjohn@umich.edu 1 Copyright © 2011 by ASME
MDO techniques to solve each time increment individually<br />
while coupled to other time increments through battery storage<br />
linking variables [11]. However, their approach does not<br />
calculate a multi-component optimal dispatch; instead, they use<br />
non-dispatchable components (wind <strong><strong>an</strong>d</strong> solar) to determine<br />
when battery storage should charge or discharge. In addition,<br />
they solve the problem using one-day time increments, which<br />
does not consider the hourly dynamics <strong>of</strong> renewable energy<br />
supply <strong><strong>an</strong>d</strong> energy storage. As<strong>an</strong>o <strong><strong>an</strong>d</strong> B<strong><strong>an</strong>d</strong>o solve a nonlinear<br />
design <strong><strong>an</strong>d</strong> dispatch problem by separating the year into six<br />
representative days, then solving each day as a fixed AiO<br />
problem [8]. However, their approach does not consider the<br />
boundaries <strong>of</strong> the solved days by linking the time before <strong><strong>an</strong>d</strong><br />
after the representative days. As such, the approach provides <strong>an</strong><br />
approximation <strong>of</strong> the microgrid perform<strong>an</strong>ce, but may differ<br />
from how the microgrid will be controlled <strong><strong>an</strong>d</strong> operated in<br />
practice. HOMER Energy solves the optimal design problem<br />
using a full-factorial design <strong>of</strong> experiments on number <strong><strong>an</strong>d</strong> size<br />
<strong>of</strong> components, <strong><strong>an</strong>d</strong> uses a rule-based dispatch strategy to<br />
evaluate the microgrid operation. Their approach solves the<br />
dispatch strategy for minimum cost in a single time increment<br />
without explicitly pl<strong>an</strong>ning energy storage for future time<br />
increments [10].<br />
Of the microgrid optimal design <strong><strong>an</strong>d</strong> dispatch approaches,<br />
only Momber et al. consider the dynamics <strong>of</strong> plug-in electric<br />
vehicles (PEVs), which have the added complexity <strong>of</strong> timedependent<br />
connection or disconnection to the microgrid [13].<br />
Though HOMER Energy s<strong>of</strong>tware c<strong>an</strong> model scheduled<br />
generators, it does not currently have the ability to model<br />
scheduled energy storage (such as a PEV), nor coupled<br />
components, such as a vehicle engine charging a battery pack.<br />
This paper proposes a new approach to solve the combined<br />
optimal design <strong><strong>an</strong>d</strong> dispatch strategy for a microgrid using<br />
nonlinear component submodels <strong><strong>an</strong>d</strong> solving the optimal<br />
dispatch using a moving time horizon to link the microgrid<br />
operation before <strong><strong>an</strong>d</strong> after each window <strong>of</strong> time. In addition, the<br />
problem formulation c<strong>an</strong> consider time-vari<strong>an</strong>t connection <strong>of</strong><br />
components to model the interaction <strong>of</strong> PEVs. This approach<br />
will take adv<strong>an</strong>tage <strong>of</strong> forward-<strong>looking</strong> energy storage<br />
scheduling while also approximating realistic control methods,<br />
such as model-predictive control (MPC). A case study is<br />
presented to solve the optimal design <strong><strong>an</strong>d</strong> electrical dispatch <strong>of</strong><br />
<strong>an</strong> isl<strong><strong>an</strong>d</strong>ed military base supplied by diesel generators, battery<br />
storage, photovoltaic solar p<strong>an</strong>els, <strong><strong>an</strong>d</strong> plug-in vehicles. The<br />
results will be compared to the design <strong><strong>an</strong>d</strong> dispatch <strong>of</strong> a similar<br />
system using HOMER Energy s<strong>of</strong>tware as a benchmark.<br />
2 METHODOLOGY<br />
The modeling <strong>of</strong> the microgrid <strong><strong>an</strong>d</strong> the methods used for<br />
performing optimal design with forward-<strong>looking</strong> optimal<br />
dispatch are as follows.<br />
2.1 Microgrid Model<br />
A hub-based microgrid model similar to [14] was<br />
implemented in Matlab. In this model, a microgrid is separated<br />
into a network <strong>of</strong> power conversion <strong><strong>an</strong>d</strong> storage hubs, where<br />
each hub c<strong>an</strong> contain various energy storage <strong><strong>an</strong>d</strong> conversion<br />
devices. An example microgrid hub is shown in Fig. 1.<br />
electricity<br />
natural gas<br />
heat<br />
+ -<br />
Figure 1. Example microgrid hub with energy conversion<br />
<strong><strong>an</strong>d</strong> storage devices<br />
Each hub c<strong>an</strong> be mathematically represented by Eq. 1:<br />
L = CP − SĖ (1)<br />
where L is a vector <strong>of</strong> power loads required at each hub<br />
(electricity, heat, etc.), P is a vector <strong>of</strong> power inputs to the hub<br />
(electricity, natural gas, steam heat, etc.), C is a matrix <strong>of</strong> power<br />
conversion factors to determine how each power input is<br />
tr<strong>an</strong>smitted or converted into a power output, Ė is a vector <strong>of</strong><br />
ch<strong>an</strong>ges in stored energy, <strong><strong>an</strong>d</strong> S is a matrix <strong>of</strong> conversion<br />
efficiencies <strong>of</strong> the energy storage devices. This system <strong>of</strong><br />
equations is solved for each time increment, t. The conversion<br />
factors c <strong><strong>an</strong>d</strong> s are const<strong>an</strong>t for a single time increment, though<br />
they may ch<strong>an</strong>ge nonlinearly with system state. For more<br />
details on hub-based microgrid modeling, refer to [14, 15].<br />
The individual hub models are connected in a network that<br />
uses conservation <strong>of</strong> energy to calculate power tr<strong>an</strong>smission<br />
<strong><strong>an</strong>d</strong> tr<strong>an</strong>smission losses. In this implementation, tr<strong>an</strong>smission<br />
losses are modeled as a const<strong>an</strong>t tr<strong>an</strong>sfer efficiency, η , <strong>of</strong> the<br />
power tr<strong>an</strong>sferred between hubs. This implementation only<br />
calculates bulk power flows <strong><strong>an</strong>d</strong> does not consider reactive<br />
power or electrical dynamics within the system.<br />
To satisfy conservation <strong>of</strong> energy, one dispatchable element<br />
<strong>of</strong> the microgrid is treated as ‘dependent’, <strong><strong>an</strong>d</strong> its dispatch is<br />
determined by the power production <strong><strong>an</strong>d</strong> consumption <strong>of</strong> the<br />
rest <strong>of</strong> the system. In a grid-connected system this c<strong>an</strong> be<br />
represented by the external grid, but for <strong>an</strong> isl<strong><strong>an</strong>d</strong>ed system (not<br />
grid-connected) one device must be selected as the dependent<br />
element. This is shown in Eq. 2, where a diesel generator is<br />
operated as the dependent device <strong><strong>an</strong>d</strong> its dispatch is determined<br />
by the power bal<strong>an</strong>ce <strong>of</strong> the system.<br />
t<br />
P t<br />
gen = max( 0, Pi<br />
)<br />
(2)<br />
In this equation, P i is the power input to hub i <strong><strong>an</strong>d</strong> P gen is the<br />
generator output, solved at time t. If the net power required by<br />
the hubs is negative, i.e. if they are producing more power th<strong>an</strong><br />
they require, the dependent generator is run at zero load <strong><strong>an</strong>d</strong> the<br />
excess energy is assumed to be fed to ground or otherwise<br />
dissipated.<br />
2.2 Optimization Problem Formulation<br />
The overall objective <strong>of</strong> the microgrid design problem is to<br />
minimize the cost <strong>of</strong> implementing <strong><strong>an</strong>d</strong> operating a microgrid<br />
for some given area. For <strong>an</strong> isl<strong><strong>an</strong>d</strong>ed microgrid running mainly<br />
on diesel generators, the objective becomes minimizing the<br />
i<br />
electricity<br />
heat<br />
2 Copyright © 2011 by ASME
combined <strong>an</strong>nual fuel costs <strong><strong>an</strong>d</strong> <strong>an</strong>nualized capital costs.<br />
Variables for the optimization include the size <strong>of</strong> DER<br />
components, number <strong>of</strong> vehicles, <strong><strong>an</strong>d</strong> dispatch <strong>of</strong> the DER<br />
components at each time step. The operating cost <strong>of</strong> the system<br />
is determined by solving the optimal dispatch problem, <strong><strong>an</strong>d</strong> the<br />
optimal dispatch is typically different for each microgrid<br />
design; thus, the optimal dispatch problem is nested within the<br />
optimal design problem. The design <strong><strong>an</strong>d</strong> dispatch problems<br />
c<strong>an</strong>not be solved simult<strong>an</strong>eously (all-in-one) because, to make<br />
the problem tractable, the optimal dispatch problem is setup as<br />
a series <strong>of</strong> optimization problems solved over a moving time<br />
window. If the optimal dispatch problem was known to be<br />
convex, this nested problem structure could be proven to<br />
provide the global optimal design [16]. However, in the current<br />
formulation there are non-convex functions within the dispatch<br />
problem, thus there is the possibility for multiple optima <strong><strong>an</strong>d</strong> no<br />
generalities c<strong>an</strong> be made about global optimality or combined<br />
optimality.<br />
A generalized problem structure is shown in Figure 2. The<br />
optimal design problem (outer loop) passes a vector <strong>of</strong> design<br />
variables to the optimal dispatch problem (inner loop). These<br />
design variables are treated as parameters (held fixed) by the<br />
optimal dispatch problem. The optimal dispatch problem is<br />
solved over a 24-hour time horizon (t 0 to t horiz ) <strong><strong>an</strong>d</strong> then stepped<br />
forward one hour in time <strong><strong>an</strong>d</strong> re-solved, until the entire time<br />
period <strong>of</strong> interest (T 1 to T final ) is completed. For each time<br />
horizon, only the vector <strong>of</strong> optimal dispatch for the first time<br />
step, t 0 , is saved as part <strong>of</strong> the overall optimal dispatch matrix,<br />
û(T,x). At the end <strong>of</strong> the series <strong>of</strong> optimal dispatch problems<br />
(inner loop), the optimal dispatch matrix is returned to the<br />
optimal design problem along with the total fuel use over the<br />
time period from T 1 to T final , f 2 (x,û), <strong><strong>an</strong>d</strong> the feasibility<br />
information <strong>of</strong> the optimal dispatch problem, ĝ <strong><strong>an</strong>d</strong> ĥ .<br />
Optimizing the dispatch over a forward-<strong>looking</strong> time<br />
horizon is necessary to determine the optimal energy storage<br />
strategy, which requires decision-making over multiple time<br />
increments. Ideally the entire time period from T 1 to T final would<br />
be solved simult<strong>an</strong>eously, but it is necessary to decompose the<br />
time period into a series <strong>of</strong> overlapping time windows (the time<br />
horizon) because solving the optimal dispatch for all time<br />
increments simult<strong>an</strong>eously is computationally infeasible,<br />
especially for a nonlinear problem. The dimension <strong>of</strong> the<br />
dispatch optimization problem increases linearly with the<br />
number <strong>of</strong> hours solved simult<strong>an</strong>eously; for example, solving<br />
the optimal hourly dispatch for a single DER over <strong>an</strong> entire<br />
year requires 8760 variables, which quickly becomes<br />
intractable for nonlinear programming algorithms. In this case,<br />
a 24-hour time horizon was chosen because the solar supply<br />
<strong><strong>an</strong>d</strong> power loads also follow a 24-hour cycle. Some optimal<br />
dispatch approaches only optimize for individual hours<br />
sequentially to reduce their computational requirements but<br />
these approaches c<strong>an</strong>not take adv<strong>an</strong>tage <strong>of</strong> look-ahead pl<strong>an</strong>ning<br />
<strong>of</strong> the energy storage.<br />
Figure 2. <strong>Optimal</strong> design <strong><strong>an</strong>d</strong> dispatch structure<br />
As mentioned in the Introduction section, m<strong>an</strong>y approaches<br />
for solving optimal dispatch use linearized submodels <strong><strong>an</strong>d</strong><br />
linear or quadratic programming, but this model uses nonlinear<br />
submodels for the generator efficiency, <strong><strong>an</strong>d</strong> energy storage<br />
efficiency is discontinuous based on whether it is charging or<br />
discharging. Therefore, a nonlinear programming algorithm,<br />
sequential quadratic programming (SQP), was used to solve the<br />
optimal dispatch problem. The SQP code chosen was the<br />
fmincon function in Matlab using <strong>an</strong> active-set strategy <strong><strong>an</strong>d</strong><br />
finite-differencing to calculate gradients. It could be possible to<br />
linearize the model <strong><strong>an</strong>d</strong> solve it more quickly using linear<br />
programming, but this would result in <strong>an</strong> unknown reduction in<br />
fidelity, especially considering the nonlinear efficiency <strong>of</strong> diesel<br />
generators when operating at low load. The optimal dispatch<br />
formulation for a single time horizon is shown below.<br />
Min:<br />
w.r.t.:<br />
t horiz<br />
t<br />
p fuel<br />
E fuel<br />
t=1<br />
ν <br />
ΔSOC <br />
<br />
ΔSOC <br />
fuel cost for time horizon<br />
<br />
% load <strong>of</strong> secondary generator, ∀t<br />
<br />
ch<strong>an</strong>ge in stationary battery SOC, ∀t<br />
ch<strong>an</strong>ge in vehicle battery SOC, ∀t, ∀k<br />
subject to:<br />
<br />
E ≤E ≤E stationary batt. energy limits, ∀t<br />
<br />
E ≤E ≤E vehicle batt. energy limits, ∀t, ∀k<br />
<br />
∑<br />
<br />
P ≤P main generator min. power, ∀t<br />
<br />
ΔSOC con =0 vehicle connectivity, ∀t, ∀k<br />
<br />
0≤ν ≤1.0 ∀t<br />
<br />
−10% ≤ ΔSOC ≤ 10% ∀t<br />
<br />
−30% ≤ ΔSOC ≤ 30%<br />
∀t, ∀k<br />
t∈{1,..,24}; k ∈ {1,..,N }; con ∈ {0,1}<br />
In the preceding formulation, t is the current time increment, k<br />
is the vehicle index, con <br />
<br />
is the vehicle connectivity parameter<br />
<strong>of</strong> vehicle k at time t (where connected = 0), i is the hub index,<br />
p fuel is the fuel price, E fuel is the fuel energy used, E stat is the<br />
stationary battery energy, E veh is the vehicle battery energy, P i is<br />
3 Copyright © 2011 by ASME
the power input required at hub i, P gen1 is the main generator<br />
power, <strong><strong>an</strong>d</strong> overbars <strong><strong>an</strong>d</strong> underbars represent upper <strong><strong>an</strong>d</strong> lower<br />
limits, respectively. The addition <strong>of</strong> the vehicle connectivity<br />
equality constraint allows for the vehicle connectivity vector<br />
(binary) to define when a vehicle is attached to the microgrid,<br />
<strong><strong>an</strong>d</strong> therefore when charging or discharging c<strong>an</strong> be non-zero.<br />
Solving the series <strong>of</strong> SQP problems for the optimal<br />
dispatch results in a numerically noisy function for operating<br />
cost because small ch<strong>an</strong>ges in algorithm convergence propagate<br />
through the series <strong>of</strong> SQP problems. Therefore, the optimal<br />
design problem was solved using the DIRECT derivative-free<br />
algorithm, which c<strong>an</strong> h<strong><strong>an</strong>d</strong>le noisy objective functions [17]. The<br />
design optimization formulation is presented below.<br />
Min:<br />
w.r.t.:<br />
<strong>an</strong>nualized capital cost + <strong>an</strong>nual fuel cost<br />
1 L <br />
p x<br />
<br />
N <br />
E <br />
E <br />
P <br />
P <br />
P <br />
subject to:<br />
P ≥P <br />
g(u) ≤0<br />
h(u) =0<br />
<br />
<br />
+ p E <br />
<br />
1 ≤ N ≤ 5<br />
3 ≤ E ≤ 20 kWh<br />
20 ≤ E ≤ 80 kWh<br />
20 ≤ P ≤ 160 kW<br />
10 ≤ P ≤ 120 kW<br />
10 ≤ P ≤ 120 kW<br />
number <strong>of</strong> plug-in vehicles (integer)<br />
vehicle battery energy capacity (kWh)<br />
stationary battery energy capacity (kWh)<br />
photovoltaic p<strong>an</strong>el peak power (kW)<br />
main generator max. power (kW)<br />
secondary generator max. power (kW)<br />
critical power mainten<strong>an</strong>ce<br />
optimal dispatch problem feasibility<br />
In the preceding formulation, p x is the capital cost for<br />
component x, L x is the expected lifetime <strong>of</strong> component x, P critical<br />
is the maximum power required at the critical hub, ĝ <strong><strong>an</strong>d</strong> ĥ h are<br />
vectors containing the values <strong>of</strong> the dispatch problem inequality<br />
<strong><strong>an</strong>d</strong> equality constraints at its optimum (û), <strong><strong>an</strong>d</strong> the other<br />
variables are defined in the problem statement.<br />
The objective is a function <strong>of</strong> both the <strong>an</strong>nualized capital<br />
costs (design) <strong><strong>an</strong>d</strong> the <strong>an</strong>nual operating costs from the optimal<br />
dispatch problem. Most <strong>of</strong> the constraints on the design<br />
problem are simple bounds on the size <strong>of</strong> the components. The<br />
critical power constraint ensures that the critical hub c<strong>an</strong> be<br />
maintained by the secondary generator alone, in the event that<br />
part <strong>of</strong> the microgrid fails (explained in detail in the Case Study<br />
section). Lastly, there is a constraint to ensure feasibility <strong>of</strong> the<br />
optimal dispatch problem.<br />
3 CASE STUDY<br />
As a case study to implement this approach, a small<br />
military forward-operating base (FOB) was modeled. These<br />
bases typically operate isl<strong><strong>an</strong>d</strong>ed (not connected to <strong>an</strong> external<br />
electrical grid) <strong><strong>an</strong>d</strong> the electrical power is provided by diesel<br />
generators, which <strong>of</strong>ten operate at low-efficiency, part-load<br />
conditions due to the ch<strong>an</strong>ging electrical dem<strong><strong>an</strong>d</strong>. The fullyburdened<br />
cost <strong>of</strong> fuel for the U.S. Army c<strong>an</strong> r<strong>an</strong>ge upwards<br />
from $5 per gallon ($1.32/liter), with one study estimating the<br />
full cost <strong>of</strong> a gallon <strong>of</strong> JP-8 at $13.68/gallon ($3.61/liter) [18].<br />
Thus, the capital investment in renewable energy could be<br />
justified to reduce fuel cost.<br />
In addition, the military is investigating the use <strong>of</strong> plug-in<br />
vehicles to support these FOB microgrids. Future military<br />
vehicles, such as the proposed Joint Light Tactical Vehicle<br />
(JLTV), will have signific<strong>an</strong>t on-board electrical power<br />
generation, potentially <strong>of</strong>fering up to 30 kW <strong>of</strong> export power as<br />
well as modest battery storage. During vehicle operation this<br />
will be used for auxiliary electrical loads rather th<strong>an</strong> vehicle<br />
propulsion, but when the vehicles are parked they could<br />
provide additional storage for the microgrid as well as power<br />
generation capability.<br />
The hypothetical forward-operating base (FOB) modeled<br />
for this study is a small, 50-soldier FOB near Kabul,<br />
Afgh<strong>an</strong>ist<strong>an</strong>. The base is remote <strong><strong>an</strong>d</strong> thus its microgrid is<br />
isl<strong><strong>an</strong>d</strong>ed from <strong>an</strong>y external grid. The microgrid is modeled as<br />
four separate hubs, radially connected from a central powersupply<br />
hub as shown in Figure 3. The main power hub (Hub 1)<br />
contains the main diesel generator, photovoltaic array, <strong><strong>an</strong>d</strong> leadacid<br />
stationary battery. The other hubs consist <strong>of</strong> a vehicle<br />
connection hub (Hub 2), where vehicles c<strong>an</strong> store or supply<br />
energy to the microgrid; a housing hub that is solely <strong>an</strong> energy<br />
consumer (Hub 3); <strong><strong>an</strong>d</strong> a “critical” hub (Hub 4) containing<br />
communications, medical treatment, etc. where power must be<br />
maintained at all times, thus it has <strong>an</strong> additional (secondary)<br />
diesel generator. In this model, the generator in Hub 1 is used<br />
as the dependent device, so its dispatch level is determined by<br />
the power bal<strong>an</strong>ce <strong>of</strong> the rest <strong>of</strong> the system.<br />
Figure 3. Schematic <strong>of</strong> microgrid hubs for the <strong>Forward</strong><br />
Operating Base case study<br />
3.1 Benchmarking Case<br />
The forward-<strong>looking</strong> optimal dispatch strategy was<br />
benchmarked against the dispatch strategy in HOMER Energy’s<br />
microgrid modeling s<strong>of</strong>tware. HOMER was chosen because it<br />
is publicly available for microgrid modeling, it is quick to<br />
implement, <strong><strong>an</strong>d</strong> it has the capability <strong>of</strong> using nonlinear<br />
4 Copyright © 2011 by ASME
submodels (e.g., for the diesel generators). As mentioned in the<br />
Introduction section, HOMER uses a rule-based strategy to<br />
sequentially decide the dispatch at each time increment, linked<br />
only to other time increments through the boundary conditions<br />
<strong>of</strong> energy storage state-<strong>of</strong>-charge (SOC). For this study, the<br />
“cycle charging” strategy was chosen within HOMER. Using<br />
this strategy, HOMER decides the minimum cost dispatch<br />
strategy at each time increment while attempting to only run<br />
diesel generators at maximum load, using excess generator<br />
power to charge energy storage. In addition, this strategy seeks<br />
to reduce battery degradation by using a s<strong>of</strong>t target for the<br />
lower bound <strong>of</strong> battery SOC. For more details on HOMER’s<br />
dispatch strategy, please refer to [10].<br />
The case study was simplified in order to precisely match<br />
our model to a model in HOMER. Most import<strong>an</strong>tly, HOMER<br />
does not have the capability to model coupled systems, such as<br />
a plug-in vehicle where the vehicle engine c<strong>an</strong> charge the<br />
battery when it drops below a state-<strong>of</strong>-charge set point, nor is<br />
HOMER able to model batteries that are selectively connected<br />
<strong><strong>an</strong>d</strong> disconnected from the system, as is the case with a PEV.<br />
Thus, PEVs were not used for the dispatch strategy<br />
benchmarking study. Also, HOMER uses a different PV p<strong>an</strong>el<br />
submodel, so its solar p<strong>an</strong>el output power was directly input to<br />
our forward-<strong>looking</strong> model. The solar p<strong>an</strong>el output over the<br />
entire year is shown as a density map (hour vs. day) in Fig. 4.<br />
The other submodels that were commonized between the<br />
two models were the diesel generator efficiency <strong><strong>an</strong>d</strong> power load<br />
over the year. For the diesel generator model, generator<br />
efficiencies at various loads were gathered on Cummins diesel<br />
generators in rated powers from 10 – 300 kW [19]. A response<br />
surface model was created to calculate the generator efficiency<br />
as a function <strong>of</strong> generator size <strong><strong>an</strong>d</strong> load, with the response<br />
shown in Figure 6.<br />
Figure 6. Model <strong>of</strong> diesel generator efficiency as a function<br />
<strong>of</strong> generator rated power <strong><strong>an</strong>d</strong> load<br />
The electrical power load was based upon the number <strong>of</strong><br />
soldiers at a small forward operating base (50) <strong><strong>an</strong>d</strong> the<br />
estimated average <strong><strong>an</strong>d</strong> peak power loads per soldier (1.5 – 2 kW<br />
per soldier). Due to lack <strong>of</strong> measured data, the daily power load<br />
is generically represented by a base load with <strong>an</strong> afternoon peak<br />
<strong><strong>an</strong>d</strong> night-time trough. Example power loads for each hub over<br />
one day are shown in Fig. 7.<br />
120<br />
Figure 4. HOMER solar p<strong>an</strong>el power output for<br />
one year near Kabul, Afgh<strong>an</strong>ist<strong>an</strong><br />
Power tr<strong>an</strong>smission between hubs was modeled without<br />
losses, but conversions from AC to DC, <strong><strong>an</strong>d</strong> vice versa, had<br />
efficiencies <strong>of</strong> 0.9 for each direction. Likewise, battery charging<br />
<strong><strong>an</strong>d</strong> discharging had a const<strong>an</strong>t efficiency <strong>of</strong> 0.9 for each<br />
direction. The layout <strong>of</strong> the HOMER model is shown in Fig. 5.<br />
Elec. Power Load (kW)<br />
100<br />
80<br />
60<br />
40<br />
20<br />
0<br />
Figure 7. Power load for each hub for J<strong>an</strong>. 15th<br />
overlaid with total load<br />
Total<br />
Hub 3<br />
Hub 4 (critical)<br />
Hub 1<br />
Hub 2<br />
1 3 5 7 9 11 13 15 17 19 21 23<br />
Hour <strong>of</strong> Day<br />
These base power loads for a given day were modified by<br />
seasonal average temperature data for the chosen region by Eq.<br />
3, where the deviation from a “goal” temperature is used to<br />
approximate heating <strong><strong>an</strong>d</strong> cooling load ch<strong>an</strong>ges.<br />
L =L [0.65 + 0.023max(0, T −T ) +<br />
0.016max(0, T −T )] (3)<br />
Figure 5. HOMER microgrid model used for benchmark<br />
In this equation, L is the daily power load, L is the average<br />
power load over the year, T is the average air temperature for<br />
a given day (°F), <strong><strong>an</strong>d</strong> T is the goal temperature, chosen to be<br />
5 Copyright © 2011 by ASME
65 °F. The average daily temperature for the region was taken<br />
from historical data, as shown in Table 1.<br />
Table 1. Average monthly high <strong><strong>an</strong>d</strong> low temperature<br />
for Kabul, Afgh<strong>an</strong>ist<strong>an</strong> (°F) [20]<br />
1 2 3 4 5 6 7 8 9 10 11 12<br />
High 40 41 54 66 75 86 89 89 83 72 59 46<br />
Low 19 21 33 42 47 54 59 57 48 39 29 23<br />
The solar irradi<strong>an</strong>ce for the week modeled is taken from<br />
HOMER, which uses NASA satellite data at approximately this<br />
location. Due to the high variability <strong>of</strong> solar supply (due to<br />
clouds, etc.), the hourly solar irradi<strong>an</strong>ce was averaged using<br />
one week before <strong><strong>an</strong>d</strong> after the days studied to smooth out the<br />
supply <strong><strong>an</strong>d</strong> represent <strong>an</strong> average day at that time <strong>of</strong> year. The<br />
averaged solar irradi<strong>an</strong>ce used is shown in Fig. 8.<br />
Nominal sizes were chosen for the microgrid components<br />
based on a HOMER sizing study with a three-level, fourvariable,<br />
full-factorial design <strong>of</strong> experiments. The component<br />
sizes for the dispatch benchmarking comparison are shown in<br />
Table 2.<br />
Table 2. <strong>Component</strong> sizes used for benchmark study<br />
Main Generator<br />
(kW)<br />
Critical<br />
Generator (kW)<br />
PV p<strong>an</strong>el<br />
(kW)<br />
Storage Battery<br />
(kWh)<br />
70 50 97 48<br />
3.2 Design Optimization Case<br />
To run the design optimization with forward-<strong>looking</strong><br />
optimal dispatch, some ch<strong>an</strong>ges were made from the dispatch<br />
benchmarking case study. The ch<strong>an</strong>ges included addition <strong>of</strong><br />
plug-in vehicles to the microgrid, addition <strong>of</strong> power<br />
tr<strong>an</strong>smission losses between hubs, a different photovoltaic<br />
model, <strong><strong>an</strong>d</strong> running the dispatch for less th<strong>an</strong> a full year to<br />
increase the speed <strong>of</strong> calculating the optimal dispatch for each<br />
design. Additionally, the capital cost <strong>of</strong> the components was<br />
calculated for each design in addition to the operating costs.<br />
The vehicles are modeled as power-export devices, where<br />
the battery pack state-<strong>of</strong>-charge c<strong>an</strong> r<strong>an</strong>ge from 30 – 100%. If<br />
the SOC drops below 30%, the vehicle engine c<strong>an</strong> run <strong>an</strong><br />
electrical generator to recharge the battery to 40% SOC. The<br />
vehicles use their diesel engines through 30 kW integrated<br />
starter/generators to provide electrical power, so the charging<br />
load is fairly low with <strong>an</strong> efficiency <strong>of</strong> 23%.<br />
The vehicles are modeled with a fixed schedule <strong>of</strong><br />
connection <strong><strong>an</strong>d</strong> disconnection from the grid to represent their<br />
daily use, <strong><strong>an</strong>d</strong> this schedule was r<strong><strong>an</strong>d</strong>omly assigned to each<br />
vehicle based upon a 70% probability <strong>of</strong> being connected<br />
during <strong>an</strong>y one-hour period. Though the schedule was<br />
r<strong><strong>an</strong>d</strong>omly defined, the same schedule was used for each case<br />
studied to allow for comparison. The vehicle fuel use while<br />
driving was assumed const<strong>an</strong>t <strong><strong>an</strong>d</strong> excluded from this <strong>an</strong>alysis.<br />
The efficiencies <strong>of</strong> charging both the Li-ion <strong><strong>an</strong>d</strong> lead-acid<br />
batteries, PV array inverter efficiency, <strong><strong>an</strong>d</strong> electrical line losses<br />
between hubs were modeled linearly with const<strong>an</strong>t efficiencies<br />
as listed in Table 3. The batteries were modeled as perfect<br />
storage devices with losses incurred only during charging <strong><strong>an</strong>d</strong><br />
discharging. The power output from the PV array scaled<br />
linearly with solar irradiation <strong><strong>an</strong>d</strong> rated power, which was based<br />
on a 1 kW/m 2 peak solar irradi<strong>an</strong>ce with a 0.95 derating factor.<br />
Table 3. Electrical tr<strong>an</strong>smission <strong><strong>an</strong>d</strong> conversion efficiencies<br />
Tr<strong>an</strong>smission<br />
between hubs<br />
Battery<br />
Charge/Discharge<br />
PV p<strong>an</strong>el<br />
Inverter<br />
Efficiency 95% 90% 94%<br />
Figure 8. Averaged solar irradi<strong>an</strong>ce for Kabul, Afgh<strong>an</strong>ist<strong>an</strong><br />
Solving the optimal dispatch for a single design over <strong>an</strong><br />
entire year is computationally intensive, taking 2–3 hours on a<br />
2.8GHz, quad-core i7 processor PC with 8GB <strong>of</strong> RAM.<br />
Therefore, steps were taken to estimate the operating costs<br />
based on the optimal dispatch for representative days <strong>of</strong> the<br />
year. This approach is a modified version <strong>of</strong> As<strong>an</strong>o <strong><strong>an</strong>d</strong> B<strong><strong>an</strong>d</strong>o’s<br />
[8] but in this case the representative days were linked to<br />
preceding <strong><strong>an</strong>d</strong> following days, <strong><strong>an</strong>d</strong> the total <strong>an</strong>nual operating<br />
cost was estimated using these representative days.<br />
The optimal dispatch problem was initially solved for three<br />
consecutive days during the middle <strong>of</strong> each month <strong>of</strong> the year<br />
for four different microgrid designs. Based on these results it<br />
was determined that the fuel use for one day in February,<br />
March, November <strong><strong>an</strong>d</strong> December could be related to the fuel<br />
use in J<strong>an</strong>uary <strong><strong>an</strong>d</strong> all other months could be related to the fuel<br />
use in July using on the ratios in Table 4. Other microgrid<br />
designs were tested with this method <strong><strong>an</strong>d</strong> the prediction<br />
accuracy for each was greater th<strong>an</strong> 94%. Using this approach<br />
allowed for the entire year’s fuel use to be estimated by solving<br />
the optimal dispatch for three consecutive days in J<strong>an</strong>uary <strong><strong>an</strong>d</strong><br />
July, which subst<strong>an</strong>tially reduced computation time. The final<br />
optimal designs were then re-run for the entire year to get their<br />
true fuel use for comparison. It is import<strong>an</strong>t to note that these<br />
ratios will be different for <strong>an</strong>y location studied due to<br />
differences in seasonal temperatures, solar energy supply, <strong><strong>an</strong>d</strong><br />
base power loads.<br />
Table 4. Ratios for estimating monthly fuel use based on<br />
J<strong>an</strong>uary or July fuel use<br />
Feb Mar Apr May Jun Aug Sep Oct Nov Dec<br />
0.95 0.75 0.99 0.81 0.88 0.98 0.82 1.05 0.80 0.95<br />
The capital costs <strong>of</strong> the microgrid components are<br />
functions <strong>of</strong> their sizes <strong><strong>an</strong>d</strong> the capital costs were “<strong>an</strong>nualized”<br />
to enable trading <strong>of</strong>f with <strong>an</strong>nual operating cost. The capital<br />
cost <strong>of</strong> diesel generators <strong><strong>an</strong>d</strong> photovoltaic arrays are functions<br />
<strong>of</strong> their maximum power, p (kW), <strong><strong>an</strong>d</strong> battery costs are a<br />
function <strong>of</strong> their capacity, c (kWh), as shown in Table 5.<br />
6 Copyright © 2011 by ASME
Table 5. Capital cost equations as a function<br />
<strong>of</strong> component size<br />
<strong>Component</strong> Capital Cost Equation ($) Reference<br />
Generators 1352(p 0.631 ) [21]<br />
PV array 8431(p 0.983 ) + 3000 [21]<br />
Lead-acid Batt 190c [22]<br />
Li-ion Batt 700c [23]<br />
The <strong>an</strong>nualized capital costs are calculated by dividing the<br />
capital cost by expected usable life (the net present value <strong>of</strong> the<br />
capital was not considered). The lifetimes were estimated based<br />
upon lifetimes reported by Lawrence Berkeley National Labs<br />
[21], but the PV life was reduced from 20 to 15 years based on<br />
the rigors <strong>of</strong> military use <strong><strong>an</strong>d</strong> portability. These lifetimes are<br />
summarized in Table 6. Of course, there is always d<strong>an</strong>ger in<br />
estimating capital costs due to the large uncertainty for the cost<br />
<strong><strong>an</strong>d</strong> life <strong>of</strong> a specific device as well as the unknown cost <strong>of</strong><br />
tr<strong>an</strong>sporting this capital equipment to remote areas. However,<br />
to perform design optimization it is necessary to estimate these<br />
capital costs in order to trade<strong>of</strong>f with the potential energy cost<br />
savings they <strong>of</strong>fer.<br />
Table 6. Lifetime estimates for capital equipment<br />
Diesel<br />
Gen.<br />
PV<br />
Array<br />
Lead-Acid<br />
Battery<br />
Li-ion<br />
Battery<br />
Lifetime (yr) 15 15 8 8<br />
Baseline Design <strong><strong>an</strong>d</strong> Sensitivity Analysis<br />
A baseline case was optimized to represent the “business as<br />
usual” approach <strong>of</strong> providing all electrical power from diesel<br />
generators with no energy storage, renewables, or plug-in<br />
vehicles. The baseline case optimized the size <strong>of</strong> two diesel<br />
generators to minimize the estimated fuel use over one year.<br />
Fuel cost was not considered for the baseline cases because the<br />
only option for power generation was diesel generators, thus<br />
there was no trade<strong>of</strong>f with capital cost. That is, the most costefficient<br />
option is independent <strong>of</strong> fuel price.<br />
After the baseline case, the full system was optimized with<br />
the whole r<strong>an</strong>ge <strong>of</strong> components. The fuel prices considered<br />
were $5, $10, <strong><strong>an</strong>d</strong> $15 per gallon ($1.32, $2.64, <strong><strong>an</strong>d</strong> $3.96 per<br />
liter), which represents a typical r<strong>an</strong>ge for the fully-burdened<br />
fuel cost for the U.S. Army.<br />
4 RESULTS & DISCUSSION<br />
The first results are to compare the one-year dispatch<br />
strategy from HOMER <strong><strong>an</strong>d</strong> from the forward-<strong>looking</strong> optimal<br />
dispatch strategy. Next, the optimal design results are shown,<br />
with sensitivity <strong>an</strong>alysis performed while varying fuel price.<br />
4.1 <strong>Dispatch</strong> strategy comparison<br />
The forward-<strong>looking</strong> optimal dispatch resulted in total<br />
yearly fuel use <strong>of</strong> 36,000 gallons compared to 39,050 gallons<br />
using HOMER’s dispatch strategy, a 7.8% reduction. The fuel<br />
use difference c<strong>an</strong> be explained by the differences in the<br />
dispatch strategy <strong>of</strong> the energy storage. Summary plots were<br />
generated showing statistical <strong>an</strong>alysis <strong>of</strong> the energy storage use<br />
over the entire year for both HOMER’s dispatch strategy <strong><strong>an</strong>d</strong><br />
the forward-<strong>looking</strong> strategy (Fig. 9). The plots show both the<br />
me<strong>an</strong> battery power for each hour <strong>of</strong> the day as well as the<br />
distribution around the me<strong>an</strong>.<br />
Figure 9. Hourly me<strong>an</strong> <strong><strong>an</strong>d</strong> distribution <strong>of</strong> battery power:<br />
(top) HOMER, (bottom) forward-<strong>looking</strong> optimal dispatch<br />
The forward-<strong>looking</strong> optimal dispatch is able to pl<strong>an</strong> the<br />
battery storage over multiple time periods, resulting in higher<br />
power battery use in the middle <strong>of</strong> the day (10am – 1pm)<br />
compared to HOMER, as shown in Fig. 9. This shows that the<br />
optimal dispatch c<strong>an</strong> pl<strong>an</strong> for both the presence <strong><strong>an</strong>d</strong> absence <strong>of</strong><br />
solar energy, whereas HOMER’s single-time period dispatch<br />
strategy c<strong>an</strong>not pl<strong>an</strong> ahead for these occurrences.<br />
To see this effect in more detail, <strong>an</strong> example <strong>of</strong> the power<br />
<strong><strong>an</strong>d</strong> energy states <strong>of</strong> the system are plotted for a single day<br />
(June 1 st ) in Fig. 10. This figure only shows the results from the<br />
forward-<strong>looking</strong> optimal dispatch to show how it pl<strong>an</strong>s the<br />
battery state-<strong>of</strong>-charge.<br />
Power (kW) / Energy (kWh)<br />
90<br />
80<br />
70<br />
60<br />
50<br />
40<br />
30<br />
20<br />
10<br />
0<br />
Total Power Load<br />
Solar Power<br />
Main Generator<br />
Second Generator<br />
Battery Energy (kWh)<br />
me<strong>an</strong><br />
distribution<br />
1 3 5 7 9 11 13 15 17 19 21 23<br />
Hour <strong>of</strong> Day<br />
Figure 10. Microgrid power <strong><strong>an</strong>d</strong> energy states for June 1 st<br />
(forward-<strong>looking</strong> optimal dispatch only)<br />
As seen in Fig. 10, the forward-<strong>looking</strong> dispatch c<strong>an</strong> predict<br />
that the solar supply will exceed the total power load beginning<br />
around 11am. Therefore, from hour 7 to 10 the strategy reduces<br />
7 Copyright © 2011 by ASME
the generator load <strong><strong>an</strong>d</strong> instead uses stored battery energy to<br />
supply the load. Then, from hour 10 to 13 the excess solar<br />
power is stored in the battery, replenishing its SOC. Finally, as<br />
solar power falls below the peaking power dem<strong><strong>an</strong>d</strong> from hour<br />
14 to 18, energy is again drawn from the battery while the<br />
generator is slowly ramped up. These actions help reduce the<br />
fuel use <strong>of</strong> the generator, especially in the tr<strong>an</strong>sitional periods<br />
where load is high but solar supply is low. Note that the battery<br />
is not used signific<strong>an</strong>tly overnight because its capacity (48<br />
kWh) is only enough to supply the entire load for a single hour.<br />
Instead, the strategy decides to operate a single generator at<br />
high load to supply the overnight power dem<strong><strong>an</strong>d</strong>s.<br />
The difference in fuel use <strong>of</strong> the forward-<strong>looking</strong> strategy<br />
is modest relative to HOMER, which shows that HOMER is a<br />
useful tool for quickly designing small microgrid systems.<br />
However, its use <strong>of</strong> full-factorial DOE to generate designs<br />
limits its scalability to larger systems, <strong><strong>an</strong>d</strong> it also has the<br />
limitation <strong>of</strong> not being able to implement coupled systems such<br />
as PEVs, nor the ability to combine its dispatch strategy with<br />
nested energy m<strong>an</strong>agement strategies, such as a separate PEV<br />
charging strategy. Therefore, the designs generated by HOMER<br />
may differ from designs generated with a forward-<strong>looking</strong><br />
optimal dispatch strategy, especially for energy storage size.<br />
4.2 <strong>Optimal</strong> microgrid design<br />
The optimization results for the baseline design (generators<br />
only) <strong><strong>an</strong>d</strong> various fuel prices are shown in Table 7. The total<br />
fuel cost for the baseline design is relative to a $5/gallon fuel<br />
price, though as previously mentioned the fuel use is<br />
independent <strong>of</strong> fuel price for these cases, so the total fuel cost<br />
for <strong>an</strong>y price c<strong>an</strong> easily be calculated.<br />
Table 7. Optimization results compared to baseline case<br />
Baseline Designs with Renewables<br />
$5/gal $5/gal $10/gal $15/gal<br />
Total Cost $ 272,540 $ 286,040 $ 491,000 $ 678,290<br />
Fuel Cost $ 268,100 $ 259,500 $ 383,000 $ 539,700<br />
Capital Cost $ 4,440 $ 26,540 $ 108,000 $ 138,590<br />
Main Gen. (kW) 11.9 60.0 23.0 48.9<br />
Solar P<strong>an</strong>el (kW) - 22.6 105.6 136.7<br />
Main Battery (kWh) - 83.7 86.7 95.6<br />
Secondary Gen.(kW) 110.7 58.9 70.0 62.6<br />
Vehicle Batt. (kWh) - 9.9 4.7 9.0<br />
Number <strong>of</strong> Vehicles - 1 1 1<br />
Fuel Use (gallons) 53,620 51,900 38,300 35,980<br />
% Fuel Reduction - 3% 29% 33%<br />
The results show that the optimal design increases the<br />
amount <strong>of</strong> renewable power <strong><strong>an</strong>d</strong> storage battery capacity as fuel<br />
price increases, thus reducing fuel use. The optimal design at<br />
$5/gallon shows fuel use reduction <strong>of</strong> 3%; however, the overall<br />
cost increases slightly from the two-generator case due to the<br />
high expense <strong>of</strong> the solar p<strong>an</strong>els. As the fuel price increases, the<br />
fuel reduction increases up to 33%; the major design ch<strong>an</strong>ges<br />
are that the solar p<strong>an</strong>el power <strong><strong>an</strong>d</strong> stationary battery size<br />
increase. For these cases, the marginal cost <strong>of</strong> the additional<br />
solar p<strong>an</strong>els is less th<strong>an</strong> the marginal cost <strong>of</strong> the fuel saved.<br />
Thus, fuel use is decreased as well as overall yearly cost as<br />
shown in Fig. 11.<br />
Figure 11. Sensitivity <strong>of</strong> total yearly cost (operating +<br />
capital) to fuel price<br />
The 137 kW solar p<strong>an</strong>el array proposed for the $15/gallon case<br />
may be impractical, simply due to its size. However, what this<br />
<strong>an</strong>alysis shows is that as the fuel cost increases, the high cost <strong>of</strong><br />
solar p<strong>an</strong>els is justified, even if the overall size that c<strong>an</strong> be<br />
implemented is limited.<br />
The results also show that the optimal system only uses the<br />
minimum number <strong>of</strong> vehicles. In fact, if the optimization were<br />
allowed to have zero plug-in vehicles it is expected this option<br />
would be chosen. The reason for this is that the benefits <strong>of</strong> the<br />
PEVs, energy storage <strong><strong>an</strong>d</strong> generation, are dominated by less<br />
expensive, higher efficiency stationary storage <strong><strong>an</strong>d</strong> generators.<br />
This is especially true because the PEVs generate electricity at<br />
low efficiency (22%) relative to the stationary generators<br />
because the PEV engines <strong><strong>an</strong>d</strong> generators are mismatched in<br />
power (200 kW vs. 30 kW), thus the engines operate at low<br />
load when running the generators.<br />
The PEVs would be more useful to the microgrid in the<br />
absence <strong>of</strong> stationary batteries <strong><strong>an</strong>d</strong>/or stationary generators.<br />
However, the generation efficiency would still be low <strong><strong>an</strong>d</strong> the<br />
fuel use would be relatively high. In this case, the fuel use<br />
could be reduced if the vehicles’ engines <strong><strong>an</strong>d</strong> generators were<br />
similar sizes, thus allowing the engines to run at high load <strong><strong>an</strong>d</strong><br />
high efficiency.<br />
Though this case study is focused on <strong>an</strong> isl<strong><strong>an</strong>d</strong>ed military<br />
base, the conclusions are applicable to civili<strong>an</strong> situations where<br />
fuel price is relatively high (e.g., the Europe<strong>an</strong> Union, isl<strong><strong>an</strong>d</strong><br />
communities) <strong><strong>an</strong>d</strong> there is no infrastructure to connect to <strong>an</strong><br />
external electrical grid. For cost-effectiveness <strong><strong>an</strong>d</strong> additional<br />
fuel use reduction in the civili<strong>an</strong> case, it would be beneficial to<br />
study the use <strong>of</strong> wind power <strong><strong>an</strong>d</strong> combined heat <strong><strong>an</strong>d</strong> power in<br />
addition to the PV/battery system studied here.<br />
5 CONCLUSIONS<br />
<strong>Forward</strong>-<strong>looking</strong> optimal dispatch c<strong>an</strong> be a useful approach<br />
for designing microgrids with energy storage elements. The<br />
ability to forecast future scenarios enables greater flexibility in<br />
use <strong>of</strong> storage, which c<strong>an</strong> result in designs with lower fuel use.<br />
The strategy presented herein is capable <strong>of</strong> dispatching plug-in<br />
8 Copyright © 2011 by ASME
vehicles with variable connectivity to the microgrid <strong><strong>an</strong>d</strong> c<strong>an</strong><br />
model coupled components such as <strong>an</strong> engine that operates<br />
passively to charge a vehicle battery under states <strong>of</strong> low battery<br />
SOC. This forward-<strong>looking</strong> optimal dispatch strategy c<strong>an</strong> be<br />
nested in <strong>an</strong> optimal design formulation, which is more<br />
scaleable th<strong>an</strong> full-factorial design approaches <strong><strong>an</strong>d</strong> c<strong>an</strong> generate<br />
designs with better use <strong>of</strong> energy storage.<br />
Under the isl<strong><strong>an</strong>d</strong>ed forward-operating base scenario<br />
presented here, design optimization results show that the<br />
minimum cost designs reduce fuel use from 3–30% by using a<br />
microgrid <strong>of</strong> renewable energy, storage batteries, <strong><strong>an</strong>d</strong> plug-in<br />
vehicles to augment the typical generator-based electrical<br />
supply. This fuel reduction comes from the renewable energy<br />
source with a forward-<strong>looking</strong> electrical storage strategy,<br />
downsized generators, <strong><strong>an</strong>d</strong> increased generator load, which<br />
increases efficiency. The capital cost <strong>of</strong> this system c<strong>an</strong> be<br />
justified when the fuel cost is greater th<strong>an</strong> $5/gallon<br />
($1.32/liter), which is at the low end <strong>of</strong> the fully-burdened cost<br />
<strong>of</strong> fuel for a U.S. Army forward base. Above this fuel price, the<br />
addition <strong>of</strong> renewables <strong><strong>an</strong>d</strong> energy storage c<strong>an</strong> save both fuel<br />
<strong><strong>an</strong>d</strong> overall cost. This economic <strong>an</strong>alysis does not consider the<br />
additional savings due to reduced re-supply trucks necessary to<br />
provide fuel to the base. The fuel saved for this base is<br />
equivalent to 7 military t<strong>an</strong>ker trucks per year, which saves not<br />
only additional fuel but reduces the risk to soldiers to<br />
improvised explosive devices (IEDs) <strong><strong>an</strong>d</strong> other supply-line<br />
d<strong>an</strong>gers. However, practical issues may limit the size <strong>of</strong> solar<br />
p<strong>an</strong>els, storage batteries, etc. that c<strong>an</strong> be added to a small base,<br />
due to tr<strong>an</strong>sport logistics, mainten<strong>an</strong>ce, <strong><strong>an</strong>d</strong> vulnerability. These<br />
are issues for further study.<br />
For this case study, vehicles are not chosen to be a large<br />
contributor to the microgrid. This is because their benefits,<br />
energy storage <strong><strong>an</strong>d</strong> energy generation via the engine, are also<br />
present in other more efficient <strong><strong>an</strong>d</strong> lower cost options. Thus, the<br />
stationary storage batteries <strong><strong>an</strong>d</strong> stationary generators are chosen<br />
instead <strong>of</strong> additional vehicles. However, for bases where either<br />
the stationary batteries <strong><strong>an</strong>d</strong>/or generators are not present, the<br />
vehicles would then become useful. In addition, the vehicles<br />
could provide immediate, short-term grid support under crisis<br />
situations where there is a loss <strong>of</strong> power generation capacity.<br />
These scenarios are pl<strong>an</strong>ned for future studies.<br />
Though these results are applied to <strong>an</strong> isl<strong><strong>an</strong>d</strong>ed military<br />
base, they are applicable to civili<strong>an</strong> cases where fuel price is<br />
greater th<strong>an</strong> $5/gallon ($1.32/liter) <strong><strong>an</strong>d</strong> there is no infrastructure<br />
available to connect to <strong>an</strong> external electrical grid. Examples <strong>of</strong><br />
this situation include isl<strong><strong>an</strong>d</strong> communities, remote towns, etc.<br />
This study is limited by the assumptions made for model<br />
inputs <strong><strong>an</strong>d</strong> the specifics <strong>of</strong> the location <strong><strong>an</strong>d</strong> microgrid studied.<br />
Improvements should include actual measured power load data<br />
<strong><strong>an</strong>d</strong> more realistic, nonlinear submodels for the batteries <strong><strong>an</strong>d</strong><br />
PV array. In addition, this model was solved deterministically<br />
assuming perfect future knowledge. Ideally, this system should<br />
be optimized while considering the uncertainties in solar<br />
availability, power load, vehicle plug-in, etc. Furthermore, this<br />
study only looked at a single microgrid topology with fixed<br />
components. Future studies should include variable numbers<br />
<strong><strong>an</strong>d</strong> types <strong>of</strong> components, as well as the addition <strong>of</strong> wind power<br />
<strong><strong>an</strong>d</strong> other renewable energy sources as options.<br />
Future work should also investigate the use <strong>of</strong> optimal<br />
control techniques. Such techniques may include Model<br />
Predictive Control (MPC) <strong><strong>an</strong>d</strong> various methods for trajectory<br />
optimization. A variety <strong>of</strong> computationally efficient methods<br />
have been developed for the trajectory optimization problem,<br />
including pseudospectral methods [24–26]. By formulating the<br />
microgrid scheduling problem in state-space form, such<br />
methods c<strong>an</strong> be applied to the problem <strong>of</strong> optimal power<br />
dispatch <strong>of</strong> the microgrid.<br />
ACKNOWLEDGMENTS<br />
This research is supported by the Automotive Research<br />
Center, a US Army Center <strong>of</strong> Excellence in Modeling <strong><strong>an</strong>d</strong><br />
Simulation <strong>of</strong> Ground Vehicles, headquartered at the University<br />
<strong>of</strong> Michig<strong>an</strong>. This support is gratefully acknowledged.<br />
Additional th<strong>an</strong>ks are given to HOMER Energy for making its<br />
microgrid design s<strong>of</strong>tware available.<br />
REFERENCES<br />
[1] Shaffer, E.C., Massie, D.D., <strong><strong>an</strong>d</strong> Cross, J.B., 2006, “Power<br />
<strong><strong>an</strong>d</strong> Energy Architecture for Army Adv<strong>an</strong>ced Energy<br />
Initiative,” Army Research Laboratory Report, Adelphi,<br />
Maryl<strong><strong>an</strong>d</strong>.<br />
[2] Tselepis, S., 2010, “Greek Experience with Microgrids:<br />
Results from the Gaidourom<strong>an</strong>tra Site, Kythnos Isl<strong><strong>an</strong>d</strong>”,<br />
V<strong>an</strong>couver 2010 Symposium on Micrgrids, 22 July,<br />
V<strong>an</strong>couver, B.C., C<strong>an</strong>ada.<br />
[3] Ashok, S., 2007, “Optimised Model <strong>of</strong> a Community<br />
Hybrid Energy System,” J. <strong>of</strong> Renewable Energy, 32(7),<br />
pp. 1155-1164.<br />
[4] Gupta, A., Saini, R.P., <strong><strong>an</strong>d</strong> Sharma, M.P., 2010, “Steadystate<br />
Modelling <strong>of</strong> Hybrid Energy System for Off Grid<br />
Electrification <strong>of</strong> Cluster <strong>of</strong> Villages,” J. <strong>of</strong> Renewable<br />
Energy, 35(2), pp. 520-535.<br />
[5] del Real, A. J., Galus, M. D., Bordons, C., <strong><strong>an</strong>d</strong> Andersson,<br />
G., 2009, “<strong>Optimal</strong> power dispatch <strong>of</strong> energy networks<br />
including external power exch<strong>an</strong>ge,” Europe<strong>an</strong> Control<br />
Conference (ECC), 23-26 August, Budapest, Hungary.<br />
[6] Hawkes, A.D., <strong><strong>an</strong>d</strong> Leach, M.A., 2009, “Modelling high<br />
level system design <strong><strong>an</strong>d</strong> unit commitment for a microgrid,”<br />
J. <strong>of</strong> Applied Energy, 86 (7-8), pp. 1253–1265.<br />
[7] Stadler, M., Marnay, C., Siddiqui, A., Lai, J., C<strong>of</strong>fey, B.,<br />
<strong><strong>an</strong>d</strong> Aki, H., 2009, “Effect <strong>of</strong> Heat <strong><strong>an</strong>d</strong> Electricity Storage<br />
<strong><strong>an</strong>d</strong> Reliability on Microgrid Viability: A Study <strong>of</strong><br />
Commercial Buildings in California <strong><strong>an</strong>d</strong> New York States,”<br />
Ernest Orl<strong><strong>an</strong>d</strong>o Lawrence Berkeley National Laboratory,<br />
Report LBNL-1334E-2009.<br />
[8] As<strong>an</strong>o, H., B<strong><strong>an</strong>d</strong>o, S., <strong><strong>an</strong>d</strong> Wat<strong>an</strong>abe, H., 2007,<br />
“Methodology to Design the Capacity <strong>of</strong> a Microgrid,”<br />
IEEE International Conference on System <strong>of</strong> Systems<br />
Engineering, 16-18 April, S<strong>an</strong> Antonio, TX.<br />
9 Copyright © 2011 by ASME
[9] Mohamed, F.A., <strong><strong>an</strong>d</strong> Koivo, H.N., 2009, “System modeling<br />
<strong><strong>an</strong>d</strong> optimal m<strong>an</strong>agement <strong>of</strong> a Microgrid using Mesh<br />
Adaptive Direct Search,” J. <strong>of</strong> Electrical Power <strong><strong>an</strong>d</strong><br />
Energy Systems, 32(5), pp. 398-407.<br />
[10] Lambert, T., Gilm<strong>an</strong>, P., Lilienthal, P., 2006, “Chapter 15:<br />
Micropower System Modeling with Homer”, in Integration<br />
<strong>of</strong> Alternative Sources <strong>of</strong> Energy by Felix A. Farret <strong><strong>an</strong>d</strong> M.<br />
Godoy Simoes, John Wiley & Sons, Inc.<br />
[11] Lu, S., Schroeder, N.B., Kim, H.M., Sh<strong>an</strong>bhag, U.V., 2010,<br />
“Hybrid Power/Energy Generation Through<br />
Multidisciplinary <strong><strong>an</strong>d</strong> Multilevel Design Optimization with<br />
Complementarity Constraints,” ASME Journal <strong>of</strong><br />
Mech<strong>an</strong>ical Design, 132(10), pp. 101007 -101019.<br />
[12] Arnold, M., Negenborn, R.R., Andersson, G., <strong><strong>an</strong>d</strong> De<br />
Schutter, B., 2009, “Multi-Area Predictive Control for<br />
Combined Electricity <strong><strong>an</strong>d</strong> Natural Gas Systems,” Europe<strong>an</strong><br />
Control Conference (ECC), 23-26 August, Budapest,<br />
Hungary.<br />
[13] Momber, I., Gómez, T., Venkataram<strong>an</strong><strong>an</strong>, G., Stadler, M.,<br />
Beer, S., Lai, J., Marnay, C., <strong><strong>an</strong>d</strong> Battaglia, V., 2010, “Plugin<br />
Electric Vehicle Interactions with a Small Office<br />
Building: An Economic Analysis using DER-CAM,”<br />
Proceedings <strong>of</strong> the 2010 IEEE PES General Meeting, 26-<br />
29 July, Minneapolis, MN.<br />
[14] Geidl, M. <strong><strong>an</strong>d</strong> Andersson, G., 2006, “Operational <strong><strong>an</strong>d</strong><br />
Structural Optimization <strong>of</strong> Multi-Carrier Energy Systems,”<br />
Europe<strong>an</strong> Tr<strong>an</strong>sactions on Electrical Power, 16 (5), pp.<br />
463-477.<br />
ology/monthly/graph/AFXX0003, accessed J<strong>an</strong>uary 6,<br />
2011.<br />
[21] Lawrence Berkeley National Laboratory, “DER technology<br />
Data Used after 2004,” compiled by Ry<strong>an</strong> Firestone,<br />
http://der.lbl.gov/der-cam/technology-data-archive,<br />
accessed December 6, 2010.<br />
[22] Vyas, A.D., Henry K. Ng, D<strong>an</strong>ilo J. S<strong>an</strong>tini, <strong><strong>an</strong>d</strong> John L.<br />
Anderson, 1997, “Batteries for Electric Drive Vehicles:<br />
Evaluation <strong>of</strong> Future Characteristics <strong><strong>an</strong>d</strong> Costs through a<br />
Delphi Study,” Argonne National Laboratory, SAE<br />
International Spring Fuels <strong><strong>an</strong>d</strong> Lubric<strong>an</strong>ts Meeting, May<br />
5-7, Detroit, Michig<strong>an</strong>.<br />
[23] Peterson, J., 2009, “Li-ion Batteries <strong><strong>an</strong>d</strong> How Cheap Beat<br />
Cool in the Chevy Volt,” Seeking Alpha, March 23.<br />
[24] Betts, J.T., <strong><strong>an</strong>d</strong> Fr<strong>an</strong>k, P.D., 1994, “A Sparse Nonlinear<br />
Optimization Algorithm”, J. <strong>of</strong> Optimization Theory <strong><strong>an</strong>d</strong><br />
Applications, 82(3), pp. 519-541.<br />
[25] Betts, J.T., 1998, “Survey <strong>of</strong> Numerical Methods for<br />
Trajectory Optimization”, J. <strong>of</strong> Guid<strong>an</strong>ce, Control <strong><strong>an</strong>d</strong><br />
Dynamics, 21(2), pp. 193-207.<br />
[26] Ross, M., <strong><strong>an</strong>d</strong> Fahroo, F., 2003, “Legendre Pseudospectral<br />
Approximations <strong>of</strong> <strong>Optimal</strong> Control Problems”, in New<br />
Trends in Nonlinear Dynamics <strong><strong>an</strong>d</strong> Control, LNCIS 295,<br />
Springer-Verlag, Berlin, pp. 327 – 342.<br />
[15] Geidl, M., 2007, “Integrated Modeling <strong><strong>an</strong>d</strong> Optimization <strong>of</strong><br />
Multi-Carrier Systems,” Doctoral dissertation, ETH<br />
Zurich.<br />
[16] Fathy, H. K., Reyer, J. A., Papalambros, P. Y., <strong><strong>an</strong>d</strong> Ulsoy,<br />
A. G., 2001, “On the Coupling Between the Pl<strong>an</strong>t <strong><strong>an</strong>d</strong><br />
Controller Optimization Problems,” IEEE Americ<strong>an</strong><br />
Control Conference, 25-27 June, Arlington, VA.<br />
[17] Jones, D.R., 2001, “DIRECT Global Optimization<br />
Algorithm”, Encyclopedia <strong>of</strong> Optimization, eds. C. Floudas<br />
<strong><strong>an</strong>d</strong> P. Pardalos, Kluwer Academic Publishers, pp. 431-440.<br />
[18] Hartr<strong>an</strong>ft, T.J., Yeboah, F., Grady, D., <strong><strong>an</strong>d</strong> Ducey, R., 2007,<br />
“Proceedings <strong>of</strong> the 1st Army Installation Energy Security<br />
<strong><strong>an</strong>d</strong> Independence Conference”, Construction Engineering<br />
Research Laboratory Report ERDC/CERL TR-07-9, U.S.<br />
Army Corps <strong>of</strong> Engineers.<br />
[19] Cummins Power Generation, “Specifications <strong><strong>an</strong>d</strong> Data<br />
Sheets,”<br />
http://cumminspower.com/en/technical/documents,<br />
accessed J<strong>an</strong>uary 10, 2011.<br />
[20] Average Monthly Temperatures in Kabul, Afgh<strong>an</strong>ist<strong>an</strong>,<br />
http://www.weather.com/outlook/health/allergies/wxclimat<br />
10 Copyright © 2011 by ASME