2007_Subprime_Shorting-Home-Equity-Mezzanine-Tranches-1
2007_Subprime_Shorting-Home-Equity-Mezzanine-Tranches-1
2007_Subprime_Shorting-Home-Equity-Mezzanine-Tranches-1

You also want an ePaper? Increase the reach of your titles
YUMPU automatically turns print PDFs into web optimized ePapers that Google loves.
Footnote Exhibits - Page 0944<br />
Strictly private & confidential<br />
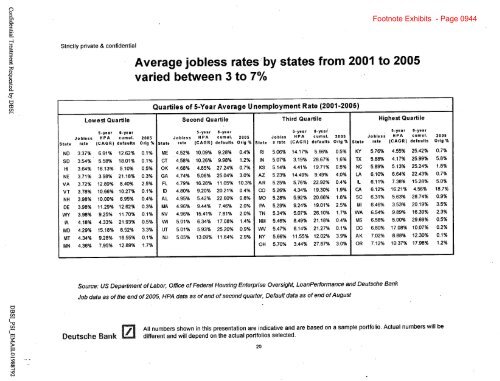
Average jobless rates by states from 2001 to 2005<br />
varied between 3 to 7%<br />
Quartiles of 5-Year Average Unemployment Rate (2001-2005)<br />
I I I<br />
Lowest Quartile<br />
Second Quartile<br />
Third Quartile<br />
Highest Quartile<br />
5-year 6-year<br />
5-year 6-year<br />
5-year 6-year<br />
5-year 6-year<br />
Jobless HPA cumul. 2005 Jobless HPA cuml. 2005 Jobles HPA cumul. 2005 Jobless HPA cumul. 2005<br />
rate (CAGR) defaults Orig % State rate (CAGR) defaults Orig % State s rate (CAGR) defaults Orig %<br />
rate (CAGR) defaults Orig %<br />
3.37% 6.91% 12.62% 0.1% ME 4.52% 10.09% 9.28% 0.4% RI 5.06% .14.17% 5.66% 0.5%<br />
5.76% 4.55% 25.42% 0.7%<br />
3.54% 5.58% 18.01% 0.1% CT 4.58% 10.26% 9.98% 1.2% IN 5.07% 3.19% 28.67% 1.6%<br />
5.88% 4.17% 25.99% 5.8%<br />
3.64% 16.13% 5.10% 0.5% OK 4.68% 4.85% 27.24% 0.7% KS 5.14% 4.41% 19.71% 0.5%<br />
5.89% 5.13% 25.24% 1.8%<br />
3.71% 3.98% 21.18% 0.3% GA 4.74% 5.06% 25.04% 3.0% AZ 5.23% 14.49% 9.49% 4.0%<br />
6.10% 6.64% 22.43% 0.7%<br />
3.72% 12.89% 8.40% 2.5% FL 4.79% 16.28% 11.05% 10.3% AR 5.25% 5.76% 22.92% 0.4%<br />
6.11% 7.38% 15.28% 5.0%<br />
3.78% 10.66% 10.27% 0.1% ID 4.80% 9.20% 20.21% 0.4% CO 5.26% 4.34% 19.30% 1.9%<br />
6.12% 16.21% 4.56% 18.7%<br />
3.98% 10.00% 6.95% 0.4% AL 4.95% 5.42% 22.60% 0.8% MO 5.28% 5.92% 20.66% 1.8%<br />
6.31% 5.63% 28.74% 0.9%<br />
3.98% 11.29% 12.62% 0.3% MA 4.96% 9.44% 7.46% 2.0% PA 5.29% 9.24% 19.01% 2.5%<br />
6.46% 3.53% 20.19% 3.5%<br />
3.98% 9.25% 11.70% 0.1% NV 4.96% 15.41% 7.81% 2.0% TN 5.34% 5.07% 26.10% 1.7%<br />
6.54% 9.89% 16.39% 2.3%<br />
4.18% 4.33% 21.93% 0.5% WI 5.01% 6.34% 17.08% 1.4% NM 5.46% 8.49% 21.18% 0.4%<br />
6.58% 5.00% 29.69% 0.5%<br />
4.29% 15.18% 8.52% 3.3% UT 5.01% 5.93% 25.20% 0.9% WV 5.47% 6.14% 21.27% 0.1%<br />
6.80% 17.08% 10.07% 0.2%<br />
4.34% 9.28% 16.55% 0.1% NJ 5.05% 13.09% 11.64% 2.9% NY 5.66% 11.55% 12.02% 3.9%<br />
7.02% 8.88% 12.30% 0.1%<br />
4.36% 7.95% 12.89% 1.7%<br />
OH 5.70% 3.44% 27.87% 3.0%<br />
7.12% 10.37% 17.98% 1.2%<br />
Source: US Department of Labor, Office of Federal Housing Enterprise Oversight, LoanPerformance and Deutsche Bank<br />
Job data as of the end of 2005, HPA data as of end of second quarter, Default data as of end of August<br />
C/2<br />
All numbers shown in this presentation are indicative and are based on a sample portfolio. Actual numbers will be<br />
Deutsche Bank [ different and will depend on the actual portfolios selected.<br />
20<br />
00 __1