A steady state approach to calculation of valve pressure rise rate ...
A steady state approach to calculation of valve pressure rise rate ...
A steady state approach to calculation of valve pressure rise rate ...

Create successful ePaper yourself
Turn your PDF publications into a flip-book with our unique Google optimized e-Paper software.
TechS<strong>of</strong>t Engineering & SVS FEM<br />
C<br />
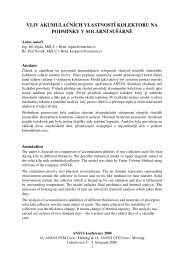
s 1=const.<br />
p s1<br />
p cr<br />
q s1<br />
A<br />
B<br />
s 1=const.<br />
s 1<br />
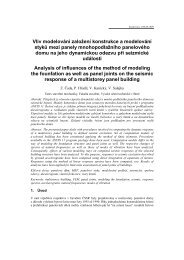
Fig. 5. Visualisation <strong>of</strong> the <strong>pressure</strong> <strong>rise</strong> <strong>rate</strong> characteristic design<br />
Similarly <strong>to</strong> the flow forces approximation, we can also approximate the <strong>pressure</strong> drop data points using<br />
quadratic polynomial trendlines in form:<br />
, (7)<br />
where the polynomial coefficients , , and are obtained again from the spreadsheet trendline properties. If we<br />
use the calculated flow <strong>rate</strong> from (6), we obtain corresponding <strong>pressure</strong> drop:<br />
, (8)<br />
This procedure is repeated for all the 3 strokes so we obtain the flow <strong>rate</strong> and <strong>pressure</strong> drop pairs:<br />
[ ] [ ] [ ] (9)<br />
plus we have the additional point [<br />
] The final <strong>pressure</strong> <strong>rise</strong> <strong>rate</strong> characteristic can be designed from<br />
those points – see red line in graph C in Fig. 5.<br />
5. Comparison with measurement<br />
A simplified hydraulic scheme used for measurement <strong>of</strong> the CPRV is shown in Fig. 6a. An auxiliary pump H<br />
provides oil <strong>to</strong> the testing device. The throttle <strong>valve</strong> TV is fully open so the <strong>pressure</strong> indicated by the gauge G1 is<br />
small in comparison with the cracking <strong>pressure</strong> <strong>of</strong> the tested CPRV. As the TV restricts flow area, the load <strong>of</strong>