Lecture 12: Ligand Binding Measurements
Lecture 12: Ligand Binding Measurements
Lecture 12: Ligand Binding Measurements

Create successful ePaper yourself
Turn your PDF publications into a flip-book with our unique Google optimized e-Paper software.
Biochemistry I Fall Term, 2001 September 26, 2001<br />
<strong>Lecture</strong> <strong>12</strong>: <strong>Ligand</strong> <strong>Binding</strong> <strong>Measurements</strong><br />
Assigned reading in Campbell: none.<br />
Background reading: "<strong>Ligand</strong> <strong>Binding</strong> Equations and Analysis" by Dr. Gordon Rule.<br />
This more extensive treatment is available as an eight-page PDF image.<br />
Key Terms:<br />
Association constant<br />
Scatchard equation & Scatchard plot<br />
Equilibrium dialysis<br />
Dissociation constant<br />
Hill equation & Hill plot<br />
Take the Review Quiz on <strong>Lecture</strong> <strong>12</strong> concepts:<br />
http://www.bio.cmu.edu/courses/03231/MCQF01/MCQLec<strong>12</strong>.htm<br />
<strong>Ligand</strong> <strong>Binding</strong><br />
<strong>Measurements</strong> of the binding affinity and binding stoichiometry between molecules and<br />
macromolecules provide essential information on topics that range from mechanism to<br />
specificity. For example, ligands are nearly always competing with other ligands for a specific<br />
site, especially in vivo. In addition, binding events are frequently coupled to conformational<br />
changes, catalysis, and cell-cell interactions.<br />
A. Basic treatment of simple binding data<br />
This section repeats the derivation of the Scatchard equation found in the <strong>Ligand</strong> <strong>Binding</strong><br />
Equations and Analysis handout. The origin of this equation in the equilibrium equations and<br />
the definitions that allow a few algebraic manipulations will be covered in lecture as follows:<br />
1. M + L ML<br />
2. K d = [M][L]/[ML] K a = 1/K d<br />
3. ν = [L] bound /[M] total = [ML]/([M] + [ML])<br />
4. ν = [L]/(K d + [L])<br />
1
From the saturation equation (eqn. 4), the following useful rerrangements can be made:<br />
a. ν/[L] = 1/K d - ν/K d Scatchard equation.<br />
b. 1/ν = K d /[L] + 1 Double reciprocal equation.<br />
c. ν/[L] = n/K d - ν/K d Multiple binding sites.<br />
d. logθ = -logK d + n H log[L] Hill Equation.<br />
The application of the mass-action equations, even to simple binding equilibria (i.e. identical and<br />
independent sites) requires some care. Ideally, we want an estimate of both K d and n for a given<br />
interaction. Sometimes only one or the other can be determined.<br />
B. Experimental <strong>Measurements</strong> of <strong>Ligand</strong> <strong>Binding</strong><br />
Model reaction:<br />
ML M + L<br />
Schematically: +<br />
Dissociation constant: K d = [M][L]/[ML]<br />
The following figures show how the equilibrium dialysis experiment can be used to determine<br />
the concentrations of M, L, and ML at binding equilibrium.<br />
At the start of the measurement, the protein (M) is present only in the left cell of the dialysis<br />
chamber. The small molecule (L) is present only in the right cell. The left and right cells are<br />
separated by a semipermeable membrane, through which only the ligand can pass.<br />
[For this illustration we will use concentration units of "balls/Box" (b/B) instead of M<br />
(mol/liter).]<br />
Starting concentrations (b/B):<br />
Left cell: [ML] = 0; [L] = 0; [M] = 4.<br />
Right cell: [ML] = 0; [L] = <strong>12</strong>; [M] = 0.<br />
When equilibrium is reached, the<br />
concentration of free ligand will be the same<br />
in both cells. However, because the protein<br />
can bind the ligand, the concentration of total ligand will be higher in the left cell.<br />
2
Equilibrium concentrations (b/B):<br />
Left cell: [ML] = 2; [L] = 5; [M] = 2.<br />
Right cell: [ML] = 0; [L] = 5; [M] = 0.<br />
(The animation requires the Shockwave plug-in.)<br />
The above illustrations are static "snapshots"<br />
of the molecules during the experiment.<br />
Open a window that simulates the Molecular<br />
Motion at <strong>Binding</strong> Equilibrium.<br />
With the above results we can calculate the K d for this cartoon binding reaction:<br />
K d = [M][L]/[ML] = (2 b/B)∞(5 b/B)/(2 b/B) = 5 b/B.<br />
Note the following features of this binding equilibrium:<br />
[L] = 5 b/B in both cells.<br />
[L] total = 7 b/B in the left cell.<br />
[L] total - [L] = 2 b/B = [ML] in the left cell.<br />
Thus, the difference in [L] total between the two cells is the measurement of [ML] that we need to<br />
add one datum to a Scatchard plot. A Scatchard plot consists of equilibrium dialysis<br />
measurements done at several starting concentrations of ligand. (See the <strong>Ligand</strong> <strong>Binding</strong> page<br />
for an example of the calculations and graphing procedures.)<br />
For example, with the K d calculated above, what do you predict for the equilibrium<br />
concentrations of all species if the starting concentration of ligand had been 33 b/B? or 5 b/B?<br />
C. Examples of Data Analysis<br />
Experimental data, e.g. from an equilibrium dialysis experiment, can be analyzed to yield values<br />
for K d and n in several ways. Computer programs are available that provide automated and<br />
objective estimates of these parameters. The processed data are then published in one or more of<br />
the following graphical formats:<br />
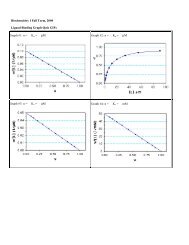
1. Scatchard Plots: single site (n = 1) and multiple sites (n >1).<br />
2. Fraction Saturation Plots: Y vs. log[L].<br />
3. Double Reciprocal Plots: single site (n = 1) and multiple sites (n >1).<br />
4. Hill Plots: Cooperative binding to multiple sites (n H
9.20.01<br />
4