Lecture 12: Ligand Binding Measurements
Lecture 12: Ligand Binding Measurements
Lecture 12: Ligand Binding Measurements

You also want an ePaper? Increase the reach of your titles
YUMPU automatically turns print PDFs into web optimized ePapers that Google loves.
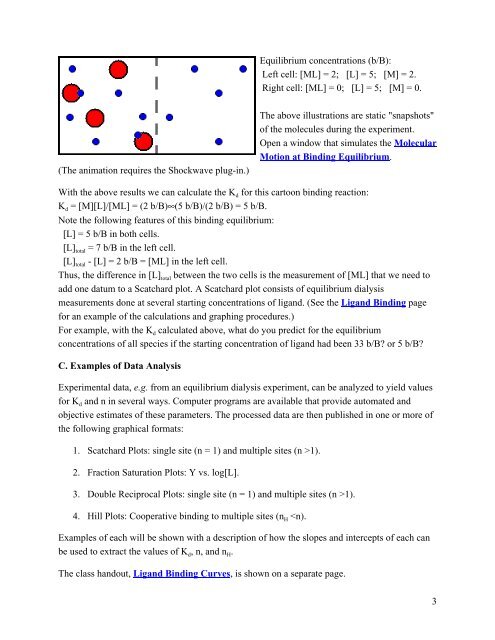
Equilibrium concentrations (b/B):<br />
Left cell: [ML] = 2; [L] = 5; [M] = 2.<br />
Right cell: [ML] = 0; [L] = 5; [M] = 0.<br />
(The animation requires the Shockwave plug-in.)<br />
The above illustrations are static "snapshots"<br />
of the molecules during the experiment.<br />
Open a window that simulates the Molecular<br />
Motion at <strong>Binding</strong> Equilibrium.<br />
With the above results we can calculate the K d for this cartoon binding reaction:<br />
K d = [M][L]/[ML] = (2 b/B)∞(5 b/B)/(2 b/B) = 5 b/B.<br />
Note the following features of this binding equilibrium:<br />
[L] = 5 b/B in both cells.<br />
[L] total = 7 b/B in the left cell.<br />
[L] total - [L] = 2 b/B = [ML] in the left cell.<br />
Thus, the difference in [L] total between the two cells is the measurement of [ML] that we need to<br />
add one datum to a Scatchard plot. A Scatchard plot consists of equilibrium dialysis<br />
measurements done at several starting concentrations of ligand. (See the <strong>Ligand</strong> <strong>Binding</strong> page<br />
for an example of the calculations and graphing procedures.)<br />
For example, with the K d calculated above, what do you predict for the equilibrium<br />
concentrations of all species if the starting concentration of ligand had been 33 b/B? or 5 b/B?<br />
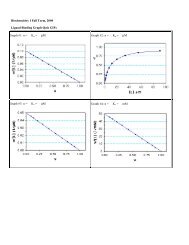
C. Examples of Data Analysis<br />
Experimental data, e.g. from an equilibrium dialysis experiment, can be analyzed to yield values<br />
for K d and n in several ways. Computer programs are available that provide automated and<br />
objective estimates of these parameters. The processed data are then published in one or more of<br />
the following graphical formats:<br />
1. Scatchard Plots: single site (n = 1) and multiple sites (n >1).<br />
2. Fraction Saturation Plots: Y vs. log[L].<br />
3. Double Reciprocal Plots: single site (n = 1) and multiple sites (n >1).<br />
4. Hill Plots: Cooperative binding to multiple sites (n H