Threadneedle UK Property Fund II - Threadneedle Investments
Threadneedle UK Property Fund II - Threadneedle Investments
Threadneedle UK Property Fund II - Threadneedle Investments

You also want an ePaper? Increase the reach of your titles
YUMPU automatically turns print PDFs into web optimized ePapers that Google loves.
Unaudited Interim Report and Accounts<br />
<strong>Threadneedle</strong> <strong>UK</strong> <strong>Property</strong> <strong>Fund</strong> <strong>II</strong><br />
June 2012<br />
<strong>Threadneedle</strong><br />
<strong>UK</strong> <strong>Property</strong> <strong>Fund</strong> <strong>II</strong><br />
threadneedle.com
<strong>Threadneedle</strong> <strong>UK</strong> <strong>Property</strong> <strong>Fund</strong> <strong>II</strong> Interim Report and Accounts 2012<br />
Contents<br />
Company Report<br />
Director’s Report 2<br />
Manager’s Report 3 – 5<br />
<strong>Property</strong> Portfolio<br />
Retail 6<br />
Retail Warehouse 7<br />
Offices 7<br />
Industrial 7<br />
<strong>Property</strong> in the course of development 7<br />
Financial Statements<br />
Statement of Total Return 8<br />
Statement of Change in Net Assets<br />
Attributable to Shareholders 8<br />
Additional Information<br />
Portfolio Statement 11<br />
Comparative Tables 12<br />
Total Expense Ratio Summary 12<br />
<strong>Property</strong> Expense Ratio Summary 12<br />
Company Performance Summary 13<br />
Share Turnover and Share Analysis 13<br />
Finance Costs: Distributions per Share 14<br />
AREF Compliance Checklist 15<br />
Further Information 16 – 17<br />
Management and Administration 18<br />
Important Information 19<br />
Balance Sheet 8<br />
Cash Flow Statement 8<br />
Directors’ Statement 8<br />
Distribution Table 9<br />
Notes to the Financial Statements 10<br />
1
<strong>Threadneedle</strong> <strong>UK</strong> <strong>Property</strong> <strong>Fund</strong> <strong>II</strong> Interim Report and Accounts 2012<br />
Director’s Report<br />
The Authorised Corporate Director (ACD), <strong>Threadneedle</strong><br />
Investment Services Limited has pleasure in presenting the<br />
Interim Report and Accounts for <strong>Threadneedle</strong> <strong>UK</strong> <strong>Property</strong><br />
<strong>Fund</strong> <strong>II</strong> (“the Company”) for the six months to 30th June 2012.<br />
We hope that you find the report informative. Should you<br />
require any further information regarding any aspect of your<br />
investment, or about other <strong>Threadneedle</strong> products, we would<br />
be pleased to help. Alternatively, you may find it helpful to visit<br />
threadneedle.com for further information about <strong>Threadneedle</strong>.<br />
Thank you for your continued support.<br />
Crispin Henderson<br />
Director<br />
2
<strong>Threadneedle</strong> <strong>UK</strong> <strong>Property</strong> <strong>Fund</strong> <strong>II</strong> Interim Report and Accounts 2012<br />
Manager’s Report<br />
Investment Objective<br />
The investment objective of the Company is to achieve longterm<br />
capital growth and income primarily through direct<br />
investment in, or exposure to, <strong>UK</strong> commercial property.<br />
Investment Policy<br />
The investment policy of the Company is to invest in <strong>UK</strong><br />
commercial properties (including shops, offices, retail<br />
warehouses, leisure and industrial units), as favourable<br />
investment opportunities arise.<br />
The Company may also invest in property related securities,<br />
regulated and unregulated collective investment schemes, debt<br />
instruments and other transferable securities to gain exposure<br />
to the <strong>UK</strong> and other property markets. In addition, the<br />
Company may invest in money market instruments, deposits<br />
and cash and near cash.<br />
Review<br />
This report covers the period from 1st January 2012 to<br />
30th June 2012.<br />
Market Commentary<br />
2011 saw no let-up in the tough economic back drop for<br />
business right across the <strong>UK</strong>, with significantly sub trend<br />
economic growth during the year of just 0.7%. Fluctuating<br />
degrees of uncertainty around the Eurozone have been and<br />
continue to be, a significant drag on the <strong>UK</strong> economy. The<br />
prospect of a breakup of the Eurozone is holding back business<br />
investment by cash rich corporates making credit difficult to<br />
obtain, limiting the export market for <strong>UK</strong> manufactured goods<br />
and negatively effecting overall sentiment. Unemployment has<br />
risen to 8.3%, its highest level since the early 1990’s. The <strong>UK</strong><br />
economy recorded negative GDP growth in the final quarter of<br />
2011, and the first quarter of 2012, meaning technically the <strong>UK</strong><br />
has entered recession again. This economic environment,<br />
coupled with the <strong>UK</strong> Government’s on-going policies aimed at<br />
tackling public sector debt have inevitably continued to temper<br />
both business expansion and consumer expenditure and<br />
therefore occupational demand. Whilst masking some regional<br />
and sector variances, occupation markets over the past year<br />
have generally been alive and functioning but not buoyant.<br />
Market wide rental value growth for the twelve months to the<br />
end of June 2012 has been 0.0%. Overall vacancy rates have<br />
also been broadly stable (the source of all market statistics in<br />
this section being the IPD <strong>UK</strong> Monthly Index). The one material<br />
exception to this general synopsis of occupational markets is<br />
the Central London office market. Modest supply, particularly<br />
in the West End, and a greater willingness amongst businesses<br />
to commit to new accommodation, has generated positive<br />
rental value growth in the central London office market of<br />
around 5%. A particularly positive feature of the commercial<br />
property sector over the past three years has been the<br />
generally robust nature of portfolio wide rental income flows. It<br />
has been estimated that from its peak in September 2008 to<br />
January 2012 the aggregate rental income generated by the<br />
portfolio that makes up the IPD <strong>UK</strong> monthly index fell by just<br />
2.2% (source: CBRE). This highlights one of the key positive<br />
characteristics of <strong>UK</strong> Real Estate as an asset class.<br />
When compared to alternative asset class pricing, such as <strong>UK</strong><br />
equities and Gilts, <strong>UK</strong> commercial property remains an<br />
attractive proposition and is considered to present fair value.<br />
Continued concerns over the Eurozone debt crisis, the impact<br />
of spending cuts in parts of the public sector and a lack of<br />
available debt, have combined to have a negative impact on<br />
the market and 2012 is set to continue in a similar vein to 2011.<br />
From an investor’s perspective, the twelve months to the end of<br />
June 2012 was a presentable period for the real estate sector,<br />
particularly when compared against the volatility across other<br />
investment sectors. Total returns over the period for the <strong>UK</strong><br />
commercial property market were 4.8%, ahead of the negative<br />
3.1% total return from <strong>UK</strong> equities, but behind the 16.1% total<br />
return achieved by the prolonged bull run in gilt markets. This<br />
property sector out-turn was entirely down to the sectors rental<br />
income return of 6.7%, with capital growth being negative at<br />
–1.9%. During the last eight months of this period, property<br />
investment yields have displayed a slight softening following a<br />
twenty-seven month period of month-on-month positive yield<br />
impacts. This is consistent with the unfavourable trend in the<br />
balance between active buyers and sellers in the <strong>UK</strong> property<br />
investment market, reflecting a back drop of less equity<br />
flowing into the market and an on-going desire amongst banks<br />
to decrease their real estate exposure.<br />
Although <strong>UK</strong> property fund inflows are currently at negligible<br />
levels, it is reported that, after record inflows in the period<br />
3Q09-4Q10, institutional investors still hold significant<br />
un-invested cash balances, but remain wedded to a cautious<br />
investment approach. Institutional investors seeking to exploit<br />
the property sector’s income yield advantage, relative to<br />
competing investment media, remain focussed upon the<br />
acquisition of core/core+ property assets, long-let to<br />
undoubted tenant covenants. Institutional investors currently<br />
have little appetite for entrepreneurial property risk.<br />
It is widely considered that, whilst values remain subdued<br />
outside of Central London, those investors with significant<br />
cash weightings continue to be in a privileged position to take<br />
advantage of comparatively low pricing on assets with robust<br />
underlying fundamentals.<br />
<strong>UK</strong> <strong>Property</strong> Market Performance –<br />
12 Months to 30th June 2012<br />
All Retail Office Industrial <strong>Property</strong><br />
Total Return 3.0% 6.4% 5.9% 4.8%<br />
Income Return 6.5% 6.6% 7.7% 6.7%<br />
Capital Growth -3.3% -0.2% -1.7% -1.9%<br />
Rental Value Growth -1.1% 1.6% -0.8% -0.1%<br />
Yield Impact -2.1% -0.5% -0.9% -1.3%<br />
Source: IPD <strong>UK</strong> Monthly Index June 2012<br />
3
<strong>Threadneedle</strong> <strong>UK</strong> <strong>Property</strong> <strong>Fund</strong> <strong>II</strong> Interim Report and Accounts 2012<br />
Manager’s Report<br />
(continued)<br />
As displayed in the table above, it was the office sector that<br />
generated the strongest total returns over the period,<br />
registering 6.4% and being the only sector with positive rental<br />
value movement. This was however very much a product of the<br />
relatively strong performance of the Central London submarket<br />
which produced total returns of 10.4%. The retail and industrial<br />
sectors both suffered negative rental value growth of –1.1%<br />
and –0.8% respectively, although the industrial sector’s higher<br />
income return resulted in it generating a total return of 5.9%<br />
compared to that of the retail sector of 3.0%.<br />
Market Outlook<br />
With GDP growth of 0.3% forecast, output levels in 2012 are<br />
predicted to be low. Such low growth and output will<br />
undoubtedly hold back expansion in the occupier markets,<br />
which, coupled with a lack of available debt, will also act to<br />
limit activity levels in the investment markets. The issue of<br />
forced disposals through legacy debt issues will also be<br />
prominent, as the <strong>UK</strong> banks look to further deleverage balance<br />
sheet exposure. Banks still have more than £210bn exposure to<br />
<strong>UK</strong> commercial property, with nearly a quarter of loans in<br />
breach of terms or default. More than half the debt has to be<br />
repaid by 2016 with approximately £50bn due to mature this<br />
year.<br />
With only modest inflows into <strong>UK</strong> pooled property funds and a<br />
dearth of debt finance to take its place, it has been no surprise<br />
that recent months have seen small incremental falls in<br />
property capital values across the market. Perceived volatility<br />
in the financial and economic environment, particularly centred<br />
around the Euro crisis, has not helped risk aversion amongst<br />
investors. We expect these dynamics to be an on-going feature<br />
of 2012, with investors in property benefiting from the sector’s<br />
solid income return but seeing this eaten into by modest<br />
negative capital value movements. Beyond this immediate<br />
outlook we remain of the view that prevailing property pricing<br />
does look logical and supportable over the longer term<br />
perspective, a time horizon that property investment, by its<br />
nature, demands.<br />
An eventual return to trend economic growth in the <strong>UK</strong> does<br />
present real upside for <strong>UK</strong> property markets, the majority of<br />
which have experienced a de minimus level of fresh<br />
construction activity for nearly half a decade. The Company is<br />
now experiencing a period of stability following a pronounced<br />
expansionary phase.<br />
Although <strong>UK</strong> property fund inflows are currently at negligible<br />
levels, it is reported that, after record inflows in the period<br />
3Q09-4Q10, institutional investors still hold significant<br />
un-invested cash balances, but remain wedded to a cautious<br />
investment approach. Institutional investors seeking to exploit<br />
the property sector’s income yield advantage, relative to<br />
competing investment media, remain focussed upon the<br />
acquisition of core/core+ property assets, long-let to<br />
undoubted tenant covenants. Institutional investors currently<br />
have little appetite for entrepreneurial property risk.<br />
The Portfolio<br />
The average weighted lease length across the entire portfolio<br />
of 12 properties and 14 tenancies is approximately 5 years,<br />
assuming all lease break options within the existing portfolio<br />
are exercised. The Company’s directly held property generates<br />
a combined net initial income yield of 6.4% a 10 basis point<br />
income yield advantage above the comparable (IPD Monthly<br />
Index) market yield.<br />
We have shown a sector breakdown of the portfolio below, which<br />
shows the Company’s position versus the IPD <strong>UK</strong> Monthly Index.<br />
Sector breakdown – as at 30th June 2012<br />
Company Index Active<br />
Retail Warehouses 18% 24% –6%<br />
Shops 47% 23% 24%<br />
Industrials 21% 17% 4%<br />
Offices 14% 31% –17%<br />
Other – 5% –5%<br />
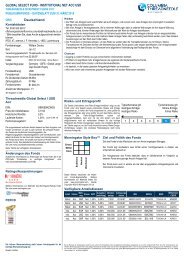
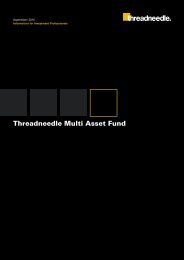
<strong>Property</strong> Type Overview<br />
47%<br />
Source: <strong>Threadneedle</strong><br />
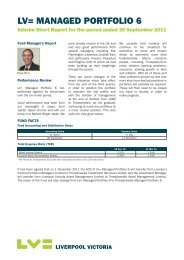
We have shown a sector breakdown of the portfolio below,<br />
illustrating the Company’s position versus the IPD <strong>UK</strong> Monthly<br />
Index.<br />
Sector Breakdown as at 30th June 2012<br />
50%<br />
45%<br />
40%<br />
35%<br />
30%<br />
25%<br />
20%<br />
15%<br />
10%<br />
5%<br />
0%<br />
Company<br />
Index<br />
Offices Shops Industrials Retail Other<br />
Warehouses<br />
Source: <strong>Threadneedle</strong>/IPD<br />
14%<br />
18%<br />
21%<br />
Offices<br />
Industrials<br />
Retail Warehouses<br />
Shops<br />
Other<br />
Income returns will form the core component of total returns<br />
over the next 5 years and capital value gain will have to be<br />
4
<strong>Threadneedle</strong> <strong>UK</strong> <strong>Property</strong> <strong>Fund</strong> <strong>II</strong> Interim Report and Accounts 2012<br />
Manager’s Report<br />
(continued)<br />
earned through hard won asset management initiatives, rather<br />
than demand and supply imbalances in the investment market.<br />
Whilst the Company’s current vacancy rate is 15.4% of the<br />
portfolio’s total rental value compared to 8.3% for the IPD <strong>UK</strong><br />
Monthly Index (reflecting the market overall) this will reduce to<br />
zero on completion of the Poyle development which has been<br />
pre-let in its entirety on a 15 year lease without break.<br />
Performance<br />
With reference to the Morningstar <strong>UK</strong> IMA OEIC Benchmark for<br />
Real Estate Trusts, since inception mid 2007, <strong>Threadneedle</strong> <strong>UK</strong><br />
<strong>Property</strong> <strong>Fund</strong> <strong>II</strong> is ranked fourteenth out of twenty eight to the<br />
30th June 2012. Index measures are provided for information,<br />
to demonstrate performance relative to peer groups. However,<br />
please be reminded that the Company is not managed with<br />
reference to any benchmark.<br />
Strategy<br />
<strong>Threadneedle</strong> Investment Services Ltd became the ACD of the<br />
Company on 1st December 2011 and subsequently reviewed<br />
the investment credentials of the underlying assets. A number<br />
of the assets having suffered a significant downward<br />
movement in rental value in line with the regional trend were<br />
deemed either ‘ex-growth’ or over-rented but with underlying<br />
investment fundamentals considered suitable for sale. Eleven<br />
properties were extensively marketed with limited investor<br />
interest for individual assets with the most attractive cash<br />
proposal being received by CBRE Global Investors proposing<br />
to acquire a portfolio of seven properties, subsequently named<br />
the Orchid Portfolio, on extremely competitive terms.<br />
climate has had a particularly detrimental impact on the retail<br />
sector exacerbated by weak consumer spending, negative GDP<br />
growth and numerous tenant failures on the <strong>UK</strong> high streets.<br />
<strong>Property</strong> Market Analysis (Spring 2012) forecasted negative IPD<br />
All <strong>Property</strong> Total Returns for 2012 of –0.8% with retail<br />
contributing a Total Return of –1.7% including capital value<br />
depreciation of –7.2%. The portfolio sale is therefore considered<br />
strategic in light of future market conditions. The sale price of<br />
£30,400,000 reflected a net initial yield of 6.8% but the portfolio<br />
was considered significantly over-rented with a reversionary<br />
yield of 5.9%.<br />
The remaining assets within the Company generally exhibit<br />
strong underlying investment credentials with numerous asset<br />
management opportunities and are considered more defensive<br />
in respect of anticipated short to medium term market<br />
conditions.<br />
Since the onset of the financial crisis in late 2007, prudent<br />
liquidity management has remained one of the hallmarks of<br />
the Manager’s long term strategy. With a market characterised<br />
by illiquidity those with immediate cash resources available<br />
will be best placed to take advantage of market conditions<br />
in 2012.<br />
Future purchasing activity will target mispriced risk, essentially<br />
higher yielding assets with strong underlying investment<br />
fundamentals both complement and enhance the Company’s<br />
income return.<br />
Transactions<br />
No purchases were completed in the period.<br />
The following aforementioned sale was completed in the<br />
period:<br />
June 2012<br />
Orchid Portfolio<br />
The portfolio comprised 7 properties; 4 high street retail<br />
properties, 1 retail warehouse (2 units), 1 industrial (2 units)<br />
and 1 car showroom let to a total of 9 tenants and generated<br />
£2,193,002 per annum against a current estimated rental value<br />
(31st May 2012 valuation) of £1,894,155. 70% of the portfolio<br />
income was derived from retail assets. The weak economic<br />
5
<strong>Threadneedle</strong> <strong>UK</strong> <strong>Property</strong> <strong>Fund</strong> <strong>II</strong> Interim Report and Accounts 2012<br />
<strong>Property</strong> Portfolio<br />
Retail<br />
Principal Rental Income Next Rent<br />
Between £1 million and £2.5 million in Value Tenants per annum Review<br />
Glasgow<br />
109-113 Sauchiehall Street<br />
Heritable mid terrace building comprising ground floor Everything Everywhere Limited £178,500 N/A<br />
retail unit with first and second floor ancillary<br />
accommodation. <strong>Property</strong> comprises 3,586 sq ft.<br />
Glasgow<br />
115 Sauchiehall Street<br />
Heritable end of terrace building comprising ground floor Redcastle Limited £128,500 N/A<br />
retail unit with basement ancillary accommodation.<br />
<strong>Property</strong> comprises 2,505 sq ft.<br />
Ilford<br />
123-125 High Road<br />
Freehold mid terrace building comprising ground floor Monsoon Accessorize Limited £193,000 N/A<br />
and part first floor retail unit with basement, part first<br />
and second floor ancillary accommodation.<br />
<strong>Property</strong> comprises 4,249 sq ft.<br />
Peterborough<br />
3 Cathederal Square<br />
Freehold end terrace building comprising ground floor HSBC Bank Plc £150,000 December 2012<br />
retail unit with basement, first and second floor ancillary<br />
accommodation. <strong>Property</strong> comprises 5,479 sq ft.<br />
Worcester<br />
35-36 High Street<br />
Freehold mid terrace building comprising ground and River Island Clothing Company £198,000 N/A<br />
first floor retail unit with second floor ancillary<br />
Limited<br />
accommodation. <strong>Property</strong> comprises 6,425 sq ft.<br />
Between £2.5 million and Principal Rental Income Next Rent<br />
£5 million in Value Tenants per annum Review<br />
Brighton<br />
30-31 Western Road<br />
Freehold mid terrace building comprising ground floor Ann Summers Limited £175,000 March 2014<br />
retail unit with basement and first floor ancillary<br />
accommodation and 4 self-contained residential units on<br />
second and third floors. <strong>Property</strong> comprises 4,454 sq ft.<br />
excluding flats.<br />
Nottingham<br />
28-30 Lister Gate<br />
Freehold mid terrace building comprising ground and first A Jones & Sons Limited £160,000 September 2016<br />
floor retail unit with second floor ancillary accommodation.<br />
<strong>Property</strong> comprises 4,921 sq ft.<br />
Reading<br />
9-10 Broad Street<br />
Freehold mid terrace building comprising ground floor East Limited £190,000 October 2013<br />
retail unit with first floor ancillary accommodation.<br />
<strong>Property</strong> comprises 3,050 sq ft.<br />
6
<strong>Threadneedle</strong> <strong>UK</strong> <strong>Property</strong> <strong>Fund</strong> <strong>II</strong> Interim Report and Accounts 2012<br />
<strong>Property</strong> Portfolio<br />
(continued)<br />
Retail Warehouse<br />
Retail Warehouse<br />
Principal Rental Income Next Rent<br />
Over £5 million in Value Tenants per annum Review<br />
Bury St. Edmunds<br />
46-48 Risbygate<br />
Freehold detached retail warehouse. B&Q Plc £491,763 N/A<br />
<strong>Property</strong> comprises 39,925 sq ft.<br />
Offices<br />
Offices<br />
Between £2.5 million and Principal Rental Income Next Rent<br />
£5 million in Value Tenants per annum Review<br />
London<br />
19 Buckingham Gate<br />
Freehold mid terrace office building arranged on The Communication Group Plc £286,630 June 2012<br />
lower ground, ground and five uppers floors.<br />
<strong>Property</strong> comprises 7,518 sq ft.<br />
Industrial<br />
Supermarket<br />
Between £2.5 million and Principal Rental Income Next Rent<br />
£5 million in Value Tenants per annum Review<br />
Crawley<br />
Manor Gate, Manor Royal<br />
Freehold terrace of three (units B-D) and single detached Presteigne Charter Limited £106,176 June 2016<br />
(unit A) industrial units. <strong>Property</strong> comprises 70,094 sq ft. Rossetts (Eastbourne) Limited £85,000 December 2012<br />
<strong>Property</strong> in the course of development<br />
Between £2.5 million and Principal Rental Income Next Rent<br />
£5 million in Value Tenants per annum Review<br />
Poyle<br />
Mathiesen Way<br />
Freehold 0.54 hectare development site. Proposed Pre-let to Kintetsu World N/A N/A<br />
development of circa 36,900 sq ft. warehouse and<br />
Express <strong>UK</strong> Limited<br />
ancillary offices.<br />
7
<strong>Threadneedle</strong> <strong>UK</strong> <strong>Property</strong> <strong>Fund</strong> <strong>II</strong> Interim Report and Accounts 2012<br />
Financial Statements<br />
STATEMENT OF TOTAL RETURN<br />
for the accounting period 1st January 2012 to 30th June 2012<br />
2012 2011<br />
£000 £000<br />
Income<br />
Net capital (losses)/gains (3,244) 1,668<br />
Revenue 2,285 2,473<br />
Expenses<br />
qqqqqqqqqqr<br />
(364) (631)<br />
Net revenue before taxation 1,921 1,842<br />
Taxation (386) (359)<br />
Net revenue after taxation<br />
qqqqqqqqqqr<br />
1,535 1,483<br />
Total return before distributions (1,709) 3,151<br />
Finance costs: distributions<br />
qqqqqqqqqqr<br />
(1,832) (1,935)<br />
Change in net assets attributable<br />
to shareholders from investment activities (3,541) 1,216<br />
zzzzzzzzzzzzzzz<br />
CASH FLOW STATEMENT<br />
for the accounting period 1st January 2012 to 30th June 2012<br />
December<br />
2012 2011<br />
£000 £000<br />
Net cash inflow from operating activities 1,638 3,369<br />
Corporation tax paid (416) (957)<br />
Income distributions (51) (35)<br />
Capital expenditure and financial investments:<br />
Purchase of investments – (1,362)<br />
Expenses paid from capital 40 (159)<br />
Disposal of investments<br />
qqqqqqqqqqr<br />
44,256 2,508<br />
44,296 987<br />
Financing:<br />
Amounts received on creation of shares 7,217 36,916<br />
Amounts paid on cancellation of shares<br />
qqqqqqqqqqr<br />
(9,871) (34,762)<br />
qqqqqqqqqqr<br />
(2,654) 2,154<br />
Increase in cash in the year 42,813 5,518<br />
zzzzzzzzzzzzzzz<br />
Reconciliation of net revenue to cash inflow<br />
from operating activities:<br />
Net revenue before taxation 1,921 3,827<br />
Decrease/(increase) in debtors 47 (395)<br />
Increase in creditors<br />
qqqqqqqqqqr<br />
(330) (63)<br />
Net cash inflow from operating activities 1,638 3,369<br />
zzzzzzzzzzzzzzz<br />
STATEMENT OF CHANGE IN NET ASSETS ATTRIBUTABLE<br />
TO SHAREHOLDERS<br />
for the accounting period 1st January 2012 to 30th June 2012<br />
2012 2011<br />
£000 £000<br />
Opening net assets attributable to shareholders 87,777 93,160<br />
Amounts receivable on creation of shares 7,596 15,218<br />
Less: Amounts payable on cancellation of shares (9,953) (11,300)<br />
(2,357) 3,918<br />
Stamp duty reserve tax (10) (11)<br />
Change in net assets attributable to shareholders<br />
from investment activities (see above) (3,541) 1,216<br />
Retained distribution on accumulation shares<br />
qqqqqqqqqqr<br />
1,762 1,922<br />
Closing net assets attributable to shareholders 83,631 100,205<br />
zzzzzzzzzzzzzzz<br />
AUTHORISED CORPORATE DIRECTOR’S STATEMENT<br />
In accordance with the requirements of the Financial Services<br />
Authority’s Collective Investment Schemes (COLL) Sourcebook, we<br />
hereby certify the Interim Report & Accounts on behalf of the Directors<br />
of <strong>Threadneedle</strong> Investment Services Limited.<br />
T N Gillbanks<br />
Director<br />
15th August 2012<br />
N J Ring<br />
Director<br />
The comparatives used within the Statement of Change in Net Assets Attributable to<br />
Shareholders are for the corresponding period of the previous year. Therefore the opening<br />
net assets attributable to shareholders for the current period are at 31st December 2011<br />
whilst the figure disclosed in the comparatives’ closing net assets attributable to<br />
shareholders is at 30th June 2011.<br />
BALANCE SHEET<br />
as at 30th June 2012<br />
December<br />
2012 2011<br />
Assets £000 £000<br />
Investment assets<br />
qqqqqqqqqqr<br />
34,950 81,215<br />
Debtors 1,053 1,133<br />
Cash and bank balances<br />
qqqqqqqqqqr<br />
49,783 6,970<br />
Total other assets<br />
qqqqqqqqqqr<br />
50,836 8,103<br />
Total assets<br />
qqqqqqqqqqr<br />
85,786 89,318<br />
Liabilities<br />
Creditors (2,115) (1,490)<br />
Distribution payable on income shares<br />
qqqqqqqqqqr<br />
(40) (51)<br />
Total liabilities<br />
qqqqqqqqqqr<br />
(2,155) (1,541)<br />
Net assets attributable to shareholders 83,631 87,777<br />
zzzzzzzzzzzzzzz<br />
8
<strong>Threadneedle</strong> <strong>UK</strong> <strong>Property</strong> <strong>Fund</strong> <strong>II</strong> Interim Report and Accounts 2012<br />
Financial Statements<br />
(continued)<br />
DISTRIBUTION TABLES<br />
for the accounting period 1st January 2012 to 30th June 2012<br />
Retail Accumulation Shares<br />
Distribution Net Distribution Distribution<br />
Period Revenue Equalisation Payable Paid<br />
2012 2011<br />
Group 1<br />
01/01/12 to 30/06/12 1.8160 – 1.8160 1.8637<br />
Group 2<br />
01/01/12 to 30/06/12 0.5330 1.2830 1.8160 1.8637<br />
Total Distributions in the period 1.8160 1.8637<br />
Second Retail Accumulation Shares<br />
Distribution Net Distribution Distribution<br />
Period Revenue Equalisation Payable Paid<br />
2012 2011<br />
Group 1<br />
01/01/12 to 30/06/12 2.1947 – 2.1947 2.2644<br />
Group 2<br />
01/01/12 to 30/06/12 0.8548 1.3399 2.1947 2.2644<br />
Total Distributions in the period 2.1947 2.2644<br />
Second Retail Income Shares<br />
Distribution Net Distribution Distribution<br />
Period Revenue Equalisation Payable Paid<br />
2012 2011<br />
Group 1<br />
01/01/12 to 30/06/12 1.9117 – 1.9117 2.0461<br />
Group 2<br />
01/01/12 to 30/06/12 0.6573 1.2544 1.9117 2.0461<br />
Total Distributions in the period 1.9117 2.0461<br />
Institutional Accumulation Shares<br />
Distribution Net Distribution Distribution<br />
Period Revenue Equalisation Payable Paid<br />
2012 2011<br />
Group 1<br />
01/01/12 to 30/06/12 1.8406 – 1.8406 1.8817<br />
Group 2<br />
01/01/12 to 30/06/12 0.7162 1.1244 1.8406 1.8817<br />
Total Distributions in the period 1.8406 1.8817<br />
Institutional Income Shares<br />
Distribution Net Distribution Distribution<br />
Period Revenue Equalisation Payable Paid<br />
2012 2011<br />
Group 1<br />
01/01/12 to 30/06/12 1.8304 – 1.8304 1.9542<br />
Group 2<br />
01/01/12 to 30/06/12 0.8573 0.9731 1.8304 1.9542<br />
Total Distributions in the period 1.8304 1.9542<br />
Group 2: Shares purchased during a distribution period.<br />
9
<strong>Threadneedle</strong> <strong>UK</strong> <strong>Property</strong> <strong>Fund</strong> <strong>II</strong> Interim Report and Accounts 2012<br />
Financial Statements<br />
(continued)<br />
Notes to the Financial Statements<br />
for the accounting period 1st January 2012 to 30th June 2012<br />
1 ACCOUNTING POLICIES<br />
(a) Basis of accounting<br />
The financial statements have been prepared under the historical<br />
cost basis, as modified by the revaluation of investments, and in<br />
accordance with the <strong>UK</strong> Generally Accepted Accounting Practice<br />
(“<strong>UK</strong>GAAP”), and the Statement of Recommended Practice (the<br />
“SORP”) for Financial Statements of Authorised <strong>Fund</strong>s, issued by<br />
the Investment Management Association (IMA) in October 2010.<br />
The accounting policies applied are consistent with those of the<br />
annual financial statements for the year ended 31st December 2011<br />
and are described in those financial statements.<br />
(b) Notes<br />
In accordance with the guidelines of the SORP, the Company has<br />
taken advantage of the facility not to provide further notes to the<br />
financial statements.<br />
10
<strong>Threadneedle</strong> <strong>UK</strong> <strong>Property</strong> <strong>Fund</strong> <strong>II</strong> Interim Report and Accounts 2012<br />
Additional Information<br />
Portfolio Statement<br />
as at 30th June 2012<br />
Holding or Market % of Net<br />
Nominal Value Asset<br />
Value Investment £000 Value<br />
DIRECT PROPERTY (41.79%, December 2011 – 78.00%)<br />
Car Showroom (0.00%, December 2011 – 7.29%)<br />
Industrial (5.36% December 2011 – 8.68%)<br />
Manor Gate, Manor Royal, Crawley 4,480 5.36<br />
zzzzzzzzzzzzzz<br />
Offices (5.89%, December 2011 – 5.61%)<br />
19 Buckingham Gate, London 4,925 5.89<br />
zzzzzzzzzzzzzz<br />
Retail (19.66%, December 2011 – 37.68%)<br />
9-10 Broad Street, Reading 2,750 3.29<br />
3 Cathedral Square, Peterborough 2,275 2.72<br />
123-125 High Road, Ilford 1,475 1.76<br />
35-36 High Street, Worcester 2,450 2.93<br />
28-30 Lister Gate, Nottingham 2,520 3.01<br />
109-113 Sauchiehall Street, Glasgow 1,350 1.61<br />
115 Sauchiehall Street, Glasgow 1,075 1.29<br />
30-31 Western Road, Brighton<br />
qqqqqqqqqqq<br />
2,550 3.05<br />
16,445 19.66<br />
zzzzzzzzzzzzzz<br />
Retail Warehouse (7.65%, December 2011 – 15.66%)<br />
Risbygate, Bury St. Edmunds 6,400 7.65<br />
zzzzzzzzzzzzzz<br />
Development Properties (3.23%, December 2011 – 3.08%)<br />
Mathisen Way, Poyle 2,700 3.23<br />
zzzzzzzzzzzzzz<br />
INDIRECT PROPERTY (0.00%, December 2011 – 14.52%)<br />
Financials (0.00%, December 2011 – 9.58%)<br />
Corporate Bond (0.00%, December 2011 – 4.94%)<br />
Market Value of <strong>Investments</strong><br />
(December 2011 – 92.52%) 34,950 41.79<br />
Net Other Assets (December 2011 – 7.48%)<br />
qqqqqqqqqqq<br />
48,681 58.21<br />
Net Assets 83,631 100.00<br />
zzzzzzzzzzzzzz<br />
All indirect property investments are admitted to official stock exchange listings<br />
unless otherwise stated.<br />
Unless otherwise stated, all direct properties are freehold or feuhold.<br />
The valuation of properties is reduced by the total of the unamortised capital<br />
contribution and any lease incentives in place at the time.<br />
11
<strong>Threadneedle</strong> <strong>UK</strong> <strong>Property</strong> <strong>Fund</strong> <strong>II</strong> Interim Report and Accounts 2012<br />
Additional Information<br />
(continued)<br />
The additional information provided in this section complies fully with the minimum and best practice guidelines as outlined in the<br />
Code of Practice (version November 2009) as issued by the Association of Real Estate <strong>Fund</strong>s. A table detailing the compliance with<br />
the guidelines can be found on page 15.<br />
Comparative Tables<br />
Net<br />
Net Asset<br />
Income<br />
Value No. of per Highest Lowest<br />
Net Asset pence per Shares Share Offer Bid<br />
Value (£) Share in Issue Calendar Year (pence) (pence)† (pence)†<br />
for the year ended 31st December 2009<br />
Retail Accumulation Shares 134,127 89.40 150,029<br />
Second Retail Accumulation Shares 1,009,089 109.01 925,691<br />
Second Retail Income Shares 1,034 103.40 1,000<br />
Institutional Accumulation Shares 71,515,663 89.88 79,568,264<br />
for the year ended 31st December 2010<br />
Retail Accumulation Shares 747,537 92.87 804,942<br />
Second Retail Accumulation Shares 3,972,975 112.77 3,522,977<br />
Second Retail Income Shares 541,834 101.44 534,157<br />
Institutional Accumulation Shares 87,835,954 93.65 93,787,541<br />
Institutional Income Shares 61,791 97.27 63,528<br />
for the year ended 31st December 2011<br />
Retail Accumulation Shares 294,283 86.02 342,095<br />
Second Retail Accumulation Shares 2,947,716 104.09 2,831,971<br />
Second Retail Income Shares 615,809 90.69 679,048<br />
Institutional Accumulation Shares 82,374,135 87.08 94,599,248<br />
Institutional Income Shares 1,545,183 86.68 1,782,653<br />
for the period ended 30th June 2012<br />
Retail Accumulation Shares 217,556 84.32 258,012<br />
Second Retail Accumulation Shares 2,349,072 101.83 2,306,839<br />
Second Retail Income Shares 317,794 86.79 366,153<br />
Institutional Accumulation Shares 79,263,264 85.49 92,714,179<br />
Institutional Income Shares 1,483,790 83.24 1,782,529<br />
Total Expense Ratio<br />
12<br />
2007<br />
1<br />
Retail Accumulation Shares – 100.75 98.17<br />
2<br />
Institutional Accumulation Shares – 100.74 98.17<br />
2008<br />
Retail Accumulation Shares 4.3440 98.53 88.55<br />
Institutional Accumulation Shares 4.5448 98.55 88.72<br />
2009<br />
Retail Accumulation Shares 2.3557 88.78 81.68<br />
3<br />
Second Retail Accumulation Shares 1.5375 106.07 99.74<br />
4<br />
Second Retail Income Shares – 100.55 100.00<br />
Institutional Accumulation Shares 2.6299 88.97 81.99<br />
2010<br />
Retail Accumulation Shares 3.6452 103.00 89.87<br />
Second Retail Accumulation Shares 4.3547 124.10 109.57<br />
Second Retail Income Shares 4.1790 117.50 103.89<br />
Institutional Accumulation Shares 3.7004 103.70 90.35<br />
5<br />
Institutional Income Shares 1.9591 109.80 101.90<br />
2011<br />
Retail Accumulation Shares 3.8209 105.60 84.01<br />
Second Retail Accumulation Shares 4.6469 126.90 101.70<br />
Second Retail Income Shares 4.1717 114.80 90.64<br />
Institutional Accumulation Shares 3.8746 106.80 85.02<br />
Institutional Income Shares 3.9946 110.40 86.60<br />
2012<br />
6<br />
Retail Accumulation Shares 1.8160 95.57 83.24<br />
6<br />
Second Retail Accumulation Shares 2.1947 114.40 100.60<br />
6<br />
Second Retail Income Shares 1.9117 99.71 87.62<br />
6<br />
Institutional Accumulation Shares 1.8406 96.77 84.35<br />
6<br />
Institutional Income Shares 1.8304 96.22 83.93<br />
†From 1st March 2010 the Company moved to dual pricing. Prior to this date the Company<br />
valued on a single price basis.<br />
1<br />
Retail Accumulation shares launched 7th September 2007.<br />
2<br />
Institutional Accumulation shares launched 7th September 2007.<br />
3<br />
Second Retail Accumulation shares launched 12th June 2009.<br />
4<br />
Second Retail Income shares launched 15th December 2009.<br />
5<br />
Institutional Income shares launched 29th June 2010.<br />
6<br />
To 30th June 2012.<br />
June<br />
December<br />
for the period ending 30th June 2012 2012* 2011<br />
Retail Accumulation Shares 1.12% 1.15%<br />
Second Retail Accumulation Shares 1.62% 1.65%<br />
Second Retail Income Shares 1.62% 1.65%<br />
Institutional Accumulation Shares 0.72% 0.75%<br />
Institutional Income Shares 0.72% 0.75%<br />
The Total Expense Ratios (TER) for the Company in this report have been prepared in accordance with the Financial Services<br />
Authority’s regulatory guidelines COLL 4 Annex 2.<br />
<strong>Property</strong> Expense Ratio<br />
June<br />
December<br />
for the period ending 30th June 2012 2012* 2011<br />
Retail Accumulation Shares 0.11% 0.32%<br />
Second Retail Accumulation Shares 0.11% 0.32%<br />
Second Retail Income Shares 0.11% 0.32%<br />
Institutional Accumulation Shares 0.11% 0.32%<br />
Institutional Income Shares 0.11% 0.32%<br />
A <strong>Property</strong> Expense Ratio (PER) is shown which takes into account expenses that are associated with the day to day maintenance of<br />
the property assets and excludes costs associated with operating the Company.<br />
*Annualised Ration
<strong>Threadneedle</strong> <strong>UK</strong> <strong>Property</strong> <strong>Fund</strong> <strong>II</strong> Interim Report and Accounts 2012<br />
Additional Information<br />
(continued)<br />
Company Performance Summary<br />
1st January 2012 to 1st July 2011 to 1st July 2010 to 1st July 2009 to<br />
30th June 2012 30th June 2012 30th June 2011 30th June 2010<br />
% % % %<br />
Retail Accumulation Shares –0.84 –11.67 2.53 12.68<br />
Second Retail Accumulation Shares –0.98 –11.93 2.04 12.39<br />
Second Retail Income Shares –3.28 –15.71 –0.16 N/A<br />
Institutional Accumulation Shares –0.67 –11.35 2.88 6.38<br />
Institutional Income Shares –2.94 –15.03 0.84 N/A<br />
<strong>UK</strong> IMA <strong>Property</strong> Median Performance 5.67 0.24 13.67 20.85<br />
(OEIC Benchmark for Real Estate Trusts)<br />
Source: <strong>Threadneedle</strong>. Bid to bid prices are quoted (i.e. Not including any initial charge) with net income reinvested for the <strong>UK</strong> basic rate tax payer. Performance<br />
data is quoted in pound sterling. OEIC Benchmark for Real Estate Trusts refers to the IPD <strong>UK</strong> Monthly Index since 30th September 2007.<br />
Share Turnover (all classes)<br />
Percentage Percentage<br />
of Total Net of Total Net<br />
Net Asset Value Asset Value of the Asset Value of the<br />
of Shares as at Company as at Company as at<br />
period end start of period end of period<br />
For the period ending 30th June 2012 Number of Shares (£) (%) (%)<br />
Share creations 8,717,920 7,483,420 8.53% 8.95%<br />
Share redemptions 11,525,223 9,893,195 11.27% 11.83%<br />
Share Analysis (all classes)<br />
Number of<br />
As at 30th June 2012 ownership band Shareholders % NAV<br />
Less than 1% of Shares in issue 27 3.52<br />
1% or greater but less than 2% 1 1.83<br />
2% or greater but less than 4% – –<br />
4% or greater but less than 8% 1 7.67<br />
Greater than 8% of shares in issuse 3 86.98<br />
Grand Total 32 100.00<br />
Total number of shares in issue 97,427,712<br />
Internal Investors –<br />
External Investors 100.00<br />
Total 100.00<br />
%<br />
Largest Investor 62.34<br />
Largest 3 Investors 86.98<br />
Largest 5 Investors 96.48<br />
Largest 10 Investors 99.06<br />
13
<strong>Threadneedle</strong> <strong>UK</strong> <strong>Property</strong> <strong>Fund</strong> <strong>II</strong> Interim Report and Accounts 2012<br />
Additional Information<br />
(continued)<br />
Finance Costs: Distributions per Share<br />
Yield on Yield on<br />
Opening Closing Distribution closing closing<br />
For the period ending offer price offer price accrued NAV price offer price<br />
30th June 2012 (pence) (pence) (pence) (%) (%)<br />
Retail Accumulation Shares 94.44 92.93 1.82 2.15 1.95<br />
Second Retail Accumulation Shares 113.20 111.20 2.19 2.16 1.97<br />
Second Retail Income Shares 98.59 96.82 1.91 2.20 1.97<br />
Institutional Accumulation Shares 95.59 94.22 1.84 2.15 1.95<br />
Institutional Income Shares 95.05 93.76 1.83 2.20 1.95<br />
14
<strong>Threadneedle</strong> <strong>UK</strong> <strong>Property</strong> <strong>Fund</strong> <strong>II</strong> Interim Report and Accounts 2012<br />
Additional Information<br />
(continued)<br />
AREF Compliance Checklist:<br />
AREF Code Requirements In Compliance If not in minimum Compliance<br />
– please state reason<br />
Governance of the Company A B<br />
1. Company Structure and Objectives ✔ ✔<br />
2. Management structure and accountability ✔ ✔<br />
3. Reporting ✔ ✔<br />
Operating the Company A B<br />
1. Valuations ✔ ✔<br />
2. Cash and Money Market Instruments ✔ ✔<br />
3. Gearing ✔ ✔<br />
4. Use of Derivatives ✔ ✔<br />
5. Distributions ✔ ✔<br />
6. Management Fees & other expenses ✔ ✔<br />
7. Insurance & Service Charge Rebates ✔ ✔<br />
8. Disaster Recovery ✔ ✔<br />
Share Dealing and Performance A B<br />
1. Dealing (subscriptions and redemptions) ✔ ✔<br />
2. Secondary Market ✔ ✔<br />
3. Share Turnover ✔ ✔<br />
4. Investor Analysis ✔ ✔<br />
5. Historical Performance ✔ ✔<br />
6. Benchmarks ✔ ✘ The Company’s benchmark is Morningstar. This<br />
provides a consistent and appropriate<br />
comparative measure for the Company.<br />
Company Classification OU Open Ended<br />
Key<br />
✔ In Compliance: A. Minimum. B. Best Practice.<br />
✘ Do not comply with AREF requirements in this area.<br />
15
<strong>Threadneedle</strong> <strong>UK</strong> <strong>Property</strong> <strong>Fund</strong> <strong>II</strong> Interim Report and Accounts 2012<br />
Additional Information<br />
(continued)<br />
Further Information<br />
Company<br />
The Company, an open-ended investment company with<br />
variable capital is a single fund. It is authorised and regulated<br />
by the Financial Services Authority, register number 190437<br />
with effect from 22 August 2007. Incorporated in England and<br />
Wales No. IC577. Head Office: 60 St Mary Axe, London,<br />
EC3A 8JQ.<br />
The ACD<br />
The ACD is the sole director of the Company and is responsible<br />
for all aspects of its administration and management. The ACD<br />
is <strong>Threadneedle</strong> Investment Services Limited which is<br />
authorised and regulated by the Financial Services Authority,<br />
register number 190437. The ACD is a member of the<br />
Investment Management Association. It is incorporated in<br />
England and Wales No. 03701768 and its registered office is<br />
60 St Mary Axe, London, EC3A 8JQ. Please note the<br />
administration address for all correspondence to the ACD is<br />
PO Box 10033, Chelmsford, CM99 2AL and its telephone<br />
number is 0845 113 0273 (calls may be recorded).<br />
The ultimate holding company of the ACD is Ameriprise<br />
Financial Inc., a corporation incorporated in Delaware, USA.<br />
The Depositary<br />
The Depositary acts as the custodian for all assets relating to<br />
the Company. The Depositary is J.P. Morgan Trustee and<br />
Depositary Company Limited, Chaseside, Bournemouth,<br />
Dorset, BH7 7DA. The Depositary is authorised and regulated<br />
by the Financial Services Authority.<br />
The Standing Independent Valuer<br />
The Standing Independent Valuer to the Company is Colliers<br />
International <strong>UK</strong> PIc. The Standing Independent Valuer is a<br />
private company limited by shares incorporated in England<br />
and Wales with registered number 4195561. The Standing<br />
Independent Valuer was appointed by an agreement between<br />
the ACD and the Standing Independent Valuer.<br />
The Standing Independent Valuer is responsible for valuing the<br />
immovable property (the real property) of the Company. The<br />
Standing Independent Valuer also acts as an appropriate valuer<br />
as referred to in the FSA Rules, when permitted to do so under<br />
the FSA Rules.<br />
Minimum Holdings and Transactions<br />
Monthly Lump Subsequent Minimum<br />
sum Investment Shareholding<br />
Retail Shares £100 £1,000 £500 £500<br />
Second Retail Shares £100 £1,000 £500 £500<br />
Institutional Shares – £500,000 £100,000 £100,000<br />
Subscription Days<br />
Shares may be purchased or sold on any business day. The<br />
price of shares is calculated daily. A forward pricing basis is<br />
used. Prices are published on our website (www.threadneedle<br />
.com) or can be obtained by telephone on 0845 113 0273. Calls<br />
may be recorded for training and monitoring purposes.<br />
Selling Shares<br />
Shareholders may offer all their shares for sale to the ACD.<br />
Alternatively, they may offer a lesser number for sale, provided<br />
they retain at least the minimum holding referred to opposite.<br />
All sale instructions must be made to the ACD in writing. The<br />
shares will be purchased from the shareholder at the next<br />
valuation point and a contract note confirming the sale will<br />
be sent.<br />
SDRT Provision<br />
SDRT is chargeable on the surrender (i.e. the redemption or<br />
switching of shares), and on certain transfers of shares in the<br />
funds. The current rate of SDRT is 0.5%.<br />
The liability for SDRT is calculated weekly by reference to<br />
share sales and repurchases in that and the following week but<br />
is reduced proportionately to the extent that the investments<br />
held by the fund are exempt investments, which essentially are<br />
any assets other than United Kingdom equities and other<br />
collective investment schemes that are not exempt from SDRT.<br />
Any fund which only invests in exempt investments, i.e. holds<br />
no United Kingdom equities, will therefore be wholly exempt<br />
from SDRT.<br />
How it affects shareholders and potential shareholders:<br />
The Authorised Corporate Director meets the SDRT liability<br />
from the property of the Company. It is not the ACD’s intention<br />
to require the payment of a further provision for SDRT,<br />
however, it reserves the right to do so in respect of large deals<br />
(as set out in the Prospectus).<br />
Income Equalisation<br />
When the first income distribution is received it may include an<br />
amount known as equalisation. The amount representing the<br />
income equalisation in the Share’s price is a return of capital<br />
and is not taxable in the hands of Shareholders. This amount<br />
should be deducted from the cost of Income Shares in<br />
computing capital gains realised on their disposal.<br />
Charges<br />
Certain charges are levied to cover the operating costs of the ACD.<br />
Initial Annual<br />
Charge Management<br />
Charge<br />
Retail Shares 5% 1.0%<br />
Second Retail Shares 4% 1.5%<br />
Institutional Shares 5% 0.6%<br />
16
<strong>Threadneedle</strong> <strong>UK</strong> <strong>Property</strong> <strong>Fund</strong> <strong>II</strong> Interim Report and Accounts 2012<br />
Additional Information<br />
(continued)<br />
An initial charge may be levied when Retail Shares or<br />
Institutional Shares are created, all or part of which may be<br />
waived at the discretion of the ACD.<br />
An annual management charge is also levied as a percentage<br />
of the Net Asset Value represented by relevant share class. In<br />
addition each <strong>Fund</strong> pays expenses for the professional services<br />
they receive such as safe custody, audit, regulatory and fund<br />
management advice. These charges are deducted daily from<br />
the capital of the <strong>Fund</strong>.<br />
Accumulation<br />
Revenue is accumulated by a transfer to the capital account of<br />
the Company on the day following the record date, being the<br />
last day in each accounting period.<br />
Reports<br />
The simplified short report is sent to all shareholders on a<br />
half-yearly basis. The full long form report and accounts are<br />
available on request from <strong>Threadneedle</strong> Investment Services<br />
Limited, PO Box 10033, Chelmsford, CM99 2AL.<br />
Prospectus<br />
Further details concerning the Company are contained in the<br />
Simplified Prospectus or Full Prospectus, which is available on<br />
request from the ACD.<br />
Application for Shares<br />
Your first investment into the Company must be made using<br />
our standard application form or by telephone. You can make<br />
additional investments by letter or telephone, provided you<br />
include your full name and investment details for registration<br />
purposes. Applications and additional investments can only be<br />
made by post to <strong>Threadneedle</strong> Investment Services Limited,<br />
PO Box 10033, Chelmsford, CM99 2AL. Applications will only<br />
be effective when they are received by us at the administration<br />
address above.<br />
Social Responsibility<br />
At <strong>Threadneedle</strong> we are active investors committed to<br />
maximising our investment returns though the pursuance of<br />
good governance and socially responsible investment<br />
practices. We are signatories to the United Nations Principles<br />
for Responsible Investment (UN PRI).<br />
We believe that the analysis of governance, social, ethical and<br />
environmental factors should be incorporated into stock<br />
selection to impact returns. Consequently, management of the<br />
risks and opportunities presented by these factors is integral to<br />
our investment decision-making process.<br />
Website Publication<br />
The financial statements are published at threadneedle.com,<br />
which is a website maintained by <strong>Threadneedle</strong> Investment<br />
Services Limited. The maintenance and integrity of the website<br />
maintained by <strong>Threadneedle</strong> Investment Services Limited, so far<br />
as it relates to the <strong>Threadneedle</strong> <strong>UK</strong> <strong>Property</strong> <strong>Fund</strong> <strong>II</strong>, is the<br />
responsibility of <strong>Threadneedle</strong> Investment Services Limited. The<br />
work carried out by the auditors does not involve consideration<br />
of the maintenance and integrity of this website and<br />
accordingly, the auditors accept no responsibility for any<br />
changes that have occurred to the financial statements since<br />
they were initially presented on the website. Visitors to the<br />
website need to be aware that legislation in the United Kingdom<br />
governing the preparation and dissemination of the financial<br />
statements may differ from legislation in their jurisdiction.<br />
Buying and selling shares – shares are bought or sold on your<br />
behalf in the Company on a forward pricing basis. This means,<br />
if we receive your full instructions in writing to invest, switch<br />
or cash in money before 2 p.m. on a business day, you will get<br />
the share price calculated that day. After 2 p.m. or on days<br />
which are not business days, you will get the price calculated<br />
on the next business day.<br />
17
<strong>Threadneedle</strong> <strong>UK</strong> <strong>Property</strong> <strong>Fund</strong> <strong>II</strong> Interim Report and Accounts 2012<br />
Additional Information<br />
(continued)<br />
Management and Administration<br />
Company<br />
<strong>Threadneedle</strong> <strong>UK</strong> <strong>Property</strong> <strong>Fund</strong> <strong>II</strong><br />
Registered Number IC577<br />
Registered Office<br />
60 St Mary Axe, London EC3A 8JQ<br />
Authorised Corporate Director (ACD)<br />
<strong>Threadneedle</strong> Investment Services Limited<br />
60 St Mary Axe, London EC3A 8JQ<br />
Chairman and Chief Executive<br />
C J Henderson<br />
Other Directors<br />
C D Fleming<br />
T N Gillbanks<br />
P J W Reed<br />
N J Ring<br />
Independent Auditors<br />
Ernst & Young LLP<br />
1 More London Place<br />
London<br />
SE1 2EF<br />
Depositary<br />
J.P. Morgan Trustee and Depositary Company Limited<br />
Chaseside<br />
Bournemouth<br />
BH7 7DA<br />
<strong>Property</strong> Manager<br />
Montagu Evans LLP<br />
Clarges House<br />
6-12 Clarges Street<br />
London<br />
W1J 8HB<br />
Customer Administration<br />
PO Box 10033<br />
Chelmsford<br />
CM99 2AL<br />
Please ensure all correspondence includes the full name of the<br />
registered holder and the account number. Telephone:<br />
+44 (0) 845 113 0273 (calls may be recorded for training and<br />
monitoring purposes).<br />
Registrar and Transfer Agency<br />
International Financial Data Services (<strong>UK</strong>) Limited<br />
IFDS House<br />
St Nicholas Lane<br />
Basildon<br />
SS15 5FS<br />
Investment Manager<br />
<strong>Threadneedle</strong> Asset Management Limited<br />
(Authorised and regulated by the<br />
Financial Services Authority (FSA))<br />
60 St Mary Axe<br />
London<br />
EC3A 8JQ<br />
Legal Advisers<br />
Eversheds LLP<br />
1 Wood Street<br />
London<br />
EC2V 7WS<br />
Standing Independent Valuer<br />
Colliers International <strong>UK</strong> Plc<br />
9 Marylebone Lane<br />
London<br />
W1U 1HL<br />
18
<strong>Threadneedle</strong> <strong>UK</strong> <strong>Property</strong> <strong>Fund</strong> <strong>II</strong> Interim Report and Accounts 2012<br />
Additional Information<br />
(continued)<br />
Important Information<br />
Past performance is not a guide to future performance.<br />
This material is for information only and does not constitute an<br />
offer or solicitation of an order to buy or sell any securities or<br />
other financial instruments, or to provide investment advice or<br />
services.<br />
Subscriptions to the Company may only be made on the basis<br />
of the current Prospectus and Simplified Prospectus, as well as<br />
the latest annual or interim reports, which can be obtained free<br />
of charge on request from the ACD.<br />
The research and analysis included in this document has been<br />
produced by <strong>Threadneedle</strong> <strong>Investments</strong> for its own investment<br />
management activities, may have been acted upon prior to<br />
publication and is made available here incidentally. Any<br />
opinions expressed are made as at the date of publication but<br />
are subject to change without notice. Information obtained<br />
from external sources is believed to be reliable but its accuracy<br />
or completeness cannot be guaranteed.<br />
Key Risks of the Company:<br />
Market Risk<br />
The value of investments can fall as well as rise and investors<br />
might not get back the sum originally invested, especially if<br />
investments are not held for the long term.<br />
Currency Risk<br />
Where investments are made in assets that are denominated in<br />
foreign currency, changes in exchange rates may affect the<br />
value of the investments.<br />
Liquidity Risk<br />
The Company invests in assets that are not always readily<br />
saleable without suffering a discount to fair value. The portfolio<br />
may have to lower the selling price, sell other investments or<br />
forego another, more appealing investment opportunity.<br />
Please refer to the ‘Risk Factors’ section of the Prospectus for<br />
all risks applicable to investing in the Company.<br />
19
<strong>Threadneedle</strong> Investment Services Limited, ISA Manager, Authorised Corporate Director and Unit Trust Manager. Registered No. 3701768. Registered in England and Wales.<br />
Registered Office: 60 St Mary Axe, London EC3A 8JQ. Authorised and regulated by the Financial Services Authority. <strong>Threadneedle</strong> <strong>Investments</strong> is a brand name and both the<br />
<strong>Threadneedle</strong> <strong>Investments</strong> name and logo are trademarks or registered trademarks of the <strong>Threadneedle</strong> group of companies. threadneedle.com