Threadneedle UK Property Fund II - Threadneedle Investments
Threadneedle UK Property Fund II - Threadneedle Investments
Threadneedle UK Property Fund II - Threadneedle Investments

Create successful ePaper yourself
Turn your PDF publications into a flip-book with our unique Google optimized e-Paper software.
<strong>Threadneedle</strong> <strong>UK</strong> <strong>Property</strong> <strong>Fund</strong> <strong>II</strong> Interim Report and Accounts 2012<br />
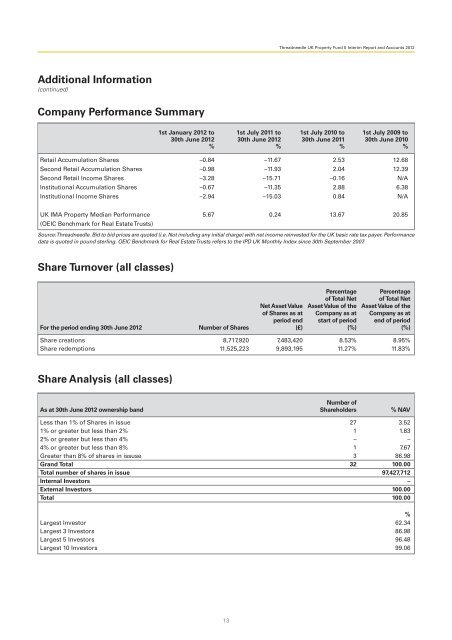
Additional Information<br />
(continued)<br />
Company Performance Summary<br />
1st January 2012 to 1st July 2011 to 1st July 2010 to 1st July 2009 to<br />
30th June 2012 30th June 2012 30th June 2011 30th June 2010<br />
% % % %<br />
Retail Accumulation Shares –0.84 –11.67 2.53 12.68<br />
Second Retail Accumulation Shares –0.98 –11.93 2.04 12.39<br />
Second Retail Income Shares –3.28 –15.71 –0.16 N/A<br />
Institutional Accumulation Shares –0.67 –11.35 2.88 6.38<br />
Institutional Income Shares –2.94 –15.03 0.84 N/A<br />
<strong>UK</strong> IMA <strong>Property</strong> Median Performance 5.67 0.24 13.67 20.85<br />
(OEIC Benchmark for Real Estate Trusts)<br />
Source: <strong>Threadneedle</strong>. Bid to bid prices are quoted (i.e. Not including any initial charge) with net income reinvested for the <strong>UK</strong> basic rate tax payer. Performance<br />
data is quoted in pound sterling. OEIC Benchmark for Real Estate Trusts refers to the IPD <strong>UK</strong> Monthly Index since 30th September 2007.<br />
Share Turnover (all classes)<br />
Percentage Percentage<br />
of Total Net of Total Net<br />
Net Asset Value Asset Value of the Asset Value of the<br />
of Shares as at Company as at Company as at<br />
period end start of period end of period<br />
For the period ending 30th June 2012 Number of Shares (£) (%) (%)<br />
Share creations 8,717,920 7,483,420 8.53% 8.95%<br />
Share redemptions 11,525,223 9,893,195 11.27% 11.83%<br />
Share Analysis (all classes)<br />
Number of<br />
As at 30th June 2012 ownership band Shareholders % NAV<br />
Less than 1% of Shares in issue 27 3.52<br />
1% or greater but less than 2% 1 1.83<br />
2% or greater but less than 4% – –<br />
4% or greater but less than 8% 1 7.67<br />
Greater than 8% of shares in issuse 3 86.98<br />
Grand Total 32 100.00<br />
Total number of shares in issue 97,427,712<br />
Internal Investors –<br />
External Investors 100.00<br />
Total 100.00<br />
%<br />
Largest Investor 62.34<br />
Largest 3 Investors 86.98<br />
Largest 5 Investors 96.48<br />
Largest 10 Investors 99.06<br />
13