Threadneedle UK Property Fund II - Threadneedle Investments
Threadneedle UK Property Fund II - Threadneedle Investments
Threadneedle UK Property Fund II - Threadneedle Investments

Create successful ePaper yourself
Turn your PDF publications into a flip-book with our unique Google optimized e-Paper software.
<strong>Threadneedle</strong> <strong>UK</strong> <strong>Property</strong> <strong>Fund</strong> <strong>II</strong> Interim Report and Accounts 2012<br />
Additional Information<br />
(continued)<br />
The additional information provided in this section complies fully with the minimum and best practice guidelines as outlined in the<br />
Code of Practice (version November 2009) as issued by the Association of Real Estate <strong>Fund</strong>s. A table detailing the compliance with<br />
the guidelines can be found on page 15.<br />
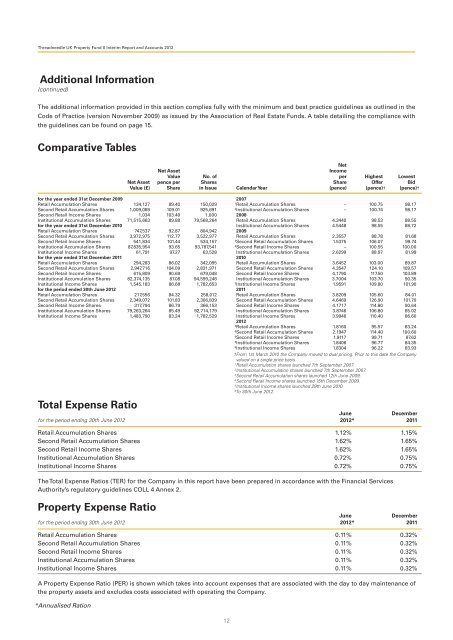
Comparative Tables<br />
Net<br />
Net Asset<br />
Income<br />
Value No. of per Highest Lowest<br />
Net Asset pence per Shares Share Offer Bid<br />
Value (£) Share in Issue Calendar Year (pence) (pence)† (pence)†<br />
for the year ended 31st December 2009<br />
Retail Accumulation Shares 134,127 89.40 150,029<br />
Second Retail Accumulation Shares 1,009,089 109.01 925,691<br />
Second Retail Income Shares 1,034 103.40 1,000<br />
Institutional Accumulation Shares 71,515,663 89.88 79,568,264<br />
for the year ended 31st December 2010<br />
Retail Accumulation Shares 747,537 92.87 804,942<br />
Second Retail Accumulation Shares 3,972,975 112.77 3,522,977<br />
Second Retail Income Shares 541,834 101.44 534,157<br />
Institutional Accumulation Shares 87,835,954 93.65 93,787,541<br />
Institutional Income Shares 61,791 97.27 63,528<br />
for the year ended 31st December 2011<br />
Retail Accumulation Shares 294,283 86.02 342,095<br />
Second Retail Accumulation Shares 2,947,716 104.09 2,831,971<br />
Second Retail Income Shares 615,809 90.69 679,048<br />
Institutional Accumulation Shares 82,374,135 87.08 94,599,248<br />
Institutional Income Shares 1,545,183 86.68 1,782,653<br />
for the period ended 30th June 2012<br />
Retail Accumulation Shares 217,556 84.32 258,012<br />
Second Retail Accumulation Shares 2,349,072 101.83 2,306,839<br />
Second Retail Income Shares 317,794 86.79 366,153<br />
Institutional Accumulation Shares 79,263,264 85.49 92,714,179<br />
Institutional Income Shares 1,483,790 83.24 1,782,529<br />
Total Expense Ratio<br />
12<br />
2007<br />
1<br />
Retail Accumulation Shares – 100.75 98.17<br />
2<br />
Institutional Accumulation Shares – 100.74 98.17<br />
2008<br />
Retail Accumulation Shares 4.3440 98.53 88.55<br />
Institutional Accumulation Shares 4.5448 98.55 88.72<br />
2009<br />
Retail Accumulation Shares 2.3557 88.78 81.68<br />
3<br />
Second Retail Accumulation Shares 1.5375 106.07 99.74<br />
4<br />
Second Retail Income Shares – 100.55 100.00<br />
Institutional Accumulation Shares 2.6299 88.97 81.99<br />
2010<br />
Retail Accumulation Shares 3.6452 103.00 89.87<br />
Second Retail Accumulation Shares 4.3547 124.10 109.57<br />
Second Retail Income Shares 4.1790 117.50 103.89<br />
Institutional Accumulation Shares 3.7004 103.70 90.35<br />
5<br />
Institutional Income Shares 1.9591 109.80 101.90<br />
2011<br />
Retail Accumulation Shares 3.8209 105.60 84.01<br />
Second Retail Accumulation Shares 4.6469 126.90 101.70<br />
Second Retail Income Shares 4.1717 114.80 90.64<br />
Institutional Accumulation Shares 3.8746 106.80 85.02<br />
Institutional Income Shares 3.9946 110.40 86.60<br />
2012<br />
6<br />
Retail Accumulation Shares 1.8160 95.57 83.24<br />
6<br />
Second Retail Accumulation Shares 2.1947 114.40 100.60<br />
6<br />
Second Retail Income Shares 1.9117 99.71 87.62<br />
6<br />
Institutional Accumulation Shares 1.8406 96.77 84.35<br />
6<br />
Institutional Income Shares 1.8304 96.22 83.93<br />
†From 1st March 2010 the Company moved to dual pricing. Prior to this date the Company<br />
valued on a single price basis.<br />
1<br />
Retail Accumulation shares launched 7th September 2007.<br />
2<br />
Institutional Accumulation shares launched 7th September 2007.<br />
3<br />
Second Retail Accumulation shares launched 12th June 2009.<br />
4<br />
Second Retail Income shares launched 15th December 2009.<br />
5<br />
Institutional Income shares launched 29th June 2010.<br />
6<br />
To 30th June 2012.<br />
June<br />
December<br />
for the period ending 30th June 2012 2012* 2011<br />
Retail Accumulation Shares 1.12% 1.15%<br />
Second Retail Accumulation Shares 1.62% 1.65%<br />
Second Retail Income Shares 1.62% 1.65%<br />
Institutional Accumulation Shares 0.72% 0.75%<br />
Institutional Income Shares 0.72% 0.75%<br />
The Total Expense Ratios (TER) for the Company in this report have been prepared in accordance with the Financial Services<br />
Authority’s regulatory guidelines COLL 4 Annex 2.<br />
<strong>Property</strong> Expense Ratio<br />
June<br />
December<br />
for the period ending 30th June 2012 2012* 2011<br />
Retail Accumulation Shares 0.11% 0.32%<br />
Second Retail Accumulation Shares 0.11% 0.32%<br />
Second Retail Income Shares 0.11% 0.32%<br />
Institutional Accumulation Shares 0.11% 0.32%<br />
Institutional Income Shares 0.11% 0.32%<br />
A <strong>Property</strong> Expense Ratio (PER) is shown which takes into account expenses that are associated with the day to day maintenance of<br />
the property assets and excludes costs associated with operating the Company.<br />
*Annualised Ration