Sources and Uses of Available Cost of Capital Data - Willamette ...
Sources and Uses of Available Cost of Capital Data - Willamette ...
Sources and Uses of Available Cost of Capital Data - Willamette ...

You also want an ePaper? Increase the reach of your titles
YUMPU automatically turns print PDFs into web optimized ePapers that Google loves.
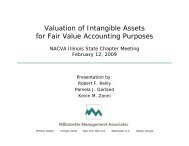
<strong>Sources</strong> <strong>and</strong> <strong>Uses</strong> <strong>of</strong><br />
<strong>Available</strong> <strong>Cost</strong> <strong>of</strong> <strong>Capital</strong> <strong>Data</strong><br />
American Institute <strong>of</strong> Certified Public Accountants<br />
<strong>Cost</strong> <strong>of</strong> <strong>Capital</strong> Webinar Series<br />
January 27, 2010<br />
Robert F. Reilly, CFA, CPA/ABV/CFF<br />
<strong>Willamette</strong> Management Associates<br />
rfreilly@willamette.com
<strong>Sources</strong> <strong>and</strong> <strong>Uses</strong> <strong>of</strong> <strong>Available</strong> <strong>Cost</strong> <strong>of</strong> <strong>Capital</strong> <strong>Data</strong><br />
Introduction <strong>and</strong> Discussion Outline<br />
• This is the first in a series <strong>of</strong> AICPA FVS cost <strong>of</strong> capital Webinar<br />
series presentations<br />
• This presentation is intended to be introductory in nature<br />
• This series will address cost <strong>of</strong> capital issues related to both valuation<br />
analyses <strong>and</strong> economic damages analyses<br />
• First, we will review six generally accepted cost <strong>of</strong> equity capital<br />
models<br />
• Second, we will consider the component data requirements for these<br />
cost <strong>of</strong> capital models<br />
• Third, we will review the data availability—<strong>and</strong> data limitations<br />
(including measurement differences)—<strong>of</strong> commonly used cost <strong>of</strong><br />
capital data sources.<br />
• Finally, we will consider these sources <strong>and</strong> uses <strong>of</strong> data from the<br />
perspective <strong>of</strong> the “top ten” issues related to the cost <strong>of</strong> capital data.<br />
2
Generally Accepted Models for<br />
Estimating the <strong>Cost</strong> <strong>of</strong> Equity <strong>Capital</strong><br />
The following generally accepted models are <strong>of</strong>ten<br />
used by both valuation analysts <strong>and</strong> damages<br />
analysts to estimate the cost <strong>of</strong> equity capital:<br />
– <strong>Capital</strong> asset pricing model<br />
– Modified capital asset pricing model<br />
– Build-up model<br />
– Dividend yield plus capital gain yield model<br />
– Arbitrage pricing theory model<br />
– Fama-French three-factor model<br />
3
<strong>Capital</strong> Asset Pricing Model<br />
The original CAPM univariate formula for estimating the<br />
cost <strong>of</strong> capital for a liquid, diversified equity security is<br />
presented as follows:<br />
Er = Rf + Bj (Rm − Rf)<br />
where:<br />
Er = cost <strong>of</strong> equity capital<br />
Rf = risk-free rate <strong>of</strong> return<br />
Rm = expected overall rate <strong>of</strong> return for a broad-based<br />
market portfolio <strong>of</strong> equity securities<br />
Bj = beta coefficient <strong>of</strong> the subject publicly traded equity<br />
security j<br />
4
Modified <strong>Capital</strong> Asset Pricing<br />
Model<br />
The generally accepted formula for the modified CAPM (or the<br />
MCAPM) is presented as follows:<br />
Er = Rf + Bj (Rm − Rf) + Sp + ά<br />
where:<br />
Er = cost <strong>of</strong> equity capital<br />
Rf = risk-free rate <strong>of</strong> return<br />
Bj = estimate <strong>of</strong> appropriate beta for the subject<br />
security j<br />
Rm − Rf = long-term equity risk premium (measurement <strong>of</strong><br />
the overall equity market risk)<br />
Sp = small stock equity risk premium<br />
ά = company-specific equity risk premium<br />
(measurement <strong>of</strong> other risk factors)<br />
5
Build-up Model<br />
The generally accepted formula for the build-up model is<br />
presented as follows:<br />
Er = Rf + (Rm − Rf) + Ip + Sp + ά<br />
where:<br />
Er = cost <strong>of</strong> equity capital<br />
Rf = risk-free rate <strong>of</strong> return<br />
Rm − Rf = long-term equity risk premium (measurement<br />
<strong>of</strong> the overall equity market risk)<br />
Ip = industry adjustment equity risk premium<br />
Sp = small stock equity risk premium<br />
ά = company-specific equity risk premium<br />
(measurement <strong>of</strong> other risk factors)<br />
6
Dividend Yield plus <strong>Capital</strong> Gain<br />
Yield Model<br />
The generally accepted formula for this cost <strong>of</strong> equity model (which is<br />
also called the DCF model) is presented as follows:<br />
which is simplified to:<br />
Er =<br />
d<br />
P<br />
1<br />
0<br />
P1<br />
− P0<br />
+<br />
P<br />
where: Er = cost <strong>of</strong> equity capital<br />
d 1 = the current period dividend payment*<br />
P 0 = the year ago stock/investment market price*<br />
P 1 = the current date stock/investment market price*<br />
g = the expected long-term growth rate*<br />
* for the subject publicly traded security or for a selected portfolio <strong>of</strong> guideline<br />
publicly traded securities<br />
0<br />
d1<br />
Er = + g<br />
P<br />
0<br />
7
Arbitrage Pricing Theory Model<br />
The basic regression formula for the APT model is<br />
presented as follows:<br />
Er = (b1)(x1) + (b2)(x2) + (b3)(x3) + . . . + (bn)(xn) + ά<br />
where:<br />
Er = cost <strong>of</strong> equity capital<br />
b1 to bn = the concluded regression coefficients<br />
x1 to xn = the selected microeconomic (i.e., financial<br />
fundamentals) <strong>and</strong>/or macroeconomic (i.e.,<br />
industry or general economy) variables<br />
ά = company-specific equity risk premium<br />
8
Fama-French Three-Factor Model<br />
The generally accepted formula for this cost <strong>of</strong> equity model is:<br />
Er = Rf + (B j ×ERP) + S j ×SMBP) + H j ×HMLP)<br />
where:<br />
Er = cost <strong>of</strong> equity capital<br />
Rf = risk-free rate <strong>of</strong> return<br />
B j = beta coefficient <strong>of</strong> publicly traded security j<br />
ERP = long-term equity risk premium<br />
S j = small-minus-big coefficient in the Fama-French regression equation<br />
SMBP = expected small-minus-big equity risk premium<br />
H j = high-minus-low coefficient in the Fama-French regression equation<br />
HMLP = expected high-minus-low equity risk premium<br />
9
Top Ten Issues Related to the<br />
Selection <strong>of</strong> <strong>Cost</strong> <strong>of</strong> <strong>Capital</strong> <strong>Data</strong><br />
• Risk-free rate <strong>of</strong> return measurement<br />
• Appropriate historical time period for the equity risk<br />
premium<br />
• Size effect equity risk premium measurement<br />
• Beta measurement—levered or unlevered<br />
• Beta measurement—appropriate market proxy<br />
• Beta measurement—appropriate time period<br />
• Beta measurement—appropriate frequency <strong>of</strong> data<br />
observations<br />
• Beta measurement—appropriate adjustment factors<br />
• Industry equity risk premium measurement<br />
• Company-specific equity risk premium measurement<br />
10
Risk-Free Rate <strong>of</strong> Return<br />
Estimation<br />
• Analysts <strong>of</strong>ten use the yield to maturity on long-term<br />
(usually 20-year) Treasury bonds as <strong>of</strong> the valuation<br />
date, as a proxy for the risk-free rate.<br />
• The source <strong>of</strong> these data is www.federalreserve.gov.<br />
• Treasury bond yields compensate bond holders for<br />
“renting” out their money <strong>and</strong> for the expected loss <strong>of</strong><br />
purchasing power (i.e., inflation) during the bond<br />
holding period.<br />
• The term <strong>of</strong> the Treasury bonds used to estimate Rf<br />
should be consistent with the measurement <strong>of</strong> the<br />
general equity risk premium.<br />
11
Risk-Free Rate <strong>of</strong> Return<br />
Estimation (cont.)<br />
• 20-year Treasury bond yields did decrease materially<br />
since October 2008, but they are now increasing.<br />
Yield on 20-year (constant maturity) T-bonds<br />
2004 Average for 12 months 5.02%<br />
2005 Average for 12 months 4.62%<br />
2006 Average for 12 months 4.98%<br />
2007 Average for 12 months 4.87%<br />
2008 Average - first 8 months 4.52%<br />
2008 September 30 4.43%<br />
2008 October 31 4.78%<br />
2008 November 30 3.72%<br />
2008<br />
2009<br />
2009<br />
2009<br />
December 31<br />
June 30<br />
September 30<br />
December 31<br />
3.03%<br />
4.30%<br />
4.02%<br />
4.58%<br />
12
Risk-Free Rate <strong>of</strong> Return<br />
Estimation (cont.)<br />
• It is unlikely that the 2008 decrease in the 20-year Treasury<br />
bond yield was due primarily to a decrease in inflation<br />
expectations.<br />
• That decrease in yields is more likely a reflection <strong>of</strong> the “flight<br />
to quality” witnessed in financial markets as investors moved<br />
from risky assets into “risk-free” assets. That decrease in the<br />
Rf appears to have been a short-term aberration.<br />
• During a recession, the use <strong>of</strong> a spot yield on Treasury bonds<br />
may cause analysts to underestimate a subject company’s<br />
actual cost <strong>of</strong> capital.<br />
• As alternatives in a recession, analysts may elect to use (1) a<br />
longer-term average Treasury yield or (2) a forward rate <strong>of</strong><br />
Treasury securities.<br />
13
General Equity Risk Premium<br />
Differences<br />
Appropriate Historical Time Period<br />
• Morningstar (Ibbotson) Stocks, Bonds, Bills <strong>and</strong> Inflation<br />
Valuation Yearbook (SBBI) uses the time period <strong>of</strong> 1926<br />
to the present to calculate the general equity risk<br />
premium. The Center for Research in Security Prices<br />
(the original source for these data) selected 1926 as the<br />
starting date for several reasons:<br />
– Quality financial data became available beginning about 1926<br />
– One full business cycle <strong>of</strong> data is included before the stock<br />
market crash <strong>of</strong> 1929<br />
– A conscious effort was made to include the period <strong>of</strong> extreme<br />
market volatility in the 1920s <strong>and</strong> 1930s<br />
14
General Equity Risk Premium Differences (cont.)<br />
Appropriate Historical Time Period<br />
• The Duff & Phelps, LLC, Risk Premium<br />
Report uses the time period <strong>of</strong> 1963 to the<br />
present to calculate the historical sizeadjusted<br />
equity risk premiums.<br />
• Duff & Phelps uses the St<strong>and</strong>ard & Poor’s<br />
Compustat data in addition to the CSRP<br />
data, <strong>and</strong> Compustat was established in<br />
1963.<br />
15
General Equity Risk Premium Differences (cont.)<br />
Incorporating the size effect equity risk premium:<br />
• Morningstar (Ibbotson) SBBI provides data<br />
regarding the difference between (1) the total<br />
equity risk premium returns for all public<br />
companies <strong>and</strong> (2) the equity risk premium<br />
returns realized by smaller, more thinly<br />
capitalized companies.<br />
• SBBI disaggregates the NYSE/AMEX/Nasdaq<br />
into ten size deciles based on market<br />
capitalization.<br />
• The size-related equity risk premium can then be<br />
added to the overall equity risk premium.<br />
16
General Equity Risk Premium Differences (cont.)<br />
Incorporating the size effect risk premium (cont.)<br />
• Duff & Phelps, LLC, uses eight different<br />
measures <strong>of</strong> size, including these fundamental<br />
financial characteristics: market value <strong>of</strong> equity,<br />
book value <strong>of</strong> equity, market value <strong>of</strong> invested<br />
capital, 5-year average net income, total assets,<br />
5-year average EBITDA, sales, <strong>and</strong> number <strong>of</strong><br />
employees.<br />
• The Duff & Phelps Risk Premium Report presents<br />
a smoothed average historical equity risk<br />
premium for each size category.<br />
17
General Equity Risk Premium Differences (cont.)<br />
18
General Equity Risk Premium Differences (cont.)<br />
Duff & Phelps, LLC Risk Premium Report Illustrative Example (cont.)<br />
19
General Equity Risk Premium Differences (cont.)<br />
Illustration <strong>of</strong> Duff & Phelps, LLC Risk Premium Report<br />
20
General Equity Risk Premium Differences (cont.)<br />
Duff & Phelps, LLC Risk Premium Report Illustrative Example<br />
21
Beta—Use <strong>of</strong> Levered or<br />
Unlevered Beta?<br />
• Levered beta—measures the systematic risk for<br />
the equity shareholders <strong>of</strong> the company. It<br />
incorporates both the business <strong>and</strong> financing<br />
risk undertaken by the company <strong>and</strong> borne by<br />
the equity shareholders.<br />
• Unlevered beta—also called an “asset beta”—<br />
removes the company’s financing decision from<br />
the beta calculation <strong>and</strong> reflects only the<br />
company business risk.<br />
22
Unlevered Beta<br />
The generally accepted formula for unlevering a<br />
beta is presented as follows:<br />
β<br />
Ui<br />
=<br />
βLi<br />
Di<br />
1+<br />
(1 − ti<br />
)<br />
E<br />
where:<br />
i<br />
β Ui = the unlevered beta for company i<br />
β Li = the levered beta for company i<br />
D i = total debt capitalization for company i<br />
E i = total equity capitalization for company i<br />
t i = marginal income tax rate for company i<br />
23
Relevered Beta<br />
• The unlevered beta can then be relevered<br />
using either (1) the subject company’s<br />
actual capital structure or (2) an industryaverage<br />
capital structure.<br />
• The generally accepted formula for<br />
revering a beta is presented as follows:<br />
⎡ Di<br />
⎤<br />
β<br />
Li<br />
= βUi<br />
⎢1 + (1 − ti)<br />
⎥<br />
⎣ Ei<br />
⎦<br />
24
Beta—Common <strong>Sources</strong> <strong>of</strong> Beta <strong>Data</strong><br />
• Bloomberg<br />
• Compustat<br />
• <strong>Capital</strong> IQ<br />
• ValueLine<br />
• Morningstar (Ibbotson) Beta Book<br />
• Morningstar (Ibbotson) <strong>Cost</strong> <strong>of</strong> <strong>Capital</strong><br />
Book (for industry betas)<br />
• the Barra Beta Book<br />
25
Beta—Common <strong>Sources</strong> <strong>of</strong> <strong>Data</strong>—Bloomberg<br />
26
Beta—Common <strong>Sources</strong> <strong>of</strong> <strong>Data</strong>—Bloomberg<br />
27
Beta—Common <strong>Sources</strong> <strong>of</strong> <strong>Data</strong>—Compustat<br />
28
Beta—Common <strong>Sources</strong> <strong>of</strong> <strong>Data</strong>—<strong>Capital</strong> IQ<br />
29
Beta—Common <strong>Sources</strong> <strong>of</strong> <strong>Data</strong>—ValueLine<br />
30
Beta—Common <strong>Sources</strong> <strong>of</strong> <strong>Data</strong>—<br />
Morningstar (<strong>Cost</strong> <strong>of</strong> <strong>Capital</strong> Book)<br />
31
Beta—Common <strong>Sources</strong> <strong>of</strong> <strong>Data</strong>—Barra Beta<br />
Book<br />
32
Differences in the Various Beta<br />
<strong>Data</strong> <strong>Sources</strong><br />
Measurement <strong>of</strong> the Market Proxy<br />
• Bloomberg allows for the selection <strong>of</strong> over 20<br />
domestic series (the default is the S&P 500)<br />
• Compustat uses the S&P 500<br />
• <strong>Capital</strong> IQ allows for the selection <strong>of</strong> 8 domestic<br />
series (the default is the S&P 500)<br />
• Morningstar (Ibbotson) uses the S&P 500<br />
• ValueLine uses the NYSE Composite Series<br />
• Barra Beta Book calculates predicted betas<br />
(forward-looking)<br />
33
Differences in the Various Beta<br />
<strong>Data</strong> <strong>Sources</strong> (cont.)<br />
Beta Measurement Time Period<br />
• Bloomberg time period is adjustable (the<br />
default is two years)<br />
• Compustat uses five years<br />
• <strong>Capital</strong> IQ time period is adjustable (the<br />
default is two years)<br />
• Morningstar (Ibbotson) uses five years<br />
• ValueLine uses five years<br />
34
Differences in the Various Beta<br />
<strong>Data</strong> <strong>Sources</strong> (cont.)<br />
Frequency <strong>of</strong> the <strong>Data</strong> Observations<br />
• Bloomberg is adjustable (the default is<br />
weekly)<br />
• Compustat is monthly<br />
• <strong>Capital</strong> IQ has a choice <strong>of</strong> either weekly or<br />
monthly (the default is weekly)<br />
• Morningstar (Ibbotson) is monthly<br />
• ValueLine is weekly<br />
35
Differences in the Various Beta<br />
<strong>Data</strong> <strong>Sources</strong> (cont.)<br />
Beta Normalization Adjustment Factors<br />
• Bloomberg is (0.67 × unadjusted beta) + (0.33<br />
×1.0)<br />
• Compustat is unadjusted<br />
• <strong>Capital</strong> IQ is unadjusted<br />
• Morningstar (Ibbotson) is adjusted toward the<br />
peer group beta weighted by the statistical<br />
significance<br />
• ValueLine is 0.35 + (0.67 × unadjusted beta)<br />
36
Industry Equity Risk Premium<br />
• Industry risk can be incorporated into the<br />
modified CAPM or the build-up model<br />
• Industry risk can be incorporated through the<br />
beta in the modified CAPM model<br />
• Industry betas can be found in the Morningstar<br />
(Ibbotson) <strong>Cost</strong> <strong>of</strong> <strong>Capital</strong> Yearbook. The<br />
Yearbook provides a levered raw beta, an<br />
adjusted beta, <strong>and</strong> an unlevered adjusted beta<br />
for numerous industries.<br />
37
Industry Equity Risk Premium (cont.)<br />
• In the build-up model, the industry risk premium can be<br />
incorporated using the Morningstar Stocks, Bonds, Bills<br />
<strong>and</strong> Inflation Valuation Yearbook.<br />
• The industry equity risk premium has been published in<br />
SBBI since 2000.<br />
• The criteria used to select companies for inclusion in the<br />
SBBI industry risk premium calculation are:<br />
– At least 36 months <strong>of</strong> return data available.<br />
– Sales greater than $1 million.<br />
– Market capitalization equal to or greater than $10,000.<br />
• An industry must have at least five companies that meet<br />
the above criteria in order to be included in SBBI.<br />
38
Industry Equity Risk Premium (cont.)<br />
Illustrative Morningstar Industry Risk Premium <strong>Data</strong><br />
39
Company-Specific Equity Risk<br />
Premium<br />
• The company-specific risk premium is typically<br />
estimated by the analyst using his or her<br />
pr<strong>of</strong>essional judgment.<br />
• There are, however, several sets <strong>of</strong> “factors” that<br />
the analyst may consider when estimating the<br />
company-specific equity risk premium:<br />
– the Black/Green factors<br />
– the Warren Miller factors<br />
– the Gary Trugman factors<br />
40
Company-Specific Risk Premium (cont.)<br />
Black/Green Factors<br />
Parnell Black <strong>and</strong> Robert Green (<strong>of</strong> Black/Green &<br />
Company) have suggested a set <strong>of</strong> CSRP factors for<br />
the valuation analyst’s consideration. The various<br />
Black/Green CSRP factors are summarized in the<br />
following six categories:<br />
– competition<br />
– financial strength<br />
– management ability <strong>and</strong> depth<br />
– pr<strong>of</strong>itability <strong>and</strong> stability <strong>of</strong> earnings<br />
– national economic effects<br />
– local economic effects<br />
41
Company-Specific Risk Premium (cont.)<br />
Warren Miller Factors<br />
Warren Miller (<strong>of</strong> Beckmill Research) has suggested a<br />
competitive advantage/strategic analysis structure for estimating<br />
the appropriate CSRP. Miller groups into three categories the<br />
CSRP factors to be considered in a strength, weaknesses,<br />
opportunities, <strong>and</strong> threats (SWOT) analysis. These three<br />
categories <strong>of</strong> SWOT-related factors are based on the groundbreaking<br />
strategic planning <strong>and</strong> analysis work <strong>of</strong> Michael E.<br />
porter. Miller’s three categories <strong>of</strong> individual CSRP factors are as<br />
follows:<br />
– macroenvironmental<br />
– industry<br />
– company<br />
42
Company-Specific Risk Premium (cont.)<br />
Warren Miller Factors (cont.)<br />
Within the general framework <strong>of</strong> Porter’s<br />
competitive strategy analysis, the Miller<br />
macroenvironmental considerations include<br />
the following individual factors:<br />
– economic<br />
– political<br />
– international<br />
– demographic<br />
– technological sociocultural<br />
43
Company-Specific Risk Premium (cont.)<br />
Warren Miller Factors (cont.)<br />
Miller also suggests that the analyst study the<br />
subject corporation’s competitive position<br />
within the subject industry. The Miller industry<br />
considerations include the following factors:<br />
– defining the industry<br />
– determining market structure<br />
– estimating relative market shares<br />
– applying the Michael Porter “five-forces<br />
framework”<br />
44
Company-Specific Risk Premium (cont.)<br />
Gary Trugman Factors<br />
Trugman presents three categories <strong>of</strong> individual<br />
CSRP factors. Trugman’s first category <strong>of</strong> CSRP<br />
considerations relates to the following risk factors:<br />
1. economy risk<br />
2. operating risk<br />
3. asset risk<br />
4. market risk<br />
5. regulatory risk<br />
6. business risk<br />
7. financial risk<br />
8. product risk<br />
9. technological risk<br />
10. legal risk<br />
45
Company-Specific Risk Premium (cont.)<br />
Gary Trugman Factors (cont.)<br />
Trugman’s second category <strong>of</strong> CSRP<br />
considerations relates to the following nonfinancial<br />
factors:<br />
– economic conditions<br />
– location <strong>of</strong> business<br />
– depth <strong>of</strong> management<br />
– barriers to entry into market<br />
– industry conditions<br />
– competition<br />
– quality <strong>of</strong> management<br />
46
Company-Specific Risk Premium (cont.)<br />
Gary Trugman Factors (cont.)<br />
Trugman’s third category <strong>of</strong> CSRP considerations<br />
relates to the following company-specific factors:<br />
– economic conditions<br />
– location <strong>of</strong> business<br />
– depth <strong>of</strong> management<br />
– barriers to entry into market<br />
– industry conditions<br />
– competition<br />
– quality <strong>of</strong> management<br />
– the bottom line<br />
47
Company-Specific Risk Premium (cont.)<br />
The Butler-Pinkerton Framework<br />
• Peter Butler <strong>and</strong> Keith Pinkerton (<strong>of</strong> Hooper Cornell PLLC) have suggested<br />
that the CSRP for a publicly traded corporation can be estimated more<br />
quantitatively.<br />
• They suggest measuring (1) the total risk <strong>of</strong> a publicly traded company based<br />
upon the fluctuation <strong>of</strong> its trading price <strong>and</strong> (2) that company’s beta.<br />
• The difference between the two measurements includes (1) the subject<br />
publicly traded company size premium <strong>and</strong> (2) the subject publicly traded<br />
company CSRP.<br />
• Subtracting the public company size premium from the total public company<br />
nonsystematic risk results in an estimate <strong>of</strong> the subject public company’s<br />
CSRP.<br />
• Butler <strong>and</strong> Pinkerton suggest that by analyzing the CSRP <strong>of</strong> guideline publicly<br />
traded companies in this way, the valuation analyst can be more specific<br />
about the size <strong>of</strong> the CSRP to apply to the valuation <strong>of</strong> privately held<br />
companies.<br />
48
Generally Accepted <strong>Sources</strong> <strong>of</strong><br />
<strong>Cost</strong> <strong>of</strong> <strong>Capital</strong> <strong>Data</strong><br />
• Federal Reserve, www.federalreserve.gov (for the riskfree<br />
rate)<br />
• Ibbotson Stocks, Bonds, Bills <strong>and</strong> Inflation Valuation<br />
Yearbook (Chicago: Morningstar, Inc., annual),<br />
global.morningstar.com/SBBIYearbooks (general equity<br />
risk premium, industry premiums, size premiums, et al.)<br />
• Duff & Phelps, LLC, Risk Premium Report (Chicago:<br />
Duff & Phelps, LLC, annual), www.bvmarketdata.com<br />
(size-adjusted equity risk premiums)<br />
• Ibbotson <strong>Cost</strong> <strong>of</strong> <strong>Capital</strong> Yearbook (Chicago:<br />
Morningstar, Inc., annual with quarterly updates),<br />
global.morningstar.com/C<strong>of</strong>CYrBk (industry betas,<br />
expected growth rates, et al.)<br />
49
Generally Accepted <strong>Sources</strong> <strong>of</strong><br />
<strong>Cost</strong> <strong>of</strong> <strong>Capital</strong> <strong>Data</strong> (cont.)<br />
• Bloomberg database, www.bloomberg.com<br />
(betas, company earnings estimates, et al.)<br />
• <strong>Capital</strong> IQ database, www.capitaliq.com (betas,<br />
Reuters earnings estimates, et al.)<br />
• Compustat database, www.compustat.com<br />
(betas)<br />
• ValueLine Investment Survey,<br />
www.valueline.com (betas, company earnings<br />
estimates, et al.)<br />
• Barra Beta Books, www.barra.com or<br />
www.alacra.com<br />
50
Generally Accepted <strong>Sources</strong> <strong>of</strong><br />
<strong>Cost</strong> <strong>of</strong> <strong>Capital</strong> <strong>Data</strong> (cont.)<br />
• International <strong>Cost</strong> <strong>of</strong> <strong>Capital</strong> (Chicago:<br />
Morningstar, Inc., annual)<br />
www.global.morningstar.com/<strong>Data</strong>Publications<br />
(international cost <strong>of</strong> capital data, country risk<br />
premiums)<br />
• International Equity Risk Premia Report<br />
(Chicago: Morningstar, Inc., annual),<br />
www.global.morningstar.com/<strong>Data</strong>Publications<br />
(equity risk premiums for individual countries)<br />
51
Morningstar—International Equity<br />
Risk Premia Report<br />
52
Morningstar—International <strong>Cost</strong> <strong>of</strong> <strong>Capital</strong> Report<br />
53
<strong>Sources</strong> <strong>and</strong> <strong>Uses</strong> <strong>of</strong> <strong>Available</strong> <strong>Cost</strong> <strong>of</strong><br />
<strong>Capital</strong> <strong>Data</strong><br />
Summary <strong>and</strong> Conclusion<br />
• This is the first in a series <strong>of</strong> AICPA FVS cost <strong>of</strong> capital<br />
Webinar series presentations.<br />
• Both valuation analysts <strong>and</strong> damages analysts should be<br />
familiar with the various sources <strong>of</strong> data that may be<br />
used for estimating the various cost <strong>of</strong> capital<br />
components.<br />
• Analysts should know the differences between these<br />
generally accepted sources <strong>of</strong> data—in order to select<br />
the best source <strong>of</strong> data for the particular subject<br />
valuation or damages analysis.<br />
• This presentation summarized some <strong>of</strong> these cost <strong>of</strong><br />
capital data source differences.<br />
• Questions <strong>and</strong> discussion<br />
54