The ESOP Feasibility Study - Willamette Management Associates
The ESOP Feasibility Study - Willamette Management Associates
The ESOP Feasibility Study - Willamette Management Associates

Create successful ePaper yourself
Turn your PDF publications into a flip-book with our unique Google optimized e-Paper software.
<strong>ESOP</strong> Independent Financial Adviser Insights<strong>The</strong> <strong>ESOP</strong> <strong>Feasibility</strong> <strong>Study</strong>C. Ryan StewartAn <strong>ESOP</strong> feasibility study is an important first step in the process of establishingan employee stock ownership plan (<strong>ESOP</strong>) in a qualifying employer corporation.Such a study provides useful information to shareholders who are considering sellingshares to an <strong>ESOP</strong> and to employer corporation managers. This information allows theseparties of interest to decide whether or not an <strong>ESOP</strong> employer stock purchase transaction isan effective strategy for achieving their various objectives. <strong>ESOP</strong> feasibility studies canbe very different depending on the situation. However, most <strong>ESOP</strong> feasibility studiescontain basic elements that should be addressed in order (1) to provide meaningfulinformation to all parties and (2) to avoid costly mistakes that could impair thelong-term success of the <strong>ESOP</strong>.Introduction<strong>The</strong> purpose of an <strong>ESOP</strong> feasibility analysis is to givethe selling shareholder(s) and employer corporationmanagement the information needed to determinewhether to move forward with an <strong>ESOP</strong> installationtransaction.Further, the results of the feasibility study enablethe employer corporation, the <strong>ESOP</strong> trustee, thelegal advisers, and the selling shareholder(s) tostructure a transaction that is beneficial to the partiesto the transaction. Such a transaction shouldalso be fair to the <strong>ESOP</strong> from a financial point ofview.In general an <strong>ESOP</strong> feasibility study shouldaddress the following questions:• Who will be selling the employer shares tothe <strong>ESOP</strong>?• How will the employer stock purchasetransaction be financed and how will thisaffect the cash flow of the sponsor company?• What is the best plan design for the sponsorcompany? Should the sponsor companymerge the <strong>ESOP</strong> with an existing 401(k)?• What are the rules and technical aspectsof an <strong>ESOP</strong> that the employer corporationmanagement and the selling shareholder(s)should know?• What if the sponsor company’s actual futureperformance varies positively or negativelyfrom the future performance anticipated atthe time of the employer stock purchasetransaction?• How does the selling shareholder’s desiredsale price for the employer corporationstock compare to the range of values determinedby the valuation analyst working forthe to-be-formed <strong>ESOP</strong>?<strong>The</strong> First Steps<strong>The</strong> initial steps of the <strong>ESOP</strong> feasibility study canactually be completed by the selling shareholder(s)with the help of the sponsor company management.That is, the initial <strong>ESOP</strong> feasibility procedures canbe performed without the need to engage outsidefinancial advisers or legal counsel.In general, employer corporations that are in thebest position to successfully complete the <strong>ESOP</strong> formationprocess and to be a sustainable <strong>ESOP</strong> havethe following fact pattern:www.willamette.com INSIGHTS • WINTER 2011 19
• closely held U.S. company• more than 25 employees• established track record of consistent profitabilityand earnings growth• a number years of operating history• owner who is interested in liquidity and adiversification of wealth• owner who is interested in succession planningand transitioning ownership of thecompany to employees• at least $1 million in revenue• owner who is open to accepting a conservativedeal value• senior management team that supports the<strong>ESOP</strong> formation<strong>The</strong> controlling shareholder(s) can compare theemployer corporation relative to these benchmarkcriteria in order to determine if the subject corporationis an ideal <strong>ESOP</strong> candidate. This initial analysiscan be done without having to spend large amountsof time and money.<strong>The</strong> next step is to become more familiar withthe <strong>ESOP</strong> installation process, as well as the financialand administrative aspects of an <strong>ESOP</strong>. <strong>The</strong><strong>ESOP</strong> Association and the National Center forEmployee Ownership (NCEO) are excellent sourcesfor this type of information. This will allow the partiesin interest to be able to address questions suchas the following:• Can the differing goals and objectives of variousshareholders and others parties in thetransaction (management team, employees,non-selling shareholders, etc.) be achievedthrough the installation of an <strong>ESOP</strong>?• Would a merger or sale to a strategic buyeror other type of liquidity event be bettersuited to these objectives?• What percentage of the employer corporationwill the <strong>ESOP</strong> own post-transactionand which shareholders will sell or redeemtheir shares as part of the employer stockpurchase transaction?• How will management and current controllingshareholders react to voting/controlrights and issues and corporate governancechanges?• How will management succession planningbe addressed in relation to the transaction?How long will the selling shareholders (whoare also managers or executives) remainin their current roles? How will successorsbe identified and transitioned in order tomaintain continuity gong forward?• Is it desirable to merge the <strong>ESOP</strong> with anexisting 401(k)?• What happens to existing managementincentive plans? Would a new plan be introducedas part of an <strong>ESOP</strong> employer stockpurchase transaction?• Which employees will be eligible to participatein the plan?Consideration of the aforementioned questionswill help to clarify the goals and objectives of interestedparties. In this way, the means of achievingthese goals can later be evaluated as part of the<strong>ESOP</strong> feasibility analysis.If these initial steps indicate that installing an<strong>ESOP</strong> is a favorable method of achieving the objectivesof the interested parties, then it is probablytime to engage qualified, experienced <strong>ESOP</strong> professionalsto address some of the more technical (orcomplex) <strong>ESOP</strong> feasibility issues.<strong>The</strong> Common Elements of aFull Comprehensive <strong>ESOP</strong><strong>Feasibility</strong> <strong>Study</strong>A comprehensive <strong>ESOP</strong> feasibility study is typicallycomprised of several analyses that focus on variousareas of concern. <strong>The</strong>se analyses may include thefollowing:• a preliminary valuation of the employercorporation to determine the approximateprice that an <strong>ESOP</strong> could or may pay• a stockholders’ equity analysis to determinehow an <strong>ESOP</strong> would affect existingshareholders and the employer corporationfinancial performance• a plan design study to determine the idealtransaction structure and plan features toincorporate in the to-be-formed <strong>ESOP</strong>• a liquidity study to assess the demandsthat the employer corporation repurchaseobligations would eventually make on thesponsor company<strong>The</strong> Preliminary Valuation<strong>The</strong> preliminary valuation is an important part ofthe <strong>ESOP</strong> feasibility analysis. However, it is one of20 INSIGHTS • WINTER 2011 www.willamette.com
the early steps in the process. <strong>The</strong>refore, the preliminaryvaluation is generally performed by thevaluation firm without the benefit of due diligenceadequate for developing a formal opinion of value.Because the determination of value is such acomplex undertaking, an experienced valuation firmis required. In most cases, the preliminary valuationis expressed as a range of values as of a specific date.An experienced <strong>ESOP</strong> valuation analyst canestablish this range of value without rendering adetailed valuation report. Consequently, the costwill be much less than that of a final valuationreport.<strong>The</strong> determination of the range of values is onthe critical path of the <strong>ESOP</strong> formation process.If (1) it is below the price desired by the seller(s)and (2) structuring alternatives, such as earn-outsor warrants, can’t be used to encourage seller(s) toproceed, then other strategies may be employed toincrease value (waiting until the employer corporationperformance improves, reducing employercorporation expenses, etc.).If the major shareholders are not willing to sellstock, or to permit the issuance of new stock at aprice within the range of values determined by thevaluation analyst, then the <strong>ESOP</strong> formation processshould be abandoned.<strong>The</strong> preliminary value should be completed asearly in the process as possible so that owners canchange direction and evaluate other liquidity alternativeswhile minimizing costs incurred pursuing astrategy that would ultimately be unsuccessful.Equity Analysis/Cash FlowAnalysis<strong>The</strong> stockholders’ equity analysis, a liquidity study,and a design study can be started concurrently,while the preliminary valuation is being performed.<strong>The</strong> stockholders’ equity study will address severalof the important questions usually asked bymajor shareholders who are considering an <strong>ESOP</strong>.Typically, such shareholders want to be shownthe following, for the period that the <strong>ESOP</strong> loan willbe outstanding:• how the <strong>ESOP</strong> will affect the value of theirstock• how the <strong>ESOP</strong> will affect the sponsor company’scash flow and its profitability• what employer stock value dilutive effectsthe <strong>ESOP</strong> will haveWhen the employercorporation employercorporation has an existingpension and/or profitsharing plan, the analysismay also show the effectsof the <strong>ESOP</strong> comparedto those of the existingplans.<strong>The</strong> stockholders’equity analysis uses theemployer corporation’sinternally produced projections,projections withalternative growth andprofitability assumptions,and other <strong>ESOP</strong> transactionvariables to createseveral scenarios in orderto illustrate the resultingimpact on cash flow andvalue.“If the major shareholdersare not willingto sell stock, or topermit the issuance ofnew stock at a pricewithin the range ofvalues determined bythe valuation analyst,then the <strong>ESOP</strong> formationprocess shouldbe abandoned.”It is important to note that the cash flow analysiscan be used as a structuring tool to evaluate a mixtureof financing options such as varying levels ofbank debt versus seller debt, as well as the assortedterms and conditions of the proposed financing.Some of the important variables that can beadjusted in order to construct various scenariosinclude, but are not limited to, the following:• revenue growth• profit margin• amount of bank financing• bank financing terms (interest rates, covenants,maturity, required prepayments,guarantees, etc.)• amount of seller financing• seller subordinated debt terms (interestrates, maturity, required prepayments, warrants,etc.)• refinancing• capital expenditures• working capitalMany times, the valuation analyst will useemployer corporation provided projections as a basecase scenario. <strong>The</strong> valuation analyst will then adjustrevenues or profitability to create other scenariossuch as optimistic, pessimistic, and zero growthscenarios.<strong>The</strong>se scenarios hold changes in other variablesconsistent across the scenarios. <strong>The</strong> goal of thesealternative scenarios is to demonstrate how thewww.willamette.com INSIGHTS • WINTER 2011 21
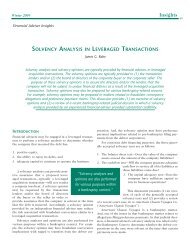
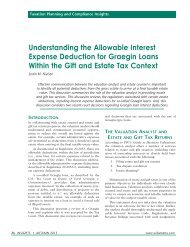
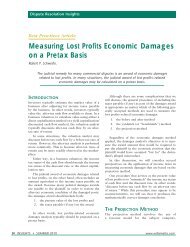
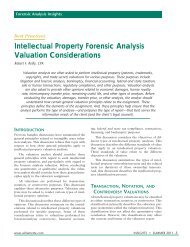
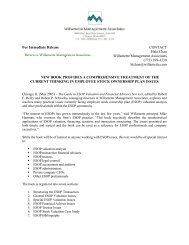
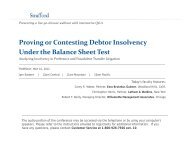
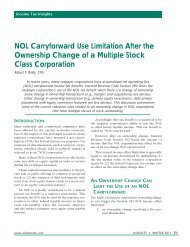
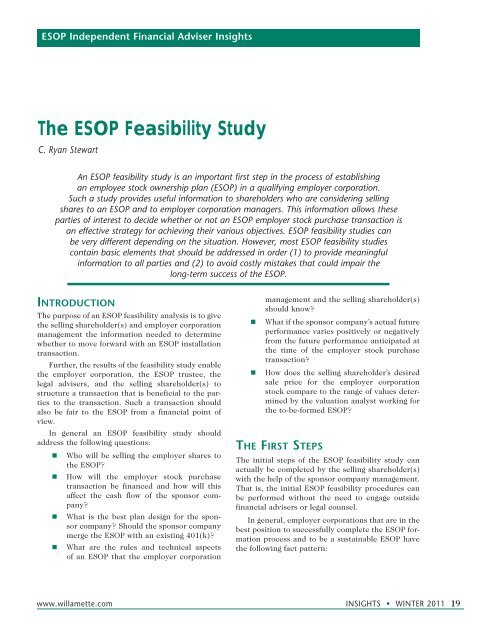
Exhibit 1Employer CorporationProjected Income StatementsAs of January 1, 2010(<strong>Management</strong> Expectations “Base Case” Scenario)Projected Projected Projected Projected Projected Projected Projected Projected Projected Projected12/31/10 12/31/11 12/30/12 12/30/13 12/31/14 12/31/10 12/31/11 12/30/12 12/30/13 12/31/14 Avg.$000s $000s $000s $000s $000s % % % % % %Revenue 9,000 9,900 10,692 11,227 11,788 100.0 100.0 100.0 100.0 100.0 100.0Revenue Growth Rate 10% 8% 5% 5%Cost of Goods Sold 6,120 6,732 7,305 7,706 8,128 68.0 68.0 68.3 68.6 69.0 68.4Gross Profit 2,880 3,168 3,387 3,521 3,660 32.0 32.0 31.7 31.4 31.0 31.6Operating Expenses (2,121) (2,086) (2,027) (1,915) (1,810) (23.6) (21.1) (19.0) (17.1) (15.4) (19.2)Operating Income [EBIT] 759 1,082 1,360 1,606 1,851 8.4 10.9 12.7 14.3 15.7 12.4Interest Expense (90) (60) - (1) (2) (1.0) (0.6) - (0.0) (0.0) (0.3)Other Income (Expense) 518 - - - - 5.8 - - - - 1.2Pretax Income 1,187 1,022 1,360 1,605 1,849 13.2 10.3 12.7 14.3 15.7 13.2Cash Flow CalculationEBIT 759 1,082 1,360 1,606 1,851 8.4 10.9 12.7 14.3 15.7 12.4+ EBITDA Add Backs 2,974 3,004 3,064 3,063 3,061 33.0 30.3 28.7 27.3 26.0 29.1- Lease Add Back - - - - - - - - - - -= EBITDA 3,733 4,086 4,424 4,669 4,912 41.5 41.3 41.4 41.6 41.7 41.5employer corporation may fare under multiple setsof operating circumstances.Exhibit 1 illustrates an example base case operatingscenario, using projections provided by employercorporation management.Exhibit 2 shows the proposed deal financingstructure, interest rates, debt maturities, and theresulting sponsor company cash flows and covenantcompliance.Exhibit 3 illustrates the impact of declining revenueon profitability.Exhibit 4 demonstrates how the decline in profitabilityaffects cash flow and covenant compliance.From this analysis, interested parties to thetransaction can observe the impact that a declinein revenue/profitability would have on the cashflow of the sponsor company. <strong>The</strong> interested partiescan then develop a plan of action or alter the dealstructure to ensure that the sponsor company hasadequate capital in the event that base case projectionsare not achieved.A similar analysis is presented in Exhibits 5 and6. However, this analysis calculates the value of theemployer corporation in future years using sponsorcompany projections forecasted out at least to theyear that all seller debt matures.<strong>The</strong> market value of invested capital (MVIC)in future periods is estimated by applying marketderivedpricing multiples of revenue and EBITDA(earnings before interest, taxes, depreciation, andamortization) for each period. <strong>The</strong> two indicationsof value are then averaged in order to arrive at asingle indication of value.Next, the operating debt and <strong>ESOP</strong> debt aresubtracted from the MVIC, and a discount for lackof marketability is applied to arrive at the estimatedfair market value of sponsor company equity foreach year.In the example presented in Exhibit 5, warrantsare attached to the seller debt. <strong>The</strong>se warrantsgive the selling shareholder the right topurchase 700,000 shares of stock at 90 percent ofthe December 31, 2009, fair market value of equityper share in tranches that are exercisable upon thesponsor company achieving certain EBIT targets.Exhibit 6 presents the cash flow implicationsof the additional debt from the exercise of thewarrants. This analysis can help to facilitate discussionsbetween the selling shareholder(s), legaladvisers, and the <strong>ESOP</strong> financial advisers regarding(1) the total return on the debt and warrants tobe received by the selling shareholder(s), (2) theresulting dilutive impact on value and (3) the cash22 INSIGHTS • WINTER 2011 www.willamette.com
Exhibit 2Employer CorporationDebt Service ProjectionsAs of January 1, 2010(<strong>Management</strong> Expectations “Base Case” Scenario)2011 2012 2013 2014 2015 2016 2017 2018$000s $000s $000s $000s $000s $000s $000s $000sTerm LoanPrincipal 10,000Interest Rate 4.65%Amortization 7Term 3Beginning Principal Balance 10,000 7,356 5,955 4,080 2,916 1,655 289 -Principal Payments 2,644 1,401 1,874 1,165 1,261 1,366 289 -Interest Payments 380 312 379 284 188 83 3 -Total Loan Payment 3,025 1,713 2,253 1,449 1,449 1,449 292 -Ending Principal Balance 7,356 5,955 4,080 2,916 1,655 289 - -Total Principal Payments 2,644 1,401 1,874 1,165 1,261 - - -Total Interest Payments 380 312 379 284 188 - - -Total Transaction Debt Service 3,025 1,713 2,253 1,449 1,449 - - -Cash Flow for Debt Service [b] 3,452 3,757 3,998 4,207 4,418 4,638 4,870 5,114Senior Debt Service Coverage (Deficit) 427 2,044 1,745 2,758 2,969 4,638 4,870 5,114Subordinated Note 1Principal 3,000Interest Rate 10.00%Term 3Beginning Principal Balance 3,000 3,000 3,000 3,000 3,000 3,000 3,000 3,000Principal Payments - - - - - - - -- - - - - - - -Interest Payments 300 300 300 300 300 300 300 300Total Loan Payment 300 300 300 300 300 300 300 300Ending Principal Balance 3,000 3,000 3,000 3,000 3,000 3,000 3,000 3,000Cash Flow for Debt Service 427 2,044 1,745 2,758 2,969 4,638 4,870 5,114Subordinated Note Payment 300 300 300 300 300 300 300 300Debt Service Coverage (Deficit) 127 1,744 1,445 2,458 2,669 4,338 4,570 4,814Excess Cash FlowEBITDA 4,086 4,424 4,669 4,912 5,157 5,415 5,686 5,970LESS: cash interest expense 680 612 679 584 488 300 300 300cash taxes (if any) - - - - - - - -required and voluntary debt payments (principal) 2,644 1,401 1,874 1,165 1,261 - - -unfinanced capital expenditures 495 545 588 617 648 648 648 648dividend distributions 194 258 305 351 369 387 407 427treasury stock purchases - - - - - - - -72 1,609 1,223 2,194 2,391 4,079 4,331 4,595Mandatory Prepayment (36) (804) - - - - - -Adjusted Cash Flow 36 804 1,223 2,194 2,391 4,079 4,331 4,595Beginning Cash 1,348 1,384 2,189 3,412 5,606 7,997 12,076 16,407Ending Cash 1,384 2,189 3,412 5,606 7,997 12,076 16,407 21,002Personal Guarantee 2,500 2,500 2,500 2,500 - - - -Covenant ComplianceLetter of Credit - - - - - - - -CapEx Loan - - - - - - - -Term Loan 7,356 5,955 4,080 2,916 1,655 289 - -Sub Note 1 3,000 3,000 3,000 3,000 3,000 3,000 3,000 3,000Sub Note 2 - - - - - - - -Guarantee 2,500 2,500 2,500 2,500 - - - -Total Funded Debt 12,856 11,455 9,580 8,416 4,655 3,289 3,000 3,000EBITDA 4,086 4,424 4,669 4,912 5,157 5,415 5,686 5,970<strong>ESOP</strong> Contribution Expenses - - - - - - - -EBITDAE 4,086 4,424 4,669 4,912 5,157 5,415 5,686 5,970Total Leverage 3.15x 2.59x 2.05x 1.71x 0.90x 0.61x 0.53x 0.50xMaximum Allowed 3.25x 3.25x 3.25x 3.25x 3.25x 3.25x 3.25x 3.25xIn Compliance? Yes Yes Yes Yes Yes Yes Yes Yeswww.willamette.com INSIGHTS • WINTER 2011 23
Exhibit 3Employer CorporationProjected Income StatementsAs of January 1, 2010(Declining Revenue Scenario)Projected Projected Projected Projected Projected Projected Projected Projected Projected Projected12/31/10 12/31/11 12/30/12 12/30/13 12/31/14 12/31/10 12/31/11 12/30/12 12/30/13 12/31/14 Avg.$000s $000s $000s $000s $000s % % % % % %Revenue 9,000 7,650 6,503 5,527 4,698 100.0 100.0 100.0 100.0 100.0 100.0Revenue Growth Rate -15% -15% -15% -15%Cost of Goods Sold 6,120 5,202 4,443 3,794 3,239 68.0 68.0 68.3 68.6 69.0 68.4Gross Profit 2,880 2,448 2,060 1,733 1,459 32.0 32.0 31.7 31.4 31.0 31.6Operating Expenses (2,121) (1,612) (1,233) (943) (721) (23.6) (21.1) (19.0) (17.1) (15.4) (19.2)Operating Income (EBIT) 759 836 827 791 738 8.4 10.9 12.7 14.3 15.7 12.4Interest Expense (90) (60) - (1) (2) (1.0) (0.8) - (0.0) (0.0) (0.4)Other Income (Expense) 518 - - - - 5.8 - - - - 1.2Pretax Income 1,187 776 827 790 736 13.2 10.1 12.7 14.3 15.7 13.2Cash Flow CalculationEBIT 759 836 827 791 738 8.4 10.9 12.7 14.3 15.7 12.4+ EBITDA Add Backs 2,974 3,004 3,064 3,063 3,061 33.0 39.3 47.1 55.4 65.2 48.0- Lease Add Back - - - - - - - - - - -= EBITDA 3,733 3,840 3,891 3,854 3,799 41.5 50.2 59.8 69.7 80.9 60.4flow implications of the timing and magnitude of thewarrant cash out payments.Liquidity Analysis<strong>The</strong> liquidity analysis is intended to estimatethe amount of the repurchase obligation that thesponsor company will“While a liquidity analysisdoes not typicallyaddress the source offunding for repurchaseobligations, it is a valuableanalysis tool thatcan help the sponsorcompany managementto estimate the timingand amounts of fundingneeded for repurchasingshares.”incur over the next,say, 10 to 15 years.This repurchase obligationsresults fromemployees’ terminationof service dueto death, disability,retirement, and soforth.<strong>The</strong> liquidity analysistypically does notaddress the source offunding for the repurchaseobligation.However, it is a valuableanalysis tool thatcan help the sponsorcompany managementto estimate thetiming and amount of the funding that will beneeded for repurchasing the employer shares. Thisinformation allows the sponsor company managementto make the appropriate plans.Plan Design <strong>Study</strong> Analysis<strong>The</strong> greater the flexibility integrated into the designof the <strong>ESOP</strong>, the more effectively it will be able toaccomplish the objectives (1) of the employer corporationand (2) of the selling shareholders.<strong>The</strong> plan design study will typically address thefollowing issues:• participant eligibility• vesting schedules• timing of benefit distributions• forfeitures• contribution levels• allocation formulas• past service credit• early retirement policies• a charter or bylaw provision restrictingstock ownership to the employee group24 INSIGHTS • WINTER 2011 www.willamette.com
<strong>The</strong> use of one or more special classes of stock(e.g., nonvoting stock, preferred or convertible preferredstock, etc.) can also be addressed in this plandesign study.Other questions that may need to be addressedin the plan design study include the following:• Who will participate in the <strong>ESOP</strong>?• Must the sponsor company distributestock to employees at retirement or otherrequired distribution dates if they demandit, or can the sponsor company limit thedistributions to cash?• What divisions or subsidiaries can beexcluded from the plan?• Who will vote the <strong>ESOP</strong> stock and underwhat circumstances?• Should you combine other plans, such as a401(k) plan, with the <strong>ESOP</strong>?• What will happen to an existing pension orprofit sharing plan?• Is the existing pension plan overfunded,underfunded, or currently funded?• What about the selection of <strong>ESOP</strong> fiduciariestrustee(s),and possible administrative and/oradvisory committee(s)?An analysis of income tax issues should also bepart of the plan design aspect of an <strong>ESOP</strong> feasibilitystudy. <strong>The</strong> relevant income-tax-related issuesinclude the tax implications of <strong>ESOP</strong>-related legislation,regulations and rulings, and judicial precedent.In addition, interested parties should considerthe implications of the following:1. “tax-deferred reinvestment” or “tax-freerollover” of funds from the sale of theemployer corporation stock to an <strong>ESOP</strong>2. tax-deductible dividends if paid to participantsor used to repay the <strong>ESOP</strong> debt3. S corporation <strong>ESOP</strong> considerations4. any new or proposed regulations or legislationIf a deferred profit sharing or money purchasepension plan exists at the sponsor company, it isnormally “frozen.” And, the assets of the existingplan will typically remain invested in a diversifiedportfolio. However, the employees can be given theoption to invest a portion or all of their assets froma profit sharing, money purchase, or 401(k) planeither (1) into the sponsor company stock or (2)into part of the <strong>ESOP</strong> employer stock transaction.All federal and state securities laws should becomplied with, and “full disclosure” should be givento the sponsor company employees. Full disclosurecan be a very expensive proposition. Almost all<strong>ESOP</strong> sponsor companies either maintain or establisha diversified 401(k) plan that is not invested inthe sponsor company stock. However, in some casesa sponsor company may decide to merge its existing401(k) plan with the <strong>ESOP</strong>.In these situations, employees that are investedin the sponsor company’s 401(k) plan are given theopportunity to invest their money into the <strong>ESOP</strong>.<strong>The</strong>se funds are considered part of the employerstock purchase transaction financing, and thesefunds are used to purchase sponsor company sharesfrom the selling shareholder(s).As mentioned above, there are certain costs andrisks associated with an <strong>ESOP</strong>. For example, thesponsor company will be required to create a disclosurememorandum. <strong>The</strong> disclosure memorandumdescribes:1. the nature of sponsor company operations,2. historical operating performance,3. expectations for future performance,4. risks associated with investing in the sponsorcompany, and5. other information that an investor wouldrequire in order to make an informedinvestment decision.<strong>The</strong> disclosure memorandum is then distributedto the employees. <strong>The</strong> sponsor company employeesare typically given 20-30 days to make their decisionabout investing in the sponsor company stock.<strong>The</strong> distribution of this disclosure memorandummay be considered a risk to the <strong>ESOP</strong> formationprocess. This is because, many times, the employeesdon’t have the financial sophistication or desire toevaluate the information contained in the disclosurememorandum.<strong>The</strong>refore, many employees elect not to invest.As a result, the sponsor company may not receivethe level of employee participation that was expectedfrom this method of financing.In some cases, the sponsor company may makefinancial advisers available to the employees at nocost. <strong>The</strong>se financial advisers are provided in aneffort to give the sponsor company employees theresources needed to make informed decisions.www.willamette.com INSIGHTS • WINTER 2011 25
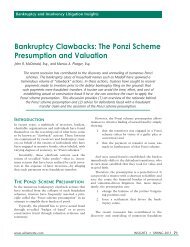
Exhibit 4Employer CorporationDebt Service ProjectionsAs of January 1, 2010(Defining Revenue Scenario)2011 2012 2013 2014 2015 2016 2017 2018$000s $000s $000s $000s $000s $000s $000s $000sTerm LoanPrincipal 10,000Interest Rate 4.65%Amortization 7Term 3Beginning Principal Balance 10,000 7,356 6,059 4,279 3,104 1,833 455 -Principal Payments 2,644 1,297 1,780 1,174 1,272 1,377 455 -Interest Payments 380 316 394 300 202 97 7 -Total Loan Payment 3,025 1,613 2,174 1,474 1,474 1,474 463 -Ending Principal Balance 7,356 6,059 4,279 3,104 1,833 455 - -Total Principal Payments 2,644 1,297 1,780 1,174 1,272 - - -Total Interest Payments 380 316 394 300 202 - - -Total Transaction Debt Service 3,025 1,613 2,174 1,474 1,474 - - -Cash Flow for Debt Service [b] 3,555 3,648 3,647 3,623 3,804 3,994 4,194 4,404Senior Debt Service Coverage (Deficit) 530 2,035 1,473 2,149 2,330 3,994 4,194 4,404Subordinated Note 1Principal 3,000Interest Rate 10.00%Term 3Beginning Principal Balance 3,000 3,000 3,000 3,000 3,000 3,000 3,000 3,000Principal Payments - - - - - - - -- - - - - - - -Interest Payments 300 300 300 300 300 300 300 300Total Loan Payment 300 300 300 300 300 300 300 300Ending Principal Balance 3,000 3,000 3,000 3,000 3,000 3,000 3,000 3,000Cash Flow for Debt Service 530 2,035 1,473 2,149 2,330 3,994 4,194 4,404Subordinated Note Payment 300 300 300 300 300 300 300 300Debt Service Coverage (Deficit) 230 1,735 1,173 1,849 2,030 3,694 3,894 4,104Excess Cash FlowEBITDA 3,840 3,891 3,854 3,799 3,988 4,188 4,397 4,617LESS: cash interest expense 680 616 694 600 502 300 300 300cash taxes (if any) - - - - - - - -required and voluntary debt payments (principal) 2,644 1,297 1,780 1,174 1,272 - - -unfinanced capital expenditures 495 421 358 304 258 258 258 258dividend distributions 147 157 150 140 147 154 162 170treasury stock purchases - - - - - - - -(127) 1,400 872 1,581 1,809 3,475 3,677 3,889Mandatory Prepayment 63 (700) - - - - - -Adjusted Cash Flow (63) 700 872 1,581 1,809 3,475 3,677 3,889Beginning Cash 1,348 1,285 1,985 2,857 4,437 6,247 9,722 13,399Ending Cash 1,285 1,985 2,857 4,437 6,247 9,722 13,399 17,288Personal Guarantee 2,500 2,500 2,500 2,500 - - - -Covenant ComplianceLetter of Credit - - - - - - - -CapEx Loan - - - - - - - -Term Loan 7,356 6,059 4,279 3,104 1,833 455 - -Sub Note 1 3,000 3,000 3,000 3,000 3,000 3,000 3,000 3,000Sub Note 2 - - - - - - - -Guarantee 2,500 2,500 2,500 2,500 - - - -Total Funded Debt 12,856 11,559 9,779 8,604 4,833 3,455 3,000 3,000EBITDA 3,840 3,891 3,854 3,799 3,988 4,188 4,397 4,617<strong>ESOP</strong> Contribution Expenses - - - - - - - -EBITDAE 3,840 3,891 3,854 3,799 3,988 4,188 4,397 4,617Total Leverage 3.35x 2.97x 2.54x 2.27x 1.21x 0.83x 0.68x 0.65xMaximum Allowed 3.25x 3.25x 3.25x 3.25x 3.25x 3.25x 3.25x 3.25xIn Compliance? No Yes Yes Yes Yes Yes Yes Yes26 INSIGHTS • WINTER 2011 www.willamette.com
However, due to the costs associated with givingemployees the option to invest their 401(k) orprofit sharing assets in sponsor company stock, theemployer corporation management should carefullyweigh the risks versus the probability of successbefore pursuing this strategy.If sponsor company management determinesthat this strategy will be pursued, a temporary “floorprice” will usually be attached to the employer stockacquired with assets of other plans. This temporaryfloor price will often remain in effect until the <strong>ESOP</strong>debt is completely repaid.This “floor price,” in most cases, is calculated asthe fair market value of the sponsor company stockwithout taking into account the impact of <strong>ESOP</strong>stock acquisition debt.<strong>The</strong> plan design features should also allow forfactors that will positively influence employee motivation.For example, an accelerated vesting scheduleserves to motivate employees. However, as a meansto prevent vested employees from terminating theiremployment prematurely in order to receive largeaccount balances, the sponsor company may postponedistribution of accounts to terminated employeesfor a considerable time period.Voting rights are a major concern for manyshareholders of closely held corporations. However,this issue has not proven to be a concern with <strong>ESOP</strong>ownedsponsor companies. <strong>The</strong>re is no requirementto “pass-through” voting rights to employees ofclosely held sponsor companies, except for issuessuch as mergers, consolidations, recapitalizations,sale of the business, liquidation, dissolutions, andsimilar types of transactions.When a trusted, experienced management teamhas a track record of successfully operating a businessto achieve growth and profitability, employeesare generally content not to be involved in the managementof the sponsor company.Summary and ConclusionUpon the completion of the <strong>ESOP</strong> feasibility study,the findings are typically presented to the employercorporation board of directors or the <strong>ESOP</strong> formationcommittee. <strong>The</strong> board or the special committeethen makes the final decision regarding the formationof an <strong>ESOP</strong>.It is important for the professionals involvedin conducting the <strong>ESOP</strong> feasibility study (whichmay include a valuation firm, an <strong>ESOP</strong> consultant,investment bankers, lenders,the senior management team,legal advisers, and the shareholders):1. to anticipate potential<strong>ESOP</strong> formationobstacles and2. to have consideredsolutions to theseobstacles. In thisway, these issues canbe evaluated as partof the board of directors’or <strong>ESOP</strong> formationcommittee’s decision-making process.Further, the evaluation of the <strong>ESOP</strong> feasibilityis an ongoing part of the <strong>ESOP</strong> formation process.As decisions are made, circumstances change, andvarious opportunities are considered, the differentaspects and analyses of the <strong>ESOP</strong> feasibility studyshould be updated. This update analysis shouldreflect the most current set of facts related to thesponsor company in order to confirm the continuedfeasibility of an <strong>ESOP</strong> formation.Sources:1. <strong>The</strong> <strong>ESOP</strong> Reader, 2003 ed. Oakland, CA: NationalCenter for Employee Ownership, 2003.2. Hartman, Malcolm R. “<strong>The</strong> Role of the IndependentFinancial Adviser in the <strong>ESOP</strong> <strong>Feasibility</strong>,Formation, and Transaction Fairness Process.”Insights (Autumn 2005), pp. 47-55.3. Smiley, Robert W. Jr., Ronald J. Gilbert, DavidBinns, Ronald L. Ludwig, and Corey M. Rosen,eds. Employee Stock Ownership Plans: BusinessPlanning, Implementation, and Law andTaxation. San Diego:<strong>The</strong> Beyster Institute,2006 and 2007.5. Hartman, Malcolm R.“<strong>The</strong> <strong>ESOP</strong> <strong>Feasibility</strong>Analysis for a Potential<strong>ESOP</strong> Formation.”Insights (Spring 2009),pp. 9-12.6. Bonn, Karen. “<strong>Feasibility</strong>Studies Help Avoid<strong>ESOP</strong> Foibles.” <strong>The</strong> TaxAdviser (February 1,1999).Ryan Stewart is a manager inour Atlanta office. Ryan can bereached at (404) 475-2318 or atcrstewart@willamette.com.“Plan design featuresshould alsoallow for factorsthat will positivelyinfluence employeemotivation. ”“It is important forthe professionalsinvolved in conductingthe feasibilitystudy . . . toanticipate potentialobstacles andto have consideredsolutions to theseobstacles.”www.willamette.com INSIGHTS • WINTER 2011 27
Exhibit 5Employer CorporationTotal Seller Rate of Return CalculationAs of January 1, 2010Current12/31/09 12/31/10 12/31/11 12/30/12 12/30/13 12/31/14 12/31/15 12/30/16 12/30/17 12/31/18 12/31/19 12/30/20 12/30/21 12/31/22 12/31/23 12/30/24 12/30/25 12/31/26$000s $000s $000s $000s $000s $000s $000s $000s $000s $000s $000s $000s $000s $000s $000s $000s $000s $000sProjected Revenue 40,000 37,000 42,000 46,000 49,000 51,450 54,023 56,724 59,560 62,538 65,665 68,948 72,395 76,015 79,816 83,807 87,997Growth Rate -8% 14% 10% 7% 5% 5% 5% 5% 5% 5% 5% 5% 5% 5% 5% 5%Projected EBITDA 1,500 2,373 4,471 5,999 7,500 7,875 8,269 8,682 9,116 9,572 10,051 10,553 11,081 11,635 12,217 12,828 13,469EBITDA Growth Rate 58% 88% 34% 25% 5% 5% 5% 5% 5% 5% 5% 5% 5% 5% 5% 5%EBITDA Margin 6% 11% 13% 15% 15% 15% 15% 15% 15% 15% 15% 15% 15% 15% 15% 15%Projected EBIT 1200 2,273 4,371 5,899 7,999 8,398 8,818 9,259 9,722 10,208 10,719 11,255 11,817 12,408 13,029 13,680 14,364EBIT Growth Rate 89% 92% 35% 36% 5% 5% 5% 5% 5% 5% 5% 5% 5% 5% 5% 5%EBIT Margin 6% 10% 13% 16% 16% 16% 16% 16% 16% 16% 16% 16% 16% 16% 16% 16%Market Value of Invested Capital (MVIC)[before DLOM]Future MVIC [Revenue Pricing Multiple] 28,000 25,900 25,200 27,600 29,400 30,870 32,414 34,034 35,736 37,523 39,399 41,369 43,437 45,609 47,890 50,284 52,798Future MVIC [EBITDA Pricing Multiple] 22,500 35,593 33,532 44,989 56,250 59,063 62,016 65,116 68,372 71,791 75,380 79,149 83,107 87,262 91,625 96,207 101,017Estimated Future MVIC 35,000 25,250 30,746 29,366 36,295 42,825 44,966 47,215 49,575 52,054 54,657 57,390 60,259 63,272 66,436 69,757 73,245 76,908Equity ValueEstimated Future MVIC 35,000 25,250 30,746 29,366 36,295 42,825 44,966 47,215 49,575 52,054 54,657 57,390 60,259 63,272 66,436 69,757 73,245 76,908- Operating Debt 11,943 3,030 3,690 2,000 1,500 1,200 1,200 1,200 1,200 1,200 1,200 1,200 1,201 1,202 1,203 1,204 1,205 1,205Warrant Note 1 - - - - - 5,970 5,412 4,830 4,223 3,590 2,931 2,243 1,526 779 - - - -Warrant Note 2 - - - - - - 3,339 3,027 2,701 2,362 2,008 1,639 1,254 854 436 - - -Warrant Note 3 - - - - - - 1,670 1,513 1,351 1,181 1,004 820 627 427 218 - - -Warrant Note 4 - - - - - - - 1,034 938 837 732 622 508 389 264 135 - -Warrant Note 5 - - - - - - - - 622 564 503 440 374 305 234 159 81 -- <strong>ESOP</strong> Note 10,600 10,477 9,572 8,630 7,650 6,630 5,568 4,462 3,312 2,114 868 - - - - - - -= Indicated Equity Value [Rounded] 12,457 11,743 17,484 18,736 27,145 29,025 27,778 31,148 35,230 40,207 45,412 50,426 54,768 59,317 64,081 68,259 71,959 75,703- DLOM -5% (623) (587) (874) (937) (1,357) (1,451) (1,389) (1,557) (1,761) (2,010) (2,271) (2,521) (2,738) (2,966) (3,204) (3,413) (3,598) (3,785)= Concluded Total Fair Markte Value of Equity [Rounded] 11,800 11,200 16,600 17,800 25,800 27,600 26,400 29,600 33,500 38,200 43,100 47,900 52,000 56,400 60,900 64,800 68,400 71,900Number of <strong>ESOP</strong> Shares 700 700 700 700 700 700 700 700 700 700 700 700 700 700 700 700 700 700Warrant Shares Exercised - - - - - 300 225 50 25 10 - - - - - - - -Price Per Share 16.86 16.00 23.71 25.43 36.86 39.43 37.71 42.29 47.86 54.57 61.57 68.43 74.29 80.57 87.00 92.57 97.71 102.71Warrant Shares Exercised - - - - 300 225 50 25 10 - - - - - - - -Market Value Warrant Exercised - - - - 11,057 8,871 1,886 1,057 479 - - - - - - - -Warrant Exercise Price 15.17 15.17 15.17 15.17 15.17 15.17 15.17 15.17 15.17 15.17 15.17 15.17 15.17 15.17 15.17 15.17 15.17 15.17Total Warrant Exercise Value - - - - 4,551 3,414 759 379 152 - - - - - - - -Warrant Cash Out Value - - - - 6,506 5,458 1,127 678 327 - - - - - - - -Cumulative Warrant Value - - - - 6,506 11,964 13,091 13,769 14,095 14,095 14,095 14,095 14,095 14,095 14,095 14,095 14,095Return to Sellers<strong>ESOP</strong> Note (10,600) 544 1,306 1,306 1,306 1,306 1,306 1,306 1,306 1,306 1,306 885 - - - - - -Warrant Note 1 - - - - - 812 812 812 812 812 812 812 812 812 779 - - -Warrant Note 2 - - - - - - 454 454 454 454 454 454 454 454 454 436 - -Warrant Note 3 - - - - - - 227 227 227 227 227 227 227 227 227 218 - -Warrant Note 4 - - - - - - - 141 141 141 141 141 141 141 141 141 135 -Warrant Note 5 - - - - - - - - 85 85 85 85 85 85 85 85 85 81Total(10,600) 544 1,306 1,306 1,306 2,118 2,799 2,940 3,025 3,025 3,025 2,604 1,719 1,719 1,686 879 220 81Total Rate of Return [IRR] 15.0%IRR with Mid-Period Discounting 16.3%28 INSIGHTS • WINTER 2011 www.willamette.com
Exhibit 6Employer Corporation 6Sponsor Company Cash Flow AnalysisAs of January 1, 2010EXHIBIT 6ABC, INC.CASH FLOW ANALYSIS1 2 3 4 5 6 7 8 9 10 11 12 13 14 15 16 1712/31/10 12/31/11 12/30/12 12/30/13 12/31/14 12/31/15 12/30/16 12/30/17 12/31/18 12/31/19 12/30/20 12/30/21 12/31/22 12/31/23 12/30/24 12/30/25 12/31/26000's 000's 000's 000's 000's 000's 000's 000's 000's 000's 000's 000's 000's 000's 000's 000's 000'sProjected Revenues $ 40,000 $ 37,000 $ 42,000 $ 46,000 $ 49,000 $ 51,450 $ 54,023 $ 56,724 $ 59,560 $ 62,538 $ 65,665 $ 68,948 $ 72,395 $ 76,015 $ 79,816 $ 83,807 $ 87,997Projected EBITDA $ 1,500 $ 2,373 $ 4,471 $ 5,999 $ 7,500 $ 7,875 $ 8,269 $ 8,682 $ 9,116 $ 9,572 $ 10,051 $ 10,553 $ 11,081 $ 11,635 $ 12,217 $ 12,828 $ 13,469Senior Bank Debt - Revolver (120) (111) (126) (138) (147) (154) (162) (170) (179) (188) (197) (207) (217) (228) (239) (251) (264)Cash Flow after Bank Payments 1,380 2,262 4,345 5,861 7,353 7,721 8,107 8,512 8,938 9,384 9,854 10,346 10,864 11,407 11,977 12,576 13,205Seller Sub Notes (544) (1,306) (1,306) (1,306) (1,306) (1,306) (1,306) (1,306) (1,306) (1,306) (885) - - - - - -Warrant Note 1 - - - - (812) (812) (812) (812) (812) (812) (812) (812) (812) (779) - - -Warrant Note 2 - - - - - (454) (454) (454) (454) (454) (454) (454) (454) (454) (436) - -Warrant Note 3 - - - - - (227) (227) (227) (227) (227) (227) (227) (227) (227) (218) - -Warrant Note 4 - - - - - - (141) (141) (141) (141) (141) (141) (141) (141) (141) (135) -Warrant Note 5 - - - - - - - (85) (85) (85) (85) (85) (85) (85) (85) (85) (81)Total Sub Debt Service (544) (1,306) (1,306) (1,306) (2,118) (2,799) (2,940) (3,025) (3,025) (3,025) (2,604) (1,719) (1,719) (1,686) (879) (220) (81)Capital Expenditures (200) (200) (200) (200) (200) (200) (200) (200) (200) (200) (200) (200) (200) (200) (200) (200) (200)Working Capital Additions 4,983 270 (450) (360) (270) (221) (232) (243) (255) (268) (281) (295) (310) (326) (342) (359) (377)Excess Cash Flow (Deficit) 5,619 1,026 2,389 3,995 4,765 4,501 4,735 5,044 5,458 5,892 6,768 8,132 8,635 9,196 10,556 11,797 12,547www.willamette.com INSIGHTS • WINTER 2011 29