Annual Report 2001 - Chubb Group of Insurance Companies
Annual Report 2001 - Chubb Group of Insurance Companies
Annual Report 2001 - Chubb Group of Insurance Companies

You also want an ePaper? Increase the reach of your titles
YUMPU automatically turns print PDFs into web optimized ePapers that Google loves.
THE CHUBB CORPORATION<br />
<strong>Annual</strong> <strong>Report</strong> <strong>2001</strong><br />
D<br />
EFINING<br />
CHUBB<br />
Integrity<br />
❖ Unparalleled claim service<br />
Financial strength<br />
❖ Strong reserves<br />
❖ Strong balance sheet<br />
Global reach<br />
❖ 134 <strong>of</strong>fices in 31 countries<br />
Great place to work
THE CHUBB CORPORATION<br />
In 1882, Thomas Caldecot <strong>Chubb</strong> and his son<br />
Percy opened a marine underwriting business in the<br />
seaport district <strong>of</strong> New York City. The <strong>Chubb</strong>s were<br />
adept at turning risk into success, <strong>of</strong>ten by helping<br />
policyholders prevent disasters before they occurred.<br />
By the turn <strong>of</strong> the century, <strong>Chubb</strong> had established<br />
strong relationships with the insurance agents and brokers who placed<br />
their clients’ business with <strong>Chubb</strong> underwriters.<br />
“Never compromise integrity,” a <strong>Chubb</strong> principle, captures the spirit<br />
<strong>of</strong> our companies. Each member <strong>of</strong> the <strong>Chubb</strong> organization seeks to stand<br />
apart by bringing quality, fairness and integrity to each transaction.<br />
The <strong>Chubb</strong> Corporation was formed in 1967 and was listed on<br />
the New York Stock Exchange in 1984. Today, <strong>Chubb</strong> stands among<br />
the largest property and casualty insurers in the United States and the<br />
world. <strong>Chubb</strong>’s 12,600 employees serve customers from 134 <strong>of</strong>fices<br />
throughout North America, Europe, South America and the Pacific Rim.<br />
The principles <strong>of</strong> financial stability, product innovation and<br />
excellent service combined with the high caliber <strong>of</strong> our employees are<br />
the mainstays <strong>of</strong> our organization.<br />
Contents<br />
1 Letter to Shareholders<br />
9 Defining the <strong>Chubb</strong> Brand: a photo essay<br />
21 Supplementary Financial Data<br />
22 Property and Casualty Underwriting Results<br />
23 Management’s Discussion and Analysis<br />
44 Ten-Year Financial Summary<br />
48 Consolidated Financial Statements<br />
52 Notes to Consolidated Financial Statements<br />
74 Corporate Directory
Dean R. O’Hare, Chairman and Chief Executive Officer<br />
DEAR SHAREHOLDERS<br />
The year <strong>2001</strong> will live in memory — for the world in general, for<br />
the families <strong>of</strong> victims <strong>of</strong> terrorism and for the insurance<br />
industry. The attack <strong>of</strong> September 11th was the largest catastrophe in<br />
insurance history, costing the global insurance industry a still<br />
undetermined amount, with published estimates as high as $70 billion.<br />
For <strong>Chubb</strong>, the gross cost before reinsurance was more than $3 billion,<br />
which translated to $645 million net <strong>of</strong> reinsurance and an after-tax cost<br />
to shareholders <strong>of</strong> $420 million — more than half <strong>of</strong> what we earned in<br />
the entire previous year.<br />
I cannot mention September 11th without expressing my pride in<br />
how <strong>Chubb</strong> responded to the tragedy. Apart from property, business<br />
interruption and other coverage, <strong>Chubb</strong> provided workers’ compensation
coverage for approximately one-third <strong>of</strong> the people who died in the<br />
World Trade Center attack. Although our Claims team did not rescue<br />
victims from the buildings at Ground Zero, they did work day and night<br />
for weeks on end to bring solace and compassion to thousands <strong>of</strong> family<br />
members <strong>of</strong> victims. They helped comfort them with the knowledge that<br />
their personal tragedy would at least in some small part be mitigated by<br />
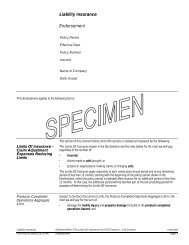
Dean O’Hare testifies before Congress on the<br />
aftermath <strong>of</strong> September 11th.<br />
On September 13th we<br />
became the first insurer to<br />
announce that terrorism<br />
was in fact not excluded<br />
under our policies, that<br />
we would not seek to<br />
apply the war risk<br />
exclusion and that we<br />
had started paying<br />
claims immediately;<br />
other insurers followed.<br />
prompt insurance payments to lessen the financial impact <strong>of</strong> their<br />
horrible losses.<br />
On September 13th we became the first insurer to announce that<br />
terrorism was in fact not excluded under our policies, that we would not<br />
seek to apply the war risk exclusion and that we had started paying<br />
claims immediately; other insurers followed. <strong>Chubb</strong>’s decision was a<br />
dramatic turning point — an act that helped prevent a financial panic<br />
which might have exceeded the financial devastation <strong>of</strong> the attack itself.<br />
<strong>Chubb</strong> was also the first to calm Wall Street with our September 13th<br />
estimate <strong>of</strong> net property losses, and on September 20th, we were the first<br />
to publicly estimate all our September 11th losses.<br />
The insurance industry agreed to absorb the losses; we neither<br />
asked for nor received one penny in government subsidies for the claims<br />
arising out <strong>of</strong> September 11th. We did ask for a government insurance<br />
backstop for any future terrorist attacks, but that legislation failed in the<br />
Senate last year and as <strong>of</strong> this writing has not been passed in 2002.<br />
Why is terrorism backstop legislation necessary? <strong>Insurance</strong> is a<br />
vehicle for individuals or companies facing identifiable risks to pool their<br />
resources — in the form <strong>of</strong> premiums — to disperse and diffuse the<br />
impact <strong>of</strong> losses that will be incurred by a few. Terrorism is not a risk that<br />
should be borne and paid for only by property owners in large cities,<br />
businesses targeted by terrorists, or individuals who fly in airplanes or<br />
2
work in urban areas. Clearly, the attack <strong>of</strong> September 11th was directed<br />
not at individuals but at the United States <strong>of</strong> America. Terrorism is a<br />
risk that the government should bear. If the government fails to do so,<br />
the effect will be to impose costs that will discourage socially and<br />
economically desirable behaviors. Already there is anecdotal evidence <strong>of</strong><br />
canceled real estate and other business projects, lay<strong>of</strong>fs and businesses<br />
going without terrorism insurance because it is unavailable or<br />
unaffordable.<br />
As if the September 11th attack were not a big enough financial<br />
drain on <strong>Chubb</strong>, it was followed late in the year with the largest<br />
bankruptcy in United States history — the collapse <strong>of</strong> Enron, for which<br />
<strong>Chubb</strong> recognized $220 million in surety bond losses, net <strong>of</strong> reinsurance.<br />
We are disputing some <strong>of</strong> the claims in court on the grounds <strong>of</strong> fraud.<br />
It is indicative <strong>of</strong> <strong>Chubb</strong>’s underlying earnings power that we were<br />
able to absorb all <strong>of</strong> these losses within one year’s earnings and still turn<br />
a pr<strong>of</strong>it for the year, albeit a relatively small one <strong>of</strong> $111 million.<br />
When I reported to you in these pages a year ago, we were standing<br />
on the threshold <strong>of</strong> an improving insurance market, having led the<br />
market in putting an end to a 12-year downward spiral <strong>of</strong> standard<br />
It is indicative <strong>of</strong> <strong>Chubb</strong>’s<br />
underlying earnings<br />
power that we were<br />
able to absorb the<br />
September 11th and Enron<br />
losses within one year’s<br />
earnings and still turn a<br />
pr<strong>of</strong>it for the year, albeit<br />
a relatively small one <strong>of</strong><br />
$111million.<br />
commercial rates. The attack <strong>of</strong> September 11th, tragic as it was, has<br />
accelerated that improvement. When the industry suffers the loss <strong>of</strong> a<br />
significant chunk <strong>of</strong> its capital base, insurance capacity becomes scarcer.<br />
Together with the need <strong>of</strong> insurers to recoup their losses and rebuild<br />
their capital, the reduced capacity has led to sharply higher rates in most<br />
lines.<br />
Even before September 11th, the industry was severely<br />
underreserved and had negative cash flow. Inadequate prices and<br />
underwriting losses were subsidized by high investment returns and<br />
3
cheap reinsurance. The stock market decline, the recession and rockbottom<br />
yields on fixed-income securities have put an end to high<br />
investment income, and September 11th has put an end to cheap<br />
reinsurance.<br />
So insurers have no choice but to implement substantial increases<br />
In homeowners’<br />
insurance, we will<br />
increase our presence in<br />
those states that permit<br />
us to earn a reasonable<br />
return and scale back<br />
our presence in those<br />
states that do not.<br />
in rates. And, <strong>of</strong> course, that is already happening. For example, <strong>Chubb</strong><br />
Commercial <strong>Insurance</strong> renewal rates in the U.S. were up 18.6% in the<br />
fourth quarter compared to a year earlier. Insurers are also paying closer<br />
attention to underwriting fundamentals <strong>of</strong> risk selection and aggregation,<br />
limits and terms, as well as pricing commensurate with risk.<br />
Sharply higher losses in recent years have demonstrated a need for<br />
rate increases in executive protection and homeowners lines as well, and<br />
in most cases we have been getting them. Equally critical to the<br />
improving market are better terms and conditions.<br />
In <strong>Chubb</strong> Commercial <strong>Insurance</strong>, higher premium rates and<br />
improved loss experience are approaching levels that should enable us to<br />
earn an underwriting pr<strong>of</strong>it. <strong>Chubb</strong> Specialty <strong>Insurance</strong> has been highly<br />
pr<strong>of</strong>itable overall, but margins have narrowed. In certain executive<br />
protection lines, such as employment practices liability, we are stepping<br />
up our programs for small- and medium-sized, privately held companies<br />
and scaling down our exposure to large, publicly held companies <strong>of</strong><br />
10,000 or more employees. These “deep-pocket” companies have become<br />
favorite targets <strong>of</strong> trial attorneys.<br />
The issue in <strong>Chubb</strong> Personal <strong>Insurance</strong> homeowners line is tw<strong>of</strong>old:<br />
inadequate rates and the proliferation <strong>of</strong> water-damage claims,<br />
including mold. The epidemic <strong>of</strong> mold claims in Texas, based largely on<br />
questionable science and emotional appeals to juries, could result in<br />
windfall awards for a few but much higher premiums for all homeowners.<br />
4
We will increase our presence in those states that permit us to earn a<br />
reasonable return and scale back our presence in those states that do not.<br />
In personal lines, we are also working to improve our product mix through<br />
cross-selling to increase the percentage <strong>of</strong> our homeowner policyholders<br />
who also purchase our higher-margin valuable articles policies.<br />
In Europe, our results were poor, but the continental market finally<br />
began to improve in the third quarter <strong>of</strong> <strong>2001</strong>. Capacity is now<br />
constricting, competitors have pulled back, and we are now able to<br />
charge what we need to. The big European multinational insurers and<br />
reinsurers were very slow to react to the need for price and reunderwriting.<br />
They are now trying to price for pr<strong>of</strong>it and at least for the<br />
moment don’t have much in capital gains to cover losses. All across the<br />
European Zone, we have been culling unpr<strong>of</strong>itable accounts and securing<br />
rate increases.<br />
Our Asia and Latin America Zones had another pr<strong>of</strong>itable year. A<br />
flight to quality by customers is already under way, and there is strong<br />
demand for top-quality carriers and first-class claims handling. In the<br />
category <strong>of</strong> longer-term growth opportunities, our Shanghai <strong>of</strong>fice is<br />
open for business, and we have signed a joint venture agreement that we<br />
hope will enable us to begin operations soon in India.<br />
I’ve heard some people question how <strong>Chubb</strong> can be the insurer <strong>of</strong><br />
It’s been a decade and<br />
a half since conditions<br />
in the economy and our<br />
industry have been so<br />
favorable for <strong>Chubb</strong>.<br />
We are now in a position<br />
<strong>of</strong> being able to achieve<br />
substantial growth in<br />
premiums without<br />
compromising underwriting<br />
standards.<br />
choice — indeed the investment and employer <strong>of</strong> choice — over the<br />
next several years, since the rising tide <strong>of</strong> the improving market will<br />
presumably lift all boats.<br />
The answer is, we’re convinced our boat will be lifted higher. It’s<br />
been a decade and a half since conditions in the economy and our<br />
industry have been so favorable for <strong>Chubb</strong>. We are now in a position <strong>of</strong><br />
being able to achieve substantial growth in premiums without<br />
5
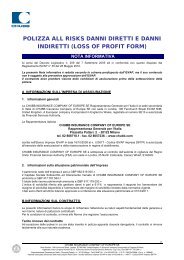
13<br />
Compound <strong>Annual</strong> Growth<br />
in Net Loss Reserves 1991–<strong>2001</strong><br />
8.8%<br />
<strong>Chubb</strong><br />
Industry<br />
1.9%<br />
Our low financial<br />
0<br />
Industry<br />
<strong>Chubb</strong><br />
leverage is another<br />
The 1999 acquisition <strong>of</strong> Executive Risk added approximately $606 million<br />
to <strong>Chubb</strong>'s reserves; the growth rate excluding this acquisition was 8.2%.<br />
Sources: A.M. Best Company, <strong>Insurance</strong> Services Office and <strong>Chubb</strong> estimates.<br />
significant competitive<br />
advantage, because<br />
it’s the most potent<br />
indicator <strong>of</strong> financial<br />
conservatism<br />
and strength.<br />
compromising underwriting standards. As a bastion <strong>of</strong> financial strength<br />
in an industry weakened by losses, we will be in a better position than<br />
most competitors to earn attractive pr<strong>of</strong>its in the coming years.<br />
Let me give you just a few illustrations <strong>of</strong> our superior competitive<br />
position.<br />
• First, loss reserves. I mentioned that the industry is underreserved,<br />
while we are adequately reserved. From 1991 to <strong>2001</strong>, the industry<br />
increased its reserves by an average <strong>of</strong> only 1.9% a year compounded,<br />
compared to <strong>Chubb</strong>’s 8.8% a year.<br />
• Although not up to historic <strong>Chubb</strong> standards, our underwriting<br />
pr<strong>of</strong>itability over the last three years as measured by combined ratio<br />
was 6.4 percentage points better than the industry average.<br />
• Our low financial leverage is another significant competitive<br />
advantage, because it’s the most potent indicator <strong>of</strong> financial<br />
conservatism and strength. When it comes to leverage as indicated by<br />
debt to total capital, we are among the best <strong>of</strong> the major property and<br />
casualty insurers.<br />
6
• Our integrated 31-country branch network gives customers access to<br />
seamless global service, <strong>Chubb</strong> values and local market expertise<br />
wherever they do business.<br />
By far, our biggest competitive advantage is our claim service.<br />
People and companies buy insurance to give them peace <strong>of</strong> mind and to<br />
satisfy certain obligations. The insurance policy is a promise to pay, and<br />
like all promises, it is only as good as the integrity <strong>of</strong> the one who makes<br />
the promise.<br />
Some people keep their promises when they have no alternative.<br />
They sometimes make their counterpart sweat for payment, and then<br />
they pay only as little as they can possibly get away with. Others keep<br />
their promises because they are people <strong>of</strong> integrity and it’s the right thing<br />
to do. We’ve been around for 120 years because the men and women <strong>of</strong><br />
<strong>Chubb</strong> have assimilated and perpetuated our founders’ fundamental<br />
credo: that the promise to pay sometimes imposes a moral obligation that<br />
goes beyond the legal obligation.<br />
Most <strong>of</strong> our agents, brokers and customers know this, and we have<br />
abundant third-party confirmation <strong>of</strong> it. Recently, for example, Forbes fyi<br />
magazine rated ours the best insurance precisely because <strong>of</strong> our no-hassle<br />
claims philosophy.<br />
We are pleased that our long-standing conservative approach to<br />
balance sheet management is suddenly back in style. Despite a year with<br />
unprecedented challenges on the underwriting side <strong>of</strong> the business, we<br />
Despite a year with<br />
unprecedented challenges<br />
on the underwriting side<br />
<strong>of</strong> the business, we<br />
finished the year in very<br />
strong financial shape.<br />
Our reserves are<br />
adequate, our asset<br />
quality is extremely high,<br />
and our cash flow from<br />
operations, including<br />
investment income,<br />
remained robust in <strong>2001</strong>.<br />
finished the year in very strong financial shape. Our reserves are<br />
adequate, our asset quality is extremely high, and our cash flow from<br />
operations, including investment income, remained robust in <strong>2001</strong>. We<br />
also have the best underwriters, actuaries and claims pr<strong>of</strong>essionals in the<br />
industry and the very best agents and brokers selling our products.<br />
7
We believe we are among the very best-positioned companies to<br />
capitalize on the improving market. In 2002, we expect both <strong>Chubb</strong><br />
Commercial and <strong>Chubb</strong> Specialty to produce strong growth and solid<br />
underwriting results. By 2003, we should have <strong>Chubb</strong> Personal humming<br />
as well, with the added lift <strong>of</strong> improving cash flow and investment<br />
In the improving property<br />
and casualty insurance<br />
environment that we see<br />
unfolding over the next<br />
several years, we believe<br />
an ROE <strong>of</strong> 13% to 15%<br />
is achievable, and that in<br />
turn would likely result<br />
in very attractive returns<br />
for long-term investors<br />
income growth.<br />
We’ve come through the down cycle in great shape. In 2002, we<br />
have a good chance <strong>of</strong> achieving our goal <strong>of</strong> a combined ratio <strong>of</strong> 98%<br />
and a return on equity <strong>of</strong> 13%. Over the long term, our goal is to<br />
generate a return on equity that exceeds the rate <strong>of</strong> inflation by at least<br />
10 percentage points and to grow our revenues at double-digit annual<br />
rates. In the improving property and casualty insurance environment<br />
that we see unfolding over the next several years, we believe an ROE <strong>of</strong><br />
13% to 15% is achievable, and that in turn would likely result in very<br />
attractive returns for long-term investors in <strong>Chubb</strong>.<br />
I am grateful to the agents, brokers, employees and investors who<br />
have been critical to our success in working through the down cycle. We<br />
look forward to reaping the rewards <strong>of</strong> the up cycle.<br />
in <strong>Chubb</strong>.<br />
Dean R. O’Hare<br />
Chairman and Chief Executive Officer<br />
March 8, 2002<br />
8
DEFINING THE CHUBB BRAND<br />
Branding is hot. Everywhere you look, brightly colored logos are<br />
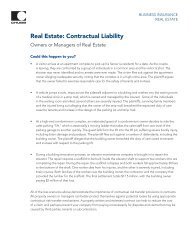
vying for your attention — and your business. Successful<br />
branding requires more than advertising; it is a track record <strong>of</strong><br />
demonstrating qualities that lift the brand above commodity status and<br />
endow it with differentiation in the marketplace. The <strong>Chubb</strong> “C” logo<br />
means more than doing business with a respected insurer, one that’s been<br />
dedicated to understanding and serving its customers for 120 years. It<br />
means award-winning claim service, financial strength, global capability,<br />
underwriting expertise, loss prevention services and a great place to<br />
work. How do our customers define the <strong>Chubb</strong> experience? With simple<br />
yet powerful words: security, stability, expertise, responsiveness and<br />
pr<strong>of</strong>essionalism. How do we know? Because they tell us — in<br />
handwritten notes; in conversations with agents, brokers, underwriters<br />
and service pr<strong>of</strong>essionals; in surveys and in the media.<br />
Consider a few <strong>of</strong> the accolades <strong>Chubb</strong> received in <strong>2001</strong>:<br />
• In a customer claim survey, 96% <strong>of</strong> the respondents rated our claim<br />
service “superior.”<br />
• Local insurance brokers in Australia, Colombia, Puerto Rico and<br />
Spain rated <strong>Chubb</strong> the best claim service provider.<br />
• Forbes fyi magazine rated <strong>Chubb</strong> the “Best <strong>Insurance</strong> Provider<br />
in America.”<br />
• The Financial Times <strong>of</strong> London ranked <strong>Chubb</strong> the third most<br />
respected financial company in the world.<br />
• Global Finance magazine rated <strong>Chubb</strong> the “Best Primary Liability<br />
Insurer” and “Best Directors and Officers Liability Insurer” in<br />
North America.<br />
In a service business, the difference is people. It’s our people who<br />
define the <strong>Chubb</strong> experience and give life to the <strong>Chubb</strong> brand. They’ve<br />
built careers with <strong>Chubb</strong> because they value what we value: honesty,<br />
integrity and fairness. On the next few pages are examples <strong>of</strong> the <strong>Chubb</strong><br />
brand at work and those who make it happen.<br />
9
CHUBB = RELIABILITY<br />
If it’s market data you need, VNU can supply it. The<br />
Netherlands-based international media and information<br />
company gathers intelligence in 100 countries for all types<br />
<strong>of</strong> businesses through its well-known research arms<br />
ACNielsen and Nielsen Media Research. VNU also<br />
produces hundreds <strong>of</strong> trade magazines, directories, trade<br />
shows and Internet sites. Given the number <strong>of</strong> businesses it<br />
owns, only a fast-acting insurer with a global presence can<br />
meet its requirements. “<strong>Chubb</strong> tries to find coverage where<br />
many others try to get away,” says VNU corporate risk<br />
and insurance manager Lou Verstraeten. “The <strong>Chubb</strong> brand<br />
means a company you can rely on.” It’s this reliability,<br />
along with our creativity and attention to service, that<br />
helps us win awards from European agents, brokers and<br />
customers every year.<br />
Photo: Gathered by the banks <strong>of</strong> the Keizersgracht in<br />
Amsterdam are (left to right) Olaf van Leuven, <strong>Chubb</strong>’s<br />
specialty claim unit manager in Amsterdam; Marc Borkink,<br />
corporate treasurer <strong>of</strong> VNU; Lou Verstraeten, corporate risk<br />
and insurance manager <strong>of</strong> VNU; Brian Vosloh, <strong>Chubb</strong>’s<br />
executive protection underwriting manager in Amsterdam;<br />
and Monique Kooijman, <strong>Chubb</strong>’s commercial insurance<br />
manager in Amsterdam.<br />
10
CHUBB = GLOBAL REACH<br />
When you manufacture high-tech scientific instruments<br />
used to discover cures for diseases and to<br />
test Olympic athletes for drug use, you have to be precise<br />
in every aspect <strong>of</strong> your business — including insurance<br />
coverage. For the past 13 years, Thermo Electron<br />
Corporation has relied on <strong>Chubb</strong> for underwriting<br />
flexibility and our network <strong>of</strong> 134 <strong>of</strong>fices in 31 countries<br />
which enable us to serve Thermo wherever it does<br />
business. “<strong>Chubb</strong>’s strong balance sheet, pr<strong>of</strong>essional<br />
employees, underwriting flexibility and range <strong>of</strong> products<br />
are the <strong>Chubb</strong> brand,” declares Richard Somerville, the<br />
Massachusetts-based company’s director <strong>of</strong> risk management.<br />
Insuring a leading provider <strong>of</strong> technology-based<br />
instruments, components and systems is familiar territory<br />
for <strong>Chubb</strong>. For more than 20 years, we’ve been the<br />
property and casualty insurer <strong>of</strong> choice for technology<br />
companies the world over.<br />
Photo: Inspecting a water sample ready for testing in one<br />
<strong>of</strong> Thermo’s elemental analysis machines are Richard<br />
Somerville, Thermo Electron Corporation’s director <strong>of</strong> risk<br />
management; and Jennifer Newsom, <strong>Chubb</strong>’s Northeast<br />
zone umbrella underwriting manager. Behind them are<br />
(clockwise from left) Steve Guariglia, <strong>Chubb</strong>’s Northeast<br />
zone property specialist; Christine Aufiero, <strong>Chubb</strong>’s claim<br />
assistant in Boston; Bryan Clements, <strong>Chubb</strong>’s claim<br />
business consultant in Boston; and Thermo Electron’s CFO,<br />
Theo Melas-Kyriazi.<br />
11
CHUBB = EXPERTISE<br />
The Mouvement des caisses Desjardins knows a<br />
sound investment when it sees one. The largest<br />
financial institution in Quebec runs a credit union serving<br />
five million members and <strong>of</strong>fers a broad range <strong>of</strong> financial<br />
services. Over the past eight years, Desjardins has worked<br />
closely with insurance brokers from Aon-Parizeau Inc.<br />
and Daniel Picard Inc. to build a comprehensive insurance<br />
program with <strong>Chubb</strong>. The draw was <strong>Chubb</strong>’s unique<br />
division which is devoted exclusively to serving financial<br />
institutions. Thanks to <strong>Chubb</strong>’s French language policies,<br />
creative new products and attention to detail, the partnership<br />
is still going strong. That’s no surprise to Desjardins<br />
property and casualty president Jude Martineau, who<br />
equates the <strong>Chubb</strong> brand with expertise in financial<br />
institutions, innovative quality products and respect for<br />
customers — qualities all <strong>of</strong> <strong>Chubb</strong>’s customers can bank on.<br />
Photo: Visiting a Desjardins branch in Montreal are<br />
Suzanne Brisebois, <strong>Chubb</strong>’s financial institutions underwriting<br />
practice leader in Montreal; Jude Martineau,<br />
president and CEO <strong>of</strong> Société de portefeuille du <strong>Group</strong>e<br />
Desjardins, assurances générales; Jean Bertrand, <strong>Chubb</strong>’s<br />
Montreal branch manager; and Michel Pontbriand,<br />
manager <strong>of</strong> major accounts at Desjardins.<br />
12
CHUBB = THE MASTERPIECE POLICY<br />
Many <strong>of</strong> the world’s privately owned masterpieces<br />
are protected by the only coverage that’s fitting —<br />
Masterpiece ® from <strong>Chubb</strong>. When James and Candice<br />
Unruh <strong>of</strong> Arizona were scouting for insurance to protect<br />
their eclectic art collection, tastefully appointed homes and<br />
luxury autos, they turned to <strong>Chubb</strong>. For us, insuring homes<br />
and possessions is both an art and a labor <strong>of</strong> love. Our<br />
people appreciate the value <strong>of</strong> precious possessions and<br />
our customers’ attachment to them. Our Masterpiece suite<br />
<strong>of</strong> products <strong>of</strong>fers insurance for primary and vacation<br />
homes and their contents, automobiles, watercraft, art,<br />
antiques, collectibles and personal liability. What makes<br />
our homeowners’ coverage unique is its guaranteed<br />
replacement cost features and the valuation and security<br />
recommendations <strong>of</strong> our home appraisal service. In <strong>2001</strong>,<br />
we launched chubbcollectors.com, an online newsletter for<br />
customers interested in collecting and preserving treasures.<br />
This attention to detail earns us praise from customers,<br />
agents and brokers around the world.<br />
13
CHUBB = LOSS PREVENTION SERVICES<br />
No matter what your preference — black or green,<br />
pitted or not, small or super colossal — Bell-Carter<br />
Foods, Inc. has the olive for you. The 90-year-old familyowned<br />
company processes and packs olives under its<br />
major brand name, Lindsay, and some 200 store brands<br />
for supermarkets and the food service industry. What<br />
makes Bell-Carter’s olives taste so special is the care its<br />
450 employees put into cleaning, curing and pitting the<br />
delicate fruit. For 17 years, <strong>Chubb</strong> has provided excellent<br />
loss prevention services, prompt and fair claim handling<br />
and knowledgeable underwriters familiar with the food<br />
processing industry. For CFO Mike Hoversen, <strong>Chubb</strong> means<br />
“quality assured.”<br />
Photo: Surrounded by olives ready for processing at Bell-<br />
Carter’s plant in Corning, California, are Eric Roberts,<br />
managing director <strong>of</strong> risk management services for Willis<br />
<strong>Insurance</strong> Services <strong>of</strong> California; Mike Hoversen, chief<br />
financial <strong>of</strong>ficer <strong>of</strong> Bell-Carter; and from <strong>Chubb</strong>: Karla<br />
Holland, Northwest claim business consultant; Bob Bachtel,<br />
loss control consultant in Sacramento; and Lindsey<br />
Humphrey, commercial underwriter in San Francisco.<br />
14
CHUBB = STABILITY<br />
When the National Hockey League needs peace <strong>of</strong><br />
mind <strong>of</strong>f the ice, it turns to <strong>Chubb</strong> for insurance<br />
coverage through its broker BWD <strong>Group</strong> LLC. The league<br />
<strong>of</strong>fice and 30 U.S. and Canadian teams benefit from an<br />
insurance program managed by <strong>Chubb</strong>’s seasoned<br />
underwriters, loss control specialists and claim<br />
representatives — all <strong>of</strong> whom understand that hockey is<br />
more than a game. For the NHL, it’s a sophisticated<br />
business focused on managing and promoting one <strong>of</strong> the<br />
fastest-growing pr<strong>of</strong>essional sports. What also makes the<br />
<strong>Chubb</strong> and NHL relationship work, according to NHL<br />
Commissioner Gary Bettman, is the power <strong>of</strong> the <strong>Chubb</strong><br />
brand, which he defines as stability, reliability and<br />
pr<strong>of</strong>essionalism. It’s this hat trick <strong>of</strong> qualities that makes<br />
<strong>Chubb</strong> the home-team favorite with the NHL and other<br />
sports and entertainment enterprises around the world.<br />
Photo: At the National Hockey League’s <strong>of</strong>fice and licensed<br />
merchandise showroom in New York City are league<br />
commissioner Gary Bettman; George Marts, manager <strong>of</strong><br />
<strong>Chubb</strong>’s Long Island <strong>of</strong>fice; and Marc Blumencranz,<br />
executive vice president <strong>of</strong> BWD <strong>Group</strong> LLC.<br />
15
CHUBB = UNPARALLELED CLAIM SERVICE<br />
In <strong>2001</strong>, Australian insurance brokers voted <strong>Chubb</strong><br />
<strong>Insurance</strong> Company <strong>of</strong> Australia the best overall underwriter<br />
for the third consecutive year. With this reputation,<br />
it’s no wonder that the Westfield <strong>Group</strong>, which funds,<br />
creates and manages regional shopping centers, sought<br />
insurance from <strong>Chubb</strong> to protect its operations in Australia,<br />
New Zealand and the U.K. <strong>Chubb</strong>’s capacity, long-term<br />
commitment and interactive approach to claims settlement<br />
issues have made the relationship work for more than<br />
10 years. How does Westfield, a global leader in its<br />
industry, define the <strong>Chubb</strong> brand? Certainty, security and<br />
a willingness to engage in an open, interactive business<br />
partnership — qualities you would expect from an awardwinning<br />
insurer.<br />
Photo: Meeting at Westfield Shoppingtown in Hornsby,<br />
New South Wales, are David Bidmead, director, Marsh<br />
Inc.; Eamonn Cunningham, Westfield’s vice president <strong>of</strong><br />
Global Risk Management; Dermot McComiskey, <strong>Chubb</strong>’s<br />
regional commercial insurance manager for Australia;<br />
Scott Leney, managing principal, Marsh Inc.; and David<br />
Nyholm, <strong>Chubb</strong>’s claim business consultant in Sydney.<br />
16
CHUBB = FINANCIAL STRENGTH<br />
Protecting the reputation <strong>of</strong> its top premium spirits,<br />
wine and quick-service restaurant brands is the key<br />
to Allied Domecq’s global risk management program. The<br />
global company produces, markets and distributes such<br />
brands as Ballantine’s, Beefeater, Kahlúa, Canadian Club,<br />
Mumm, Perrier Jouët, Montana, Clos du Bois, Dunkin’<br />
Donuts, Baskin-Robbins and Togo’s. For more than 10<br />
years, <strong>Chubb</strong> has served up a cutting-edge risk management<br />
program for Allied Domecq with outstanding claim<br />
and loss prevention services. “We rely on <strong>Chubb</strong> to act<br />
swiftly, effectively and pr<strong>of</strong>essionally,” says Mark Clifford,<br />
Allied Domecq’s global risk manager. “To me, the <strong>Chubb</strong><br />
brand means security.”<br />
Photo: At Allied Domecq’s Scotch whisky aging facility<br />
in Dumbuck, Scotland, are Stuart Payne, <strong>Chubb</strong>’s claim<br />
business consultant in Birmingham, England; Mark Clifford,<br />
Allied Domecq’s group risk manager; and Mark Appleton,<br />
<strong>Chubb</strong>’s risk management accounts manager in London.<br />
17
CHUBB = GREAT PLACE TO WORK<br />
Jess Chang<br />
Meet a few <strong>of</strong> our<br />
employees who exemplify<br />
the <strong>Chubb</strong> brand.<br />
Jess Chang has been with <strong>Chubb</strong><br />
only two years, but already she<br />
says it’s the best job she’s ever had.<br />
In her role as an actuary for<br />
<strong>Chubb</strong>’s reinsurance arm,<br />
<strong>Chubb</strong>Re, in Bernardsville, New<br />
Jersey, Jess meets customers firsthand,<br />
getting a chance to learn<br />
how they operate and think so she<br />
can properly price and analyze the<br />
risk. Her 15 years <strong>of</strong> experience in<br />
the reinsurance industry are put to<br />
work every day. For the customer,<br />
the opportunity to discuss issues<br />
with Jess means a higher comfort<br />
level with <strong>Chubb</strong>Re and better<br />
service. And for Jess, it means a<br />
more interesting and rewarding<br />
career.<br />
With a Ph.D. in economics,<br />
Anton Theunissen serves<br />
as senior vice president and chief<br />
research <strong>of</strong>ficer for <strong>Chubb</strong><br />
Financial Solutions Inc., the<br />
<strong>Chubb</strong> subsidiary that <strong>of</strong>fers a<br />
broad range <strong>of</strong> insurance and<br />
capital market techniques to<br />
address complex operational and<br />
financial risks. Based in New York<br />
City, Anton works with a team <strong>of</strong><br />
CFSI researchers, underwriters<br />
and lawyers to analyze trades and<br />
perform asset pricing for<br />
sophisticated financial customers.<br />
Although CFSI is only two years<br />
old, it is a well-respected factor in<br />
the marketplace, thanks to<br />
employees like Anton and the<br />
support it receives from The<br />
<strong>Chubb</strong> Corporation.<br />
Anton Theunissen<br />
Mary Sklarski<br />
Agood businessperson can<br />
learn anything. That’s<br />
Mary Sklarski’s motto not only<br />
when she’s recruiting for <strong>Chubb</strong>’s<br />
Portland, Oregon, <strong>of</strong>fice, but also<br />
when she’s managing her own<br />
career. In 21 years with <strong>Chubb</strong>,<br />
Mary has held nine different<br />
positions. With each new<br />
assignment, she has broadened her<br />
experience and developed new<br />
skills — underwriting, marketing<br />
and branch management. For this<br />
vice president and branch<br />
manager, being respected for her<br />
knowledge and having the ability<br />
to stretch to a new position has<br />
made her <strong>Chubb</strong> career a<br />
rewarding one.<br />
18
From southern Europe to<br />
Latin America, Marta Gomez<br />
Llorente has been helping to build<br />
up <strong>Chubb</strong>’s specialty insurance<br />
business for more than 12 years.<br />
Challenged today by the diverse<br />
legal, economic and cultural issues<br />
<strong>of</strong> Latin America, Marta and her<br />
staff visit customers and brokers<br />
throughout the region to educate<br />
them on the risks they face and<br />
how the <strong>Chubb</strong> difference can<br />
help protect them. What makes<br />
<strong>Chubb</strong> special, according to<br />
Marta, is the way we treat our<br />
people — valuing good ideas and<br />
providing challenges. It’s also the<br />
way we treat our customers —<br />
taking time to understand their<br />
businesses and staying loyal to our<br />
principles and values. This is why<br />
brokers and customers respect and<br />
trust us, and why Marta and her<br />
team are passionate about working<br />
for <strong>Chubb</strong>.<br />
Patrick Fouché<br />
After a four-year internship<br />
with <strong>Chubb</strong> as a college<br />
student, Patrick Fouché chose to<br />
continue working for <strong>Chubb</strong> as an<br />
underwriting trainee. That was 10<br />
years ago. Today, as a vice<br />
president and marketing manager,<br />
he concentrates on building<br />
relationships with agents and<br />
brokers in the northeastern U.S.<br />
to increase <strong>Chubb</strong>’s pr<strong>of</strong>itability<br />
and growth. What keeps him<br />
motivated? According to Patrick,<br />
it’s <strong>Chubb</strong>’s industry leadership,<br />
pr<strong>of</strong>essional distribution force and<br />
talented staff. It’s also <strong>Chubb</strong>’s<br />
values <strong>of</strong> integrity and fairness<br />
which make it easier to handle<br />
any type <strong>of</strong> business challenge<br />
that comes his way.<br />
Maggie Wong regards her<br />
agents, brokers and<br />
customers as friends. As the<br />
marine underwriting manager for<br />
the Greater China region, she<br />
stays in constant contact with<br />
them. When faced with a<br />
problem, she puts herself in her<br />
customer’s shoes to come up with<br />
the solution. It’s an approach<br />
that’s worked for Maggie for some<br />
eight years as she’s advanced her<br />
career from local department<br />
manager to regional manager.<br />
What’s also helped her advance<br />
are <strong>Chubb</strong>’s clear guidelines and<br />
support from managers who<br />
encourage her to choose quality<br />
customers. For Maggie, that means<br />
she’s able to focus on doing what’s<br />
right for her customers and for<br />
<strong>Chubb</strong>.<br />
Maggie Wong<br />
Marta Gomez Llorente<br />
19
FINANCIAL REPORTING RESPONSIBILITY<br />
Management is responsible for the integrity <strong>of</strong> the<br />
Ñnancial information included in this annual report and<br />
for ascertaining that such information presents fairly<br />
the Ñnancial position and operating results <strong>of</strong> the<br />
Corporation. The accompanying consolidated Ñnancial<br />
statements have been prepared in conformity with<br />
accounting principles generally accepted in the United<br />
States. Such statements include informed estimates and<br />
judgments <strong>of</strong> management for those transactions that<br />
are not yet complete or for which the ultimate eÅects<br />
cannot be precisely determined. Financial information<br />
presented elsewhere in this annual report is consistent<br />
with that in the Ñnancial statements.<br />
The accounting systems and internal accounting<br />
controls <strong>of</strong> the Corporation are designed to provide<br />
reasonable assurance that assets are safeguarded against<br />
losses from unauthorized use or disposition, that<br />
transactions are executed in accordance with<br />
management's authorization and that the Ñnancial<br />
records are reliable for preparing Ñnancial statements<br />
and maintaining accountability for assets. QualiÑed<br />
personnel throughout the organization maintain and<br />
monitor these internal accounting controls on an<br />
ongoing basis. In addition, the Corporation's Internal<br />
Audit Department systematically reviews these<br />
controls, evaluates their adequacy and eÅectiveness and<br />
reports thereon.<br />
The Corporation engages Ernst & Young LLP as<br />
independent auditors to audit its Ñnancial statements<br />
and express their opinion thereon. They have full<br />
access to each member <strong>of</strong> management in conducting<br />
their audits. Such audits are conducted in accordance<br />
with auditing standards generally accepted in the<br />
United States and include a review and evaluation <strong>of</strong><br />
the system <strong>of</strong> internal accounting controls, tests <strong>of</strong> the<br />
accounting records and other auditing procedures<br />
they consider necessary to express their opinion on the<br />
consolidated Ñnancial statements.<br />
The Corporation's accounting policies and internal<br />
controls are under the general oversight <strong>of</strong> the Board <strong>of</strong><br />
Directors acting through its Audit Committee. This<br />
Committee is composed entirely <strong>of</strong> Directors who are<br />
not oÇcers or employees <strong>of</strong> the Corporation. The<br />
Committee meets regularly with management, the<br />
internal auditors and the independent auditors to<br />
review the accounting principles and practices<br />
employed by the Corporation and to discuss auditing,<br />
internal control and Ñnancial reporting matters. Both<br />
the internal and independent auditors have, at all times,<br />
unrestricted access to the Audit Committee, without<br />
members <strong>of</strong> management present, to discuss the<br />
results <strong>of</strong> their audits, their evaluations <strong>of</strong> the adequacy<br />
<strong>of</strong> the Corporation's internal accounting controls and<br />
the quality <strong>of</strong> the Corporation's Ñnancial reporting,<br />
and any other matter that they believe should be<br />
brought to the attention <strong>of</strong> the Committee.<br />
20
SUPPLEMENTARY FINANCIAL DATA<br />
Property and Casualty <strong>Insurance</strong><br />
In Millions<br />
Years Ended December 31<br />
<strong>2001</strong>(a) 2000 1999<br />
Underwriting<br />
Net Premiums WrittenÏÏÏÏÏÏÏÏÏÏÏÏÏÏÏÏÏÏÏÏÏÏÏÏÏÏÏÏÏ $6,961.5 $6,333.2 $5,701.1<br />
Increase in Unearned PremiumsÏÏÏÏÏÏÏÏÏÏÏÏÏÏÏÏÏÏÏÏÏ (305.1) (187.3) (49.1)<br />
Premiums Earned ÏÏÏÏÏÏÏÏÏÏÏÏÏÏÏÏÏÏÏÏÏÏÏÏÏÏÏÏÏÏÏÏÏ 6,656.4 6,145.9 5,652.0<br />
Claims and Claim ExpensesÏÏÏÏÏÏÏÏÏÏÏÏÏÏÏÏÏÏÏÏÏÏÏÏÏ 5,357.4 4,127.7 3,942.0<br />
Operating Costs and Expenses ÏÏÏÏÏÏÏÏÏÏÏÏÏÏÏÏÏÏÏÏÏÏ 2,260.8 2,076.6 1,841.5<br />
Decrease (Increase) in Deferred Policy<br />
Acquisition Costs ÏÏÏÏÏÏÏÏÏÏÏÏÏÏÏÏÏÏÏÏÏÏÏÏÏÏÏÏÏÏÏ (86.8) (62.3) 4.2<br />
Dividends to Policyholders ÏÏÏÏÏÏÏÏÏÏÏÏÏÏÏÏÏÏÏÏÏÏÏÏÏ 28.5 27.5 43.1<br />
Underwriting Loss ÏÏÏÏÏÏÏÏÏÏÏÏÏÏÏÏÏÏÏÏÏÏÏÏÏÏÏÏÏÏÏ (903.5) (23.6) (178.8)<br />
Investments<br />
Investment Income Before Expenses ÏÏÏÏÏÏÏÏÏÏÏÏÏÏÏÏÏ 914.7 890.8 832.6<br />
Investment Expenses ÏÏÏÏÏÏÏÏÏÏÏÏÏÏÏÏÏÏÏÏÏÏÏÏÏÏÏÏÏÏ 12.1 11.6 11.6<br />
Investment Income ÏÏÏÏÏÏÏÏÏÏÏÏÏÏÏÏÏÏÏÏÏÏÏÏÏÏÏÏÏÏÏ 902.6 879.2 821.0<br />
Amortization <strong>of</strong> Goodwill and Other Charges ÏÏÏÏÏÏÏÏÏÏÏ (52.3) (52.2) (16.0)<br />
Property and Casualty IncomeÏÏÏÏÏÏÏÏÏÏÏÏÏÏÏÏÏÏÏÏÏÏÏ (53.2) 803.4 626.2<br />
Corporate and Other ÏÏÏÏÏÏÏÏÏÏÏÏÏÏÏÏÏÏÏÏÏÏÏÏÏÏÏÏÏÏÏÏÏ (13.6) (3.9) (3.5)<br />
CONSOLIDATED OPERATING INCOME (LOSS)<br />
BEFORE INCOME TAX ÏÏÏÏÏÏÏÏÏÏÏÏÏÏÏÏÏÏÏÏÏÏÏÏÏÏÏÏ (66.8) 799.5 622.7<br />
Federal and Foreign Income Tax (Credit) ÏÏÏÏÏÏÏÏÏÏÏÏÏÏÏÏ (177.8) 118.4 57.4<br />
CONSOLIDATED OPERATING INCOME ÏÏÏÏÏÏÏÏÏÏÏÏÏ 111.0 681.1 565.3<br />
Realized Investment Gains After Income Tax ÏÏÏÏÏÏÏÏÏÏÏ .5 33.5 55.8<br />
CONSOLIDATED NET INCOME ÏÏÏÏÏÏÏÏÏÏÏÏÏÏÏÏÏÏÏÏÏ $ 111.5 $ 714.6 $ 621.1<br />
Property and Casualty Investment Income<br />
After Income Tax ÏÏÏÏÏÏÏÏÏÏÏÏÏÏÏÏÏÏÏÏÏÏÏÏÏÏÏÏÏÏÏÏÏÏ $ 749.1 $ 735.2 $ 691.9<br />
Diluted Earnings Per Share Data<br />
Consolidated Operating Income ÏÏÏÏÏÏÏÏÏÏÏÏÏÏÏÏÏÏÏÏÏÏÏ $ .63 $ 3.82 $ 3.33<br />
Consolidated Net Income ÏÏÏÏÏÏÏÏÏÏÏÏÏÏÏÏÏÏÏÏÏÏÏÏÏÏÏÏ .63 4.01 3.66<br />
(a) Results for <strong>2001</strong> include net costs <strong>of</strong> $645.0 million ($420.0 million after-tax or $2.39 per share) related to the September 11 attack and net<br />
surety bond losses <strong>of</strong> $220.0 million ($143.0 million after-tax or $0.81 per share) related to the bankruptcy <strong>of</strong> Enron Corp.<br />
21
PROPERTY AND CASUALTY UNDERWRITING RESULTS<br />
Net Premiums Written (In Millions <strong>of</strong> Dollars)<br />
<strong>2001</strong>(a) 2000 1999 1998 1997<br />
Personal <strong>Insurance</strong><br />
Automobile ÏÏÏÏÏÏÏÏÏÏÏÏÏÏÏÏÏÏÏÏÏÏÏÏÏÏÏÏÏÏÏÏÏÏ $ 480.2 $ 403.3 $ 346.1 $ 309.4 $ 298.6<br />
HomeownersÏÏÏÏÏÏÏÏÏÏÏÏÏÏÏÏÏÏÏÏÏÏÏÏÏÏÏÏÏÏÏÏÏ 1,065.4 927.6 826.7 735.1 697.4<br />
OtherÏÏÏÏÏÏÏÏÏÏÏÏÏÏÏÏÏÏÏÏÏÏÏÏÏÏÏÏÏÏÏÏÏÏÏÏÏÏÏ 435.5 391.9 351.7 320.2 310.4<br />
Total PersonalÏÏÏÏÏÏÏÏÏÏÏÏÏÏÏÏÏÏÏÏÏÏÏÏÏÏÏÏ 1,981.1 1,722.8 1,524.5 1,364.7 1,306.4<br />
Commercial <strong>Insurance</strong><br />
Multiple Peril ÏÏÏÏÏÏÏÏÏÏÏÏÏÏÏÏÏÏÏÏÏÏÏÏÏÏÏÏÏÏÏÏ 767.4 734.8 754.5 817.8 843.7<br />
CasualtyÏÏÏÏÏÏÏÏÏÏÏÏÏÏÏÏÏÏÏÏÏÏÏÏÏÏÏÏÏÏÏÏÏÏÏÏÏ 799.8 781.3 828.2 900.5 915.8<br />
Workers' Compensation ÏÏÏÏÏÏÏÏÏÏÏÏÏÏÏÏÏÏÏÏÏÏÏ 355.1 320.9 299.5 320.8 296.7<br />
Property and Marine ÏÏÏÏÏÏÏÏÏÏÏÏÏÏÏÏÏÏÏÏÏÏÏÏÏÏ 568.5 503.6 498.4 524.0 583.0<br />
Total Commercial ÏÏÏÏÏÏÏÏÏÏÏÏÏÏÏÏÏÏÏÏÏÏÏÏ 2,490.8 2,340.6 2,380.6 2,563.1 2,639.2<br />
Specialty <strong>Insurance</strong><br />
Executive Protection ÏÏÏÏÏÏÏÏÏÏÏÏÏÏÏÏÏÏÏÏÏÏÏÏÏÏ 1,348.7 1,274.7 1,038.0 916.5 861.3<br />
Financial Institutions ÏÏÏÏÏÏÏÏÏÏÏÏÏÏÏÏÏÏÏÏÏÏÏÏÏÏ 534.2 504.9 385.8 391.6 384.3<br />
OtherÏÏÏÏÏÏÏÏÏÏÏÏÏÏÏÏÏÏÏÏÏÏÏÏÏÏÏÏÏÏÏÏÏÏÏÏÏÏÏ 606.7 490.2 372.2 267.6 256.8<br />
Total Specialty ÏÏÏÏÏÏÏÏÏÏÏÏÏÏÏÏÏÏÏÏÏÏÏÏÏÏÏ 2,489.6 2,269.8 1,796.0 1,575.7 1,502.4<br />
Total ÏÏÏÏÏÏÏÏÏÏÏÏÏÏÏÏÏÏÏÏÏÏÏÏÏÏÏÏÏÏÏÏÏÏÏ $6,961.5 $6,333.2 $5,701.1 $5,503.5 $5,448.0<br />
Combined Loss and Expense Ratios<br />
Personal <strong>Insurance</strong><br />
Automobile ÏÏÏÏÏÏÏÏÏÏÏÏÏÏÏÏÏÏÏÏÏÏÏÏÏÏÏÏÏÏÏÏÏÏ 99.8% 95.9% 91.8% 89.2% 86.6%<br />
HomeownersÏÏÏÏÏÏÏÏÏÏÏÏÏÏÏÏÏÏÏÏÏÏÏÏÏÏÏÏÏÏÏÏÏ 112.6 100.8 97.9 90.8 88.9<br />
OtherÏÏÏÏÏÏÏÏÏÏÏÏÏÏÏÏÏÏÏÏÏÏÏÏÏÏÏÏÏÏÏÏÏÏÏÏÏÏÏ 75.8 71.4 69.4 70.2 66.9<br />
Total PersonalÏÏÏÏÏÏÏÏÏÏÏÏÏÏÏÏÏÏÏÏÏÏÏÏÏÏÏÏ 101.3 92.9 89.9 85.6 83.1<br />
Commercial <strong>Insurance</strong><br />
Multiple Peril ÏÏÏÏÏÏÏÏÏÏÏÏÏÏÏÏÏÏÏÏÏÏÏÏÏÏÏÏÏÏÏÏ 109.6 114.5 130.4 122.7 117.1<br />
CasualtyÏÏÏÏÏÏÏÏÏÏÏÏÏÏÏÏÏÏÏÏÏÏÏÏÏÏÏÏÏÏÏÏÏÏÏÏÏ 114.9 118.7 119.3 114.6 113.5<br />
Workers' Compensation ÏÏÏÏÏÏÏÏÏÏÏÏÏÏÏÏÏÏÏÏÏÏÏ 92.9 99.8 112.6 111.5 105.0<br />
Property and Marine ÏÏÏÏÏÏÏÏÏÏÏÏÏÏÏÏÏÏÏÏÏÏÏÏÏÏ 115.8 115.0 111.3 116.5 105.5<br />
Total Commercial ÏÏÏÏÏÏÏÏÏÏÏÏÏÏÏÏÏÏÏÏÏÏÏÏ 110.5 114.2 120.4 117.2 112.0<br />
Specialty <strong>Insurance</strong><br />
Executive Protection ÏÏÏÏÏÏÏÏÏÏÏÏÏÏÏÏÏÏÏÏÏÏÏÏÏÏ 94.0 86.2 84.2 75.3 74.5<br />
Financial Institutions ÏÏÏÏÏÏÏÏÏÏÏÏÏÏÏÏÏÏÏÏÏÏÏÏÏÏ 187.7 90.6 95.5 86.7 91.5<br />
OtherÏÏÏÏÏÏÏÏÏÏÏÏÏÏÏÏÏÏÏÏÏÏÏÏÏÏÏÏÏÏÏÏÏÏÏÏÏÏÏ 146.2 105.5 92.9 100.9 85.0<br />
Total Specialty ÏÏÏÏÏÏÏÏÏÏÏÏÏÏÏÏÏÏÏÏÏÏÏÏÏÏÏ 125.5 91.3 88.5 82.5 80.7<br />
Total ÏÏÏÏÏÏÏÏÏÏÏÏÏÏÏÏÏÏÏÏÏÏÏÏÏÏÏÏÏÏÏÏÏÏÏ 113.4% 100.4% 102.8% 99.8% 96.9%<br />
(a) Underwriting results for <strong>2001</strong> excluding the eÅects <strong>of</strong> the September 11 attack are presented on page 26.<br />
The combined loss and expense ratio, expressed as a percentage, is the key measure <strong>of</strong> underwriting proÑtability traditionally used in the property and<br />
casualty insurance business. It is the sum <strong>of</strong> the ratio <strong>of</strong> losses to premiums earned plus the ratio <strong>of</strong> underwriting expenses to premiums written after<br />
reducing both premium amounts by dividends to policyholders.<br />
The underwriting results for prior years include certain reclassiÑcations to conform with the <strong>2001</strong> presentation, which more closely reÖects the way<br />
the property and casualty business is now managed. The total net premiums written and combined loss and expense ratios are not aÅected.<br />
22
MANAGEMENT'S DISCUSSION AND ANALYSIS OF<br />
FINANCIAL CONDITION AND RESULTS OF OPERATIONS<br />
Management's discussion and analysis <strong>of</strong> Ñnancial condition<br />
and results <strong>of</strong> operations addresses the Ñnancial<br />
condition <strong>of</strong> The <strong>Chubb</strong> Corporation (the Corporation)<br />
and its subsidiaries as <strong>of</strong> December 31, <strong>2001</strong><br />
compared with December 31, 2000 and the Corporation's<br />
results <strong>of</strong> operations for each <strong>of</strong> the three years in<br />
the period ended December 31, <strong>2001</strong>. This discussion<br />
should be read in conjunction with the consolidated<br />
Ñnancial statements and related notes on pages 48<br />
through 71 and other supplementary Ñnancial informa-<br />
tion on pages 21, 22 and 44 through 47.<br />
Cautionary Statement Regarding<br />
Forward-Looking Information<br />
Certain <strong>of</strong> the statements contained in this <strong>Annual</strong><br />
<strong>Report</strong> or in Part I <strong>of</strong> the Corporation's Form 10-K<br />
(other than statements <strong>of</strong> historical fact) may be<br />
considered to be ""forward looking statements'' as that<br />
term is deÑned in the Private Securities Litigation<br />
Reform Act <strong>of</strong> 1995. Words or phrases such as ""will<br />
result'', ""is expected to'', ""will continue'', ""is anticipated'',<br />
or similar expressions are intended to identify<br />
forward looking statements, although not all forward<br />
looking statements contain those identifying words.<br />
Such forward looking statements are subject to certain<br />
risks, uncertainties and assumptions about our business.<br />
The factors that could cause actual results to diÅer<br />
materially from those suggested by any such statements<br />
include but are not limited to those discussed or<br />
identiÑed from time to time in the Corporation's public<br />
Ñlings with the Securities and Exchange Commission<br />
and speciÑcally to risks or uncertainties associated with<br />
any one or more <strong>of</strong> the following:<br />
‚ premium price increases and proÑtability or growth<br />
estimates overall or by lines <strong>of</strong> business, and related<br />
expectations with respect to the timing and terms <strong>of</strong><br />
any required regulatory approvals;<br />
‚ our expectations with respect to cash Öow projections<br />
and investment income and with respect to other<br />
income;<br />
‚ the adequacy <strong>of</strong> loss reserves including:<br />
Ó our expectations relating to insurance losses from<br />
the September 11 attack and related reinsurance<br />
recoverables;<br />
Ó any impact from the bankruptcy protection sought<br />
by various asbestos producers and other related<br />
businesses;<br />
Ó any changes in judicial or legislative decisions<br />
relating to coverage and liability for asbestos and<br />
toxic waste claims;<br />
‚ Enron-related eÅects, including:<br />
Ó the eÅects on the energy markets and the companies<br />
that participate in them;<br />
Ó the eÅects on the capital markets and the markets<br />
for directors and oÇcers and errors and omissions<br />
insurance;<br />
Ó claims and litigation arising out <strong>of</strong> accounting<br />
disclosures by other companies;<br />
Ó any legislative or regulatory proposals or changes;<br />
‚ general economic conditions including:<br />
Ó changes in interest rates and the performance <strong>of</strong><br />
the Ñnancial markets;<br />
Ó changes in domestic and foreign laws, regulations<br />
and taxes;<br />
Ó changes in competition and pricing environments;<br />
Ó regional or general changes in asset valuations;<br />
Ó the occurrence <strong>of</strong> signiÑcant weather-related or<br />
other natural or human-made disasters;<br />
‚ the availability <strong>of</strong> primary and reinsurance coverage,<br />
including the implications relating to the absence <strong>of</strong><br />
terrorism legislation;<br />
Ó the inability to reinsure certain risks economically;<br />
‚ global political conditions and the occurrence <strong>of</strong> any Ó changes in the litigation environment;<br />
terrorist attacks, including any nuclear, biological or Ó general market conditions.<br />
chemical events;<br />
23
The Corporation assumes no obligation to update any<br />
forward looking information set forth in this <strong>Annual</strong><br />
<strong>Report</strong> or in Part I <strong>of</strong> the Corporation's Form 10-K,<br />
which speak as <strong>of</strong> the respective dates there<strong>of</strong>.<br />
Critical Accounting Estimates and Judgments<br />
with operating income <strong>of</strong> $803 million in 2000 and<br />
$626 million in 1999. Excluding the net costs <strong>of</strong><br />
$645 million related to the September 11 attack and the<br />
net surety bond losses <strong>of</strong> $220 million related to Enron,<br />
operating income before taxes was $812 million in <strong>2001</strong>,<br />
similar to that in 2000. The higher earnings in 2000<br />
compared with 1999 were due primarily to an improvement<br />
in underwriting results, caused in large part by<br />
substantially lower catastrophe losses.<br />
The consolidated Ñnancial statements include amounts<br />
based on informed estimates and judgments <strong>of</strong> manage-<br />
ment for those transactions that are not yet complete or<br />
for which the ultimate eÅects are uncertain. Such<br />
A summary <strong>of</strong> our property and casualty insurance<br />
estimates and judgments aÅect the reported amounts in<br />
operating results for the years ended December 31,<br />
the Ñnancial statements. Those estimates and judgments<br />
<strong>2001</strong>, 2000 and 1999 is included in the supplementary<br />
that were most critical to the preparation <strong>of</strong> the Ñnancial<br />
Ñnancial data on page 21. The following summary <strong>of</strong> our<br />
statements involved the adequacy <strong>of</strong> loss reserves and, to<br />
property and casualty insurance operating results for<br />
a lesser extent, the fair value <strong>of</strong> credit derivative<br />
<strong>2001</strong> also presents such results excluding the impact <strong>of</strong><br />
obligations and the recoverability <strong>of</strong> the carrying value <strong>of</strong><br />
the September 11 attack and shows the impact <strong>of</strong> the<br />
real estate properties. These estimates and judgments are<br />
September 11 attack separately.<br />
discussed within the following analysis <strong>of</strong> our results <strong>of</strong><br />
operations. If diÅerent estimates and judgments had<br />
Excluding<br />
been applied, materially diÅerent amounts might have<br />
Impact <strong>of</strong> Impact <strong>of</strong><br />
been reported in the Ñnancial statements.<br />
Sept. 11 Sept. 11<br />
Total Attack Attack<br />
(in millions)<br />
Earnings Summary<br />
Underwriting<br />
Net premiums written ÏÏÏÏÏÏÏ $6,961 $ 30 $6,931<br />
Operating income, which excludes realized investment Increase in unearned premiums (305) (305)<br />
gains and losses, was $111 million in <strong>2001</strong> compared Premiums earned ÏÏÏÏÏÏÏÏÏ 6,656 30 6,626<br />
with $681 million in 2000 and $565 million in 1999.<br />
Claims and claim expenses ÏÏÏÏ 5,357 665 4,692<br />
Operating income in <strong>2001</strong> was adversely aÅected by two Operating costs and expensesÏÏ 2,261 2,261<br />
large loss events. In the third quarter, we incurred net Increase in deferred policy<br />
costs <strong>of</strong> $645 million, or $420 million after-tax, related<br />
acquisition costs ÏÏÏÏÏÏÏÏÏÏ (87) (87)<br />
to the September 11 attack in the United States. Then,<br />
Dividends to policyholders ÏÏÏÏ 29 29<br />
in the fourth quarter, we recognized net surety bond<br />
Total claims and expenses ÏÏ 7,560 665 6,895<br />
losses <strong>of</strong> $220 million, or $143 million after-tax, arising<br />
Underwriting loss ÏÏÏÏÏÏÏÏÏ (904) (635) (269)<br />
from the bankruptcy <strong>of</strong> Enron Corp.<br />
Investment income ÏÏÏÏÏÏÏÏÏÏÏÏ 903 903<br />
Amortization <strong>of</strong> goodwill and<br />
other chargesÏÏÏÏÏÏÏÏÏÏÏÏÏÏÏ (52) (10) (42)<br />
Net income, which includes realized investment gains<br />
Property and casualty income<br />
and losses, was $112 million in <strong>2001</strong> compared with<br />
(loss) before tax ÏÏÏÏÏÏÏÏ $ (53) $(645) $ 592<br />
$715 million in 2000 and $621 million in 1999.<br />
Property and Casualty <strong>Insurance</strong><br />
OVERVIEW<br />
Our property and casualty business incurred an operating<br />
loss before taxes <strong>of</strong> $53 million in <strong>2001</strong> compared<br />
24
The pre-tax costs <strong>of</strong> $645 million related to the<br />
September 11 attack had three components. First, in<br />
our insurance business, we incurred estimated net claims<br />
and claim expenses <strong>of</strong> $555 million plus reinsurance<br />
reinstatement costs <strong>of</strong> $50 million, for an aggregate cost<br />
<strong>of</strong> $605 million. Second, in our reinsurance business<br />
written through <strong>Chubb</strong> Re, which is included in other<br />
specialty results, we incurred estimated net claims and<br />
claim expenses <strong>of</strong> $110 million and recognized net<br />
reinstatement premium revenue <strong>of</strong> $80 million, for a net<br />
cost <strong>of</strong> $30 million. Finally, we recorded a $10 million<br />
charge, included in other charges, as our share <strong>of</strong> the<br />
losses publicly estimated by Hiscox plc, a U.K. insurer<br />
in which we have a 28% interest.<br />
Underwriting results by class <strong>of</strong> business for the years<br />
ended December 31, <strong>2001</strong>, 2000 and 1999 are presented<br />
on page 22. In <strong>2001</strong>, we formed three strategic business<br />
units: <strong>Chubb</strong> Personal <strong>Insurance</strong>, <strong>Chubb</strong> Commercial<br />
<strong>Insurance</strong> and <strong>Chubb</strong> Specialty <strong>Insurance</strong>. In conjunc-<br />
tion with the formation <strong>of</strong> the strategic business units,<br />
we have reclassiÑed property and marine business from<br />
our specialty insurance segment to our commercial<br />
insurance segment and also reclassiÑed some business<br />
that was included within executive protection to multi-<br />
ple peril. Prior year amounts have been reclassiÑed.<br />
We estimate that our gross claims and claim expenses<br />
from the September 11 attack were about $3 billion.<br />
Most <strong>of</strong> the claims were from property exposure and<br />
business interruption losses. We also had signiÑcant<br />
workers' compensation losses. Our net claims and claim<br />
expenses <strong>of</strong> $665 million were signiÑcantly lower than<br />
the gross amount due to various reinsurance agreements.<br />
Our property exposures were protected by facultative<br />
reinsurance, a property per risk treaty that limited our<br />
net loss per risk, and our property catastrophe treaty.<br />
Our workers' compensation losses were protected by a<br />
casualty catastrophe treaty and a casualty clash treaty.<br />
Based on our review <strong>of</strong> our reinsurance programs, we<br />
estimated the amount <strong>of</strong> reinsurance recoverable. We<br />
believe the estimate is reasonable based on information<br />
available at the present time. We have also modeled the<br />
estimated recoveries by individual reinsurer. Based on<br />
this analysis, we estimate that 98% <strong>of</strong> our reinsurance is<br />
with reinsurers or markets rated investment grade or<br />
rated A or better by A.M. Best Company.<br />
Business interruption claims from the September 11<br />
attack will take some time to settle, while potential<br />
liability claims, if initiated, could take years to settle.<br />
Given that, we have no evidence <strong>of</strong> any emerging issues<br />
that would cause us to change our reserve estimates.<br />
While it is possible that our estimate <strong>of</strong> ultimate net<br />
losses related to the September 11 attack may change in<br />
the future, we do not expect that any such change<br />
1997<br />
1998<br />
1999<br />
2000<br />
<strong>2001</strong><br />
130%<br />
120%<br />
110%<br />
100%<br />
Total Property & Casualty <strong>Insurance</strong><br />
90%<br />
80%<br />
70%<br />
NET PREMIUMS WRITTEN (in millions <strong>of</strong> dollars)<br />
Commercial<br />
1997<br />
1998<br />
Specialty<br />
1999<br />
2000<br />
$5,448<br />
$5,504<br />
$5,701<br />
Personal<br />
* Excludes Reinstatement Premiums Related to<br />
September 11 Attack<br />
COMBINED LOSS & EXPENSE RATIOS<br />
* Excludes Impact <strong>of</strong> September 11 Attack<br />
<strong>2001</strong>*<br />
$6,333<br />
$6,931*<br />
Commercial<br />
Specialty<br />
Personal<br />
would have a material eÅect on the Corporation's<br />
consolidated Ñnancial condition or liquidity.<br />
UNDERWRITING RESULTS<br />
Each <strong>of</strong> our underwriting segments was aÅected by the<br />
September 11 attack. However, the greatest impact by<br />
far was on our Ñnancial institutions business, which is<br />
part <strong>of</strong> our specialty insurance segment. Due to the<br />
distorting eÅect <strong>of</strong> the September 11 attack on our<br />
25
1997<br />
1998<br />
1999<br />
2000<br />
Total Property & Casualty <strong>Insurance</strong><br />
COMBINED LOSS & EXPENSE RATIOS<br />
32.4<br />
33.5<br />
32.5<br />
32.9<br />
<strong>2001</strong> 32.8<br />
Expense Ratio<br />
64.5<br />
66.3<br />
70.3<br />
67.5<br />
71.1<br />
Loss Ratio<br />
96.9%<br />
99.8%<br />
102.8%<br />
100.4%<br />
103.9%*<br />
Combined<br />
Ratio<br />
written increased 11% in 2000 compared with 1999.<br />
<strong>Report</strong>ed premium growth in 2000 was aÅected by the<br />
inclusion <strong>of</strong> premiums written by Executive Risk Inc.<br />
since July 1999, the date it was acquired by the<br />
Corporation. Executive Risk was a specialty insurance<br />
company oÅering primarily directors and oÇcers and<br />
errors and omissions coverages. Excluding the eÅect <strong>of</strong><br />
the acquisition <strong>of</strong> Executive Risk, premium growth was<br />
8% in 2000.<br />
* Excludes Impact <strong>of</strong> September 11 Attack<br />
Substantial premium growth was achieved in <strong>2001</strong> and<br />
2000 outside the United States, particularly in Europe,<br />
our largest foreign market. Non-U.S. premiums grew<br />
<strong>2001</strong> underwriting results, the remaining discussion and 16% in both <strong>2001</strong> and 2000 in local currencies.<br />
analysis <strong>of</strong> our underwriting results excludes the impact However, due to the strength <strong>of</strong> the U.S. dollar,<br />
<strong>of</strong> the September 11 attack, unless otherwise noted. The particularly in 2000, reported non-U.S. premiums<br />
following is a summary <strong>of</strong> our underwriting results for increased by 12% in <strong>2001</strong> and only 9% in 2000.<br />
<strong>2001</strong> by class <strong>of</strong> business excluding the impact <strong>of</strong> the<br />
September 11 attack.<br />
Personal coverages accounted for $2.0 billion or 29% <strong>of</strong><br />
Combined <strong>2001</strong> net premiums written, commercial coverages for<br />
Net Loss and<br />
$2.5 billion or 36% and specialty coverages for $2.4 bil-<br />
Premiums Expense<br />
lion or 35%.<br />
Written Ratios<br />
(in millions)<br />
Personal insurance<br />
AutomobileÏÏÏÏÏÏÏÏÏÏÏÏÏÏÏÏÏÏÏÏÏÏ $ 480 98.7%<br />
Homeowners ÏÏÏÏÏÏÏÏÏÏÏÏÏÏÏÏÏÏÏÏ 1,065 111.2<br />
Premium growth in personal lines was strong in both<br />
<strong>2001</strong> and 2000. In our commercial classes, which<br />
Other ÏÏÏÏÏÏÏÏÏÏÏÏÏÏÏÏÏÏÏÏÏÏÏÏÏÏ 436 75.5 include multiple peril, casualty, workers' compensation<br />
Total personalÏÏÏÏÏÏÏÏÏÏÏÏÏÏÏÏÏÏ 1,981 100.2 and property and marine, premiums decreased in 2000<br />
as higher prices were more than oÅset by lower<br />
Multiple peril ÏÏÏÏÏÏÏÏÏÏÏÏÏÏÏÏÏÏÏÏ 772 102.1<br />
retention rates, the latter due in part to our pruning <strong>of</strong><br />
Casualty ÏÏÏÏÏÏÏÏÏÏÏÏÏÏÏÏÏÏÏÏÏÏÏÏ 800 111.0<br />
Workers' compensation ÏÏÏÏÏÏÏÏÏÏÏÏ 355 92.2 underperforming accounts where we could not attain<br />
Property and marine ÏÏÏÏÏÏÏÏÏÏÏÏÏÏ 569 112.7 price adequacy. The marketplace continued to improve<br />
Total commercial ÏÏÏÏÏÏÏÏÏÏÏÏÏÏÏ 2,496 106.1 in <strong>2001</strong> with many <strong>of</strong> our competitors increasing rates<br />
even before September 11. As a result, our commercial<br />
Executive protectionÏÏÏÏÏÏÏÏÏÏÏÏÏÏÏ 1,349 94.0<br />
lines premiums began to increase in <strong>2001</strong>, particularly in<br />
Financial institutionsÏÏÏÏÏÏÏÏÏÏÏÏÏÏÏ 574 94.7<br />
Other ÏÏÏÏÏÏÏÏÏÏÏÏÏÏÏÏÏÏÏÏÏÏÏÏÏÏ 531 142.9 (a) the fourth quarter, as we retained more <strong>of</strong> our business<br />
Total specialtyÏÏÏÏÏÏÏÏÏÏÏÏÏÏÏÏÏÏ 2,454 104.5 (a) and wrote more new business. Premium growth in the<br />
Total ÏÏÏÏÏÏÏÏÏÏÏÏÏÏÏÏÏÏÏÏÏÏÏÏÏ $6,931 103.9%(a) specialty lines was restricted in <strong>2001</strong>, primarily due to<br />
the lack <strong>of</strong> growth in our executive protection business<br />
Enron. Excluding the eÅect <strong>of</strong> the Enron surety losses, the combined<br />
caused by our writing fewer multi-year policies as well as<br />
loss and expense ratio was 99.2% for other specialty, 95.3% for total our initiative to increase pricing and to not renew<br />
specialty and 100.5% in total.<br />
underperforming accounts.<br />
Commercial insurance<br />
Specialty insurance<br />
(a) Includes the eÅect <strong>of</strong> net surety bond losses <strong>of</strong> $220 million related to<br />
Net premiums written were $6.9 billion in <strong>2001</strong>, an<br />
increase <strong>of</strong> 9% over 2000. <strong>Report</strong>ed net premiums<br />
The tragic event <strong>of</strong> September 11 and its aftermath have<br />
accelerated changes in commercial insurance markets. In<br />
26
the wake <strong>of</strong> heavy insurance industry losses, many Underwriting results were unproÑtable in <strong>2001</strong> due<br />
insurance companies have sought substantial price primarily to the Enron-related surety bond losses<br />
increases, raised deductibles, reduced coverage limits or described below, compared with near breakeven results<br />
declined outright to renew coverage. In this environ- in 2000 and unproÑtable results in 1999. The combined<br />
ment, we are seeing more opportunities to write new, loss and expense ratio, the common measure <strong>of</strong> underhigh<br />
quality accounts and we are retaining more <strong>of</strong> our writing proÑtability, was 103.9% in <strong>2001</strong> compared with<br />
business. We are getting substantial rate increases on 100.4% in 2000 and 102.8% in 1999.<br />
business we write, <strong>of</strong>ten with more restrictive policy<br />
terms and conditions. We expect that this trend will The surety losses arising from the Enron bankruptcy<br />
continue during 2002.<br />
relate to bonds issued to various obligees in connection<br />
with Enron commitments. We recognized our maximum<br />
At the same time, as a result <strong>of</strong> the substantial losses surety exposure <strong>of</strong> $220 million, net <strong>of</strong> reinsurance, in<br />
incurred by reinsurers, the cost <strong>of</strong> reinsurance in the the fourth quarter <strong>of</strong> <strong>2001</strong>. However, certain <strong>of</strong> these<br />
marketplace is increasing signiÑcantly and reinsurance bonds are the subject <strong>of</strong> litigation. Management believes<br />
capacity for certain coverages, such as terrorism, is there are reasonable grounds for challenging the validity<br />
limited. We are operating under the assumption that our <strong>of</strong> our obligations under the bonds that are the subject<br />
reinsurers will not cover most forms <strong>of</strong> terrorism. The <strong>of</strong> the litigation and intends to pursue the litigation<br />
insurance industry has asked for a government backstop vigorously. If we are successful in the litigation, any<br />
for any future terrorist attacks. However, Congress has favorable development would be reÖected in future<br />
not enacted a legislative solution to terrorism related operating results.<br />
losses.<br />
Excluding the eÅect <strong>of</strong> the Enron surety losses, the<br />
We expect that reinsurers will restructure our property combined loss and expense ratio was 100.5% in <strong>2001</strong>,<br />
per risk reinsurance to limit the amount <strong>of</strong> catastrophe similar to the 100.4% in the prior year.<br />
risk covered by these treaties. Also, in many cases, we<br />
will have to retain a larger share <strong>of</strong> a loss before<br />
The loss ratio, excluding the eÅect <strong>of</strong> the Enron surety<br />
property per risk reinsurance applies. We may not<br />
losses, was 67.7% in <strong>2001</strong> compared with 67.5% in 2000<br />
renew certain reinsurance programs because the terms<br />
and 70.3% in 1999. Catastrophe losses other than those<br />
being oÅered are too restrictive or because the programs<br />
related to the September 11 attack were $114 million in<br />
have become prohibitively expensive. In fact, eÅective in<br />
<strong>2001</strong> which represented 1.7 percentage points <strong>of</strong> the<br />
January 2002, we did not renew a casualty catastrophe<br />
loss ratio compared with $72 million or 1.2 percentage<br />
program that had substantially reduced our net workers'<br />
points in 2000 and $225 million or 4.0 percentage<br />
compensation losses from the September 11 attack. Our<br />
points in 1999. Catastrophe losses aÅecting results each<br />
current property reinsurance program expires in April<br />
year resulted primarily from weather-related events in<br />
2002. The potential increase in our net risk concentrathe<br />
United States, including in particular Tropical Storm<br />
tions from a catastrophic event that would result from<br />
Allison in the second quarter <strong>of</strong> <strong>2001</strong> and Hurricane<br />
changes to our reinsurance arrangements may be oÅset<br />
Floyd in the third quarter <strong>of</strong> 1999. Other than<br />
to some degree by changes to our gross risk proÑle. In<br />
reinsurance recoveries related to the September 11<br />
particular, we are making a concerted eÅort to reduce<br />
attack, we did not have any recoveries from our<br />
terrorism risk aggregations. A shortage <strong>of</strong> reinsurance<br />
catastrophe reinsurance program during the three year<br />
capacity could constrain our ability to respond to<br />
period since there were no other individual catastrophes<br />
business opportunities and could make our future<br />
for which our losses exceeded the initial retention.<br />
operating results more volatile.<br />
Currently, our initial retention level for each catastrophic<br />
event is approximately $100 million in the<br />
27
1997<br />
Personal <strong>Insurance</strong><br />
NET PREMIUMS WRITTEN (in millions <strong>of</strong> dollars)<br />
$1,306<br />
from a small base. Much <strong>of</strong> this growth was in Europe<br />
where remedial actions to increase rates and improve the<br />
proÑtability <strong>of</strong> this business are in progress.<br />
1998<br />
1999<br />
2000<br />
<strong>2001</strong><br />
Automobile<br />
Homeowners<br />
$1,365<br />
$1,524<br />
$1,723<br />
Other<br />
$1,981<br />
Our personal insurance business produced near<br />
breakeven underwriting results in <strong>2001</strong> compared with<br />
substantial proÑts in 2000 and 1999. The combined loss<br />
and expense ratio was 100.2% in <strong>2001</strong> compared with<br />
92.9% in 2000 and 89.9% in 1999.<br />
COMBINED LOSS & EXPENSE RATIOS<br />
120%<br />
110%<br />
100%<br />
Homeowners<br />
Automobile<br />
90%<br />
80%<br />
Other<br />
70%<br />
60%<br />
1997 1998 1999 2000 <strong>2001</strong>*<br />
* Excludes Impact <strong>of</strong> September 11 Attack<br />
United States and generally $25 million outside the<br />
United States. Our initial retention may increase when<br />
our catastrophe reinsurance program is renewed in<br />
2002.<br />
Our expense ratio was 32.8% in <strong>2001</strong> compared with<br />
32.9% in 2000 and 32.5% in 1999. The increase in the<br />
expense ratio in 2000 was due to overhead expenses<br />
growing at a somewhat higher rate than written<br />
premiums.<br />
Homeowners results were unproÑtable in <strong>2001</strong> compared<br />
with near breakeven results in 2000 and proÑtable<br />
results in 1999. Results deteriorated signiÑcantly in <strong>2001</strong><br />
due primarily to a substantial increase in the frequency<br />
and severity <strong>of</strong> water damage claims, including those<br />
related to mold, as well as rate deÑciencies in several<br />
states and inadequate insurance to value. Results deteriorated<br />
in 2000 compared with 1999 due to an increase in<br />
large non-catastrophe losses that more than oÅset a<br />
decrease in catastrophe losses. Catastrophe losses represented<br />
5.4 percentage points <strong>of</strong> the loss ratio for this<br />
class in <strong>2001</strong> compared with 7.3 percentage points in<br />
2000 and 11.8 percentage points in 1999. Homeowners<br />
results were unproÑtable in Europe in each <strong>of</strong> the past<br />
three years as we are still building the critical mass<br />
necessary to absorb the costs <strong>of</strong> operating that franchise.<br />
Our personal automobile business was proÑtable in each<br />
<strong>of</strong> the last three years. However, proÑtability decreased<br />
in 2000 and again in <strong>2001</strong> due to an increase in the<br />
frequency <strong>of</strong> losses in the liability component <strong>of</strong> this<br />
business. Results in each year beneÑted from stable loss<br />
severity.<br />
Personal <strong>Insurance</strong><br />
Other personal coverages, which include insurance for<br />
Net premiums from personal insurance increased 15% in personal valuables and excess liability, produced highly<br />
<strong>2001</strong> compared with a 13% increase in 2000. We proÑtable results in each <strong>of</strong> the past three years, as<br />
continued to grow our personal lines business with the favorable loss experience has continued.<br />
in-force policy count for all coverages increasing. During<br />
<strong>2001</strong>, our in-force policy count increased 14% for In the latter part <strong>of</strong> <strong>2001</strong>, we had homeowners rate<br />
automobile, 8% for homeowners and 10% for other increases approved in many <strong>of</strong> the states where rates are<br />
coverages. Personal lines premiums outside the United deÑcient. We are seeking a second round <strong>of</strong> rate<br />
States grew signiÑcantly in <strong>2001</strong> and 2000, although increases and are increasing insurance to value. We saw<br />
28
a dramatic proliferation <strong>of</strong> water damage claims in <strong>2001</strong>,<br />
particularly in Texas, where state mandated policy<br />
language has contributed to broader water damage<br />
coverage. We are closely monitoring the water damage<br />
issue in Texas and in other states where it is becoming a<br />
growing concern. If necessary, we will reduce our<br />
presence in states where we cannot attain rate adequacy<br />
due to regulatory constraints or adverse loss trends.<br />
Commercial <strong>Insurance</strong><br />
1997<br />
1998<br />
1999<br />
2000<br />
<strong>2001</strong><br />
Commercial <strong>Insurance</strong><br />
NET PREMIUMS WRITTEN (in millions <strong>of</strong> dollars)<br />
Multiple Peril<br />
Casualty<br />
Workers’<br />
Compensation<br />
* Excludes Reinstatement Premiums Related to<br />
September 11 Attack<br />
$2,381<br />
$2,340<br />
$2,639<br />
$2,563<br />
$2,496*<br />
Property<br />
Marine<br />
&<br />
Net premiums from commercial insurance increased 7%<br />
in <strong>2001</strong> compared with a 2% decrease in 2000. The<br />
decrease in premiums in 2000 was the result <strong>of</strong> the<br />
strategy we put in place in late 1998 to increase the<br />
pricing in these classes and to not renew underperforming<br />
business where we could not attain price adequacy.<br />
As a result, retention levels were signiÑcantly below<br />
historical levels during 2000. On the business that was<br />
renewed, however, rates increased steadily. Rate<br />
increases remained Ñrm in <strong>2001</strong>. Premiums began to<br />
increase in <strong>2001</strong> as retention levels improved, particularly<br />
in the second half <strong>of</strong> the year. In addition, new<br />
business accelerated in the fourth quarter. Exposure<br />
growth, however, was minimal in <strong>2001</strong> due to the weak<br />
economy.<br />
140%<br />
130%<br />
120%<br />
110%<br />
100%<br />
90%<br />
80%<br />
COMBINED LOSS & EXPENSE RATIOS<br />
1997 1998 1999 2000 <strong>2001</strong>*<br />
1996 1997 1998 1999 2000<br />
* Excludes Impact <strong>of</strong> September 11 Attack<br />
Property & Marine<br />
Casualty<br />
Multiple Peril<br />
Workers’<br />
Compensation<br />
Multiple peril results were near breakeven in <strong>2001</strong><br />
compared with unproÑtable results in 2000 and highly<br />
unproÑtable results in 1999. The improvement in <strong>2001</strong><br />
was principally in the liability component <strong>of</strong> this<br />
business due to a lower frequency and severity <strong>of</strong> losses.<br />
The improvement in 2000 occurred in both the<br />
property and liability components due to a lower<br />
Our commercial insurance business produced underwriting<br />
losses in each <strong>of</strong> the past three years, but has shown<br />
substantial improvement in each succeeding year. The frequency <strong>of</strong> large losses in both the United States and<br />
improvement was due in large part to the cumulative overseas. Results in the property component in 2000<br />
eÅect <strong>of</strong> the pricing increases and more stringent risk also beneÑted from an absence <strong>of</strong> catastrophe losses.<br />
selection in recent years. The combined loss and<br />
Conversely, results in 1999 were adversely aÅected by<br />
expense ratio was 106.1% in <strong>2001</strong> compared with higher catastrophe losses. Catastrophe losses represented<br />
114.2% in 2000 and 120.4% in 1999. 3.0 percentage points <strong>of</strong> the loss ratio for this class in<br />
<strong>2001</strong> and 9.2 percentage points in 1999. There were<br />
Commercial insurance results, particularly in the casualty virtually no catastrophe losses in 2000.<br />
classes, were adversely aÅected in each <strong>of</strong> the past three<br />
years by incurred losses related to asbestos and toxic Results for our casualty business improved considerably<br />
waste claims. Such losses were $61 million in <strong>2001</strong>, $31 in <strong>2001</strong> compared with the prior two years, but<br />
million in 2000 and $47 million in 1999. The higher remained unproÑtable. The improvement in <strong>2001</strong> was<br />
incurred losses in <strong>2001</strong> were the result <strong>of</strong> adverse trends primarily in the automobile component <strong>of</strong> this business<br />
in asbestos related exposure (see ""Loss Reserves''). and, to a lesser extent, the primary liability component.<br />
29
Our strategy <strong>of</strong> working closely with our customers and<br />
our ability to bring new products to market and<br />
diÅerentiate such products continue to enable us to<br />
renew a considerable percentage <strong>of</strong> our executive<br />
protection and Ñnancial institutions business. However,<br />
executive protection premium growth was only 6% in<br />
<strong>2001</strong>. Recent claim severity trends indicated the need<br />
for higher rates and improved policy terms. As a result,<br />
we initiated a program to increase pricing and to not<br />
renew business that no longer meets our underwriting<br />
criteria. The low growth in <strong>2001</strong> was due to our writing<br />
fewer multi-year policies and the non-renewal <strong>of</strong> unpr<strong>of</strong>-<br />
itable business. Rates increased steadily in <strong>2001</strong>, particu-<br />
larly for public company directors and oÇcers liability<br />
business. As a result <strong>of</strong> the improved pricing, executive<br />
protection premiums increased 13% in the fourth<br />
quarter <strong>of</strong> <strong>2001</strong>.<br />
Results in 2000 were similar with those in 1999, as<br />
improvement in the primary liability component was<br />
oÅset by deterioration in the automobile component.<br />
The automobile component was modestly unproÑtable<br />
in <strong>2001</strong> compared with highly unproÑtable results in<br />
2000 and 1999. The signiÑcant improvement in <strong>2001</strong><br />
was due to higher rates and the culling <strong>of</strong> loss prone<br />
business, which resulted in a lower frequency <strong>of</strong> losses.<br />
Results had deteriorated in 2000 due to inadequate<br />
prices and an increased frequency <strong>of</strong> losses. Results for<br />
the primary liability component were unproÑtable in<br />
each <strong>of</strong> the past three years, but improved in each<br />
succeeding year. The excess liability component was<br />
somewhat more unproÑtable in <strong>2001</strong> compared with the<br />
previous two years. The severity <strong>of</strong> the large losses that<br />
are prevalent in this class has increased in recent years.<br />
Excess liability results in each <strong>of</strong> the past three years<br />
beneÑted from favorable development <strong>of</strong> prior year loss<br />
reserves. As noted above, casualty results in each <strong>of</strong> the<br />
past three years were adversely aÅected by incurred<br />
losses related to asbestos and toxic waste claims. Casualty<br />
results outside the United States were near breakeven in<br />
<strong>2001</strong> compared with unproÑtable results in 2000 and<br />
proÑtable results in 1999.<br />
Workers' compensation results were highly proÑtable in<br />
<strong>2001</strong> compared with near breakeven results in 2000 and<br />
unproÑtable results in 1999. The improvement each year<br />
was due to higher rates as well as a lower frequency <strong>of</strong><br />
losses, resulting in large part from our disciplined risk<br />
selection during the past several years.<br />
Property and marine results remained highly unproÑtable<br />
over the past three years. The positive eÅect <strong>of</strong> the<br />
pricing initiative and the culling <strong>of</strong> unproÑtable accounts<br />
was oÅset each year by a high frequency <strong>of</strong> large<br />
property losses. Overseas losses were signiÑcantly higher<br />
in <strong>2001</strong> and 2000. Results in 1999 were adversely<br />
aÅected by higher catastrophe losses. Catastrophe losses<br />
represented 5.4 points <strong>of</strong> the loss ratio for this class in<br />
<strong>2001</strong> compared with 1.7 points in 2000 and 10.2 points<br />
in 1999.<br />
Specialty <strong>Insurance</strong><br />
<strong>Report</strong>ed net premiums from specialty commercial<br />
insurance increased by 8% in <strong>2001</strong> compared with a<br />
26% increase in 2000. Excluding the eÅect <strong>of</strong> including<br />
only six months <strong>of</strong> Executive Risk business in 1999,<br />
premium growth was about 17% in 2000.<br />
Financial institutions had solid premium growth <strong>of</strong> 14%<br />
in <strong>2001</strong> due to both new business and higher rates.<br />
Expansion <strong>of</strong> the standard commercial component <strong>of</strong><br />
this business may be somewhat restrained in 2002 by<br />
our management <strong>of</strong> terrorism exposure concentrations.<br />
Growth in our other specialty commercial business was<br />
primarily from <strong>Chubb</strong> Re, our reinsurance business that<br />
began operations in 1999. Premiums produced by<br />
<strong>Chubb</strong> Re amounted to $199 million in <strong>2001</strong> compared<br />
with $158 million in 2000 and $73 million in 1999. We<br />
expect reinsurance assumed business to be a signiÑcant<br />
contributor to growth in 2002.<br />
Our specialty commercial underwriting results were<br />
unproÑtable in <strong>2001</strong> due to the Enron surety losses,<br />
compared with highly proÑtable results in 2000 and<br />
1999. The combined loss and expense ratio was 104.5%<br />
in <strong>2001</strong> compared with 91.3% in 2000 and 88.5% in<br />
1999. Excluding the eÅect <strong>of</strong> the Enron surety losses,<br />
30
underwriting results were proÑtable in <strong>2001</strong> as evidenced<br />
by a 95.3% combined loss and expense ratio.<br />
Executive protection results were proÑtable in each <strong>of</strong><br />
the past three years due to favorable development <strong>of</strong><br />
prior year loss reserves, particularly in the directors and<br />
oÇcers and Ñduciary liability components. However,<br />
proÑt margins have narrowed in the most recent<br />
accident years. Our employment practices liability business<br />
for large employers was unproÑtable in each <strong>of</strong> the<br />
past three years. Overseas results were modestly unpr<strong>of</strong>itable<br />
in <strong>2001</strong> due to several large directors and oÇcers<br />
liability losses, compared with highly proÑtable results in<br />
the prior two years.<br />
1997<br />
1998<br />
1999<br />
2000<br />
<strong>2001</strong><br />
160%<br />
140%<br />
Specialty <strong>Insurance</strong><br />
NET PREMIUMS WRITTEN (in millions <strong>of</strong> dollars)<br />
Executive Protection<br />
$1,503<br />
$1,576<br />
Financial<br />
Institutions<br />
$1,796<br />
* Excludes Reinstatement Premiums Related to<br />
September 11 Attack<br />
COMBINED LOSS & EXPENSE RATIOS<br />
Other<br />
Other<br />
$2,270<br />
$2,454*<br />
Our Ñnancial institutions business was proÑtable in each<br />
<strong>of</strong> the last three years due to favorable loss experience in<br />
the Ñdelity component <strong>of</strong> this business. Results from our<br />
errors and omissions business were unproÑtable in <strong>2001</strong><br />
due to an increase in loss severity. The standard<br />
commercial business written on Ñnancial institutions<br />
produced proÑtable results in <strong>2001</strong> compared with<br />
120%<br />
100%<br />
80%<br />
60%<br />
1997 1998 1999 2000 <strong>2001</strong>*<br />
* Excludes Impact <strong>of</strong> September 11 Attack<br />
Financial<br />
Institutions<br />
Executive<br />
Protection<br />
breakeven results in 2000 and unproÑtable results in<br />
1999. We have in force several gas forward purchase surety<br />
bonds similar to those issued to Enron. The total<br />
Results in our other specialty classes were highly<br />
amount <strong>of</strong> bonds with one principal is $570 million,<br />
unproÑtable in <strong>2001</strong> due to the Enron surety losses. which far exceeds the combined amount <strong>of</strong> all other<br />
Excluding the Enron surety losses, other specialty results similar surety bonds. The principals under these surety<br />
were near breakeven in <strong>2001</strong> compared with unproÑta- bonds continue to perform at this time and we have no<br />
ble results in 2000 and proÑtable results in 1999. Our reason to doubt their continued ability to perform.<br />
reinsurance assumed business generated by <strong>Chubb</strong> Re<br />
produced a modest underwriting loss in each <strong>of</strong> the past LOSS RESERVES<br />
three years. Aviation results were highly unproÑtable in Loss reserves are our property and casualty subsidiaries'<br />
each <strong>of</strong> these years. We have reduced our participation largest liability. Loss reserves at December 31, <strong>2001</strong><br />
in aviation business which will reduce our exposure to included signiÑcant amounts related to the September 11<br />
any future losses.<br />
attack and to our Enron surety exposure. The components<br />
<strong>of</strong> loss reserves were as follows:<br />
Surety results were highly proÑtable in 1999 and 2000<br />
and, excluding the Enron surety losses, were highly<br />
proÑtable in <strong>2001</strong>. As a result <strong>of</strong> disarray in the surety<br />
reinsurance market caused in large part by the Enron<br />
bankruptcy, the availability <strong>of</strong> surety reinsurance in the<br />
near term will be signiÑcantly reduced. As a result, our<br />
future surety results could be more volatile.<br />
31
Gross loss reserves<br />
December 31<br />
<strong>2001</strong> 2000 1999<br />
(in millions)<br />
Total, per balance sheetÏÏÏÏÏÏÏÏÏÏÏÏÏ $15,515 $11,904 $11,435<br />
Less:<br />
future will be impacted by changing rates <strong>of</strong> inÖation<br />
and other economic conditions, changing legislative,<br />
judicial and social environments and changes in our<br />
claim handling procedures.<br />
We use a variety <strong>of</strong> actuarial methods to estimate loss<br />
Related to September 11 attack ÏÏÏÏ 2,775<br />
Related to Enron surety exposure ÏÏ 333<br />
reserves. These methods generally utilize analyses <strong>of</strong><br />
historical patterns <strong>of</strong> the development <strong>of</strong> paid and<br />
reported losses by accident year for each class <strong>of</strong><br />
business. This process relies on the basic assumption<br />
that past experience, adjusted for the eÅects <strong>of</strong> current<br />
Related to September 11 attack ÏÏÏÏ 2,239<br />
developments and likely trends, is an appropriate basis<br />
Related to Enron surety exposure ÏÏ 121 for predicting future outcomes.<br />
Total, as adjusted ÏÏÏÏÏÏÏÏÏÏÏÏÏÏÏÏÏÏ $12,407 $11,904 $11,435<br />
Reinsurance recoverable<br />
Total, per balance sheetÏÏÏÏÏÏÏÏÏÏÏÏÏ $ 4,505 $ 1,853 $ 1,686<br />
Less:<br />
Total, as adjusted ÏÏÏÏÏÏÏÏÏÏÏÏÏÏÏÏÏÏ $ 2,145 $ 1,853 $ 1,686<br />
Net loss reserves<br />
Our loss reserves include amounts related to short tail<br />
TotalÏÏÏÏÏÏÏÏÏÏÏÏÏÏÏÏÏÏÏÏÏÏÏÏÏÏÏÏ $11,010 $10,051 $ 9,749 and long tail classes <strong>of</strong> business. Short tail classes consist<br />
Total, as adjusted ÏÏÏÏÏÏÏÏÏÏÏÏÏÏÏÏÏÏ 10,262 10,051 9,749 principally <strong>of</strong> homeowners, personal valuables and commercial<br />
property business. For these classes, the estima-<br />
Adjusted to exclude the loss reserves related to the tion <strong>of</strong> loss reserves is less complex because claims are<br />
September 11 attack and the Enron surety losses, loss generally reported and settled quickly and the claims<br />
reserves, net <strong>of</strong> reinsurance recoverable, increased by relate to tangible property.<br />
$211 million or 2% in <strong>2001</strong> compared with $302 million<br />
or 3% in 2000. Loss reserves for personal insurance and Long-tail classes include directors and oÇcers liability<br />
specialty insurance increased in <strong>2001</strong> and 2000 while and other executive protection coverages, commercial<br />
loss reserves for commercial insurance decreased each excess liability and other liability classes. Most <strong>of</strong> our loss<br />
year. Such decrease reÖects the signiÑcant exposure reserves relate to long tail liability classes <strong>of</strong> business. For<br />
reductions <strong>of</strong> the past several years and improved many liability claims signiÑcant periods <strong>of</strong> time, ranging<br />
accident year results due to price increases and more up to several years or more, may elapse between the<br />
stringent risk selection.<br />
occurrence <strong>of</strong> the loss, the reporting <strong>of</strong> the loss and the<br />
settlement <strong>of</strong> the claim. The longer the time span<br />
During <strong>2001</strong>, we experienced overall favorable develop- between the incidence <strong>of</strong> a loss and the settlement <strong>of</strong><br />
ment <strong>of</strong> $196 million on loss reserves established as <strong>of</strong> the claim, the more the ultimate settlement amount can<br />
the previous year-end. This compares with favorable vary. For the long tail liability classes, a relatively small<br />
development <strong>of</strong> $230 million in 2000 and $206 million proportion <strong>of</strong> net losses in the more recent accident<br />
in 1999. Such redundancies were reÖected in operating years are reported claims and an even smaller proportion<br />
results in these respective years. Each <strong>of</strong> the past three are paid losses. Therefore, a relatively large proportion<br />
years beneÑted from favorable claim experience for <strong>of</strong> our net losses for these classes are reserves for<br />
certain liability classes, oÅset in part by losses incurred incurred but not reported (IBNR) losses Ì claims that<br />
related to asbestos and toxic waste claims.<br />
had not yet been reported to us, some <strong>of</strong> which were<br />
not yet known to the insured, and future development<br />
The process <strong>of</strong> establishing loss reserves is complex and on reported claims. In fact, approximately 60% <strong>of</strong> our<br />
imprecise as it reÖects signiÑcant judgmental factors. This aggregate net loss reserves at December 31, <strong>2001</strong> were<br />
is true because claim settlements to be made in the for IBNR.<br />
32
In spite <strong>of</strong> the inherent imprecision in the loss reserving<br />
process, Ñnancial reporting requirements dictate that we<br />
and other insurance companies report a single amount<br />
as the estimate <strong>of</strong> loss reserves at each balance sheet<br />
date.<br />
Our other asbestos exposures are mostly peripheral<br />
defendants, including a mix <strong>of</strong> manufacturers, distributors<br />
and installers <strong>of</strong> certain products that contain<br />
asbestos as well as premises owners. Generally, these<br />
insureds are named defendants on a regional rather than<br />
a nationwide basis. As the Ñnancial resources <strong>of</strong> tradi-<br />
tional asbestos defendants have been depleted, plaintiÅs<br />
are targeting these peripheral parties with greater fre-<br />
quency and, in many cases, for larger awards. In<br />
addition, the plaintiÅs' bar continues to solicit new<br />
claimants through extensive advertising and through<br />
asbestos medical screenings. Litigation is then initiated<br />
even though many <strong>of</strong> the claimants do not show any<br />
signs <strong>of</strong> asbestos-related illness. Thus, new asbestos<br />
claims and new exposures on existing claims have<br />
continued unabated despite the fact that usage <strong>of</strong><br />
asbestos has declined since the mid-1970's. Based on<br />
published projections, we expect that we will continue<br />
receiving asbestos claims at the current rate for at least<br />
the next several years.<br />
Judicial decisions and legislative actions continue to<br />
broaden liability and policy deÑnitions and to increase<br />
the severity <strong>of</strong> claim payments. As a result <strong>of</strong> this and<br />
other societal and economic developments, the uncertainties<br />
inherent in estimating ultimate claim costs on<br />
the basis <strong>of</strong> past experience have been exacerbated,<br />
further complicating the already complex loss reserving<br />
process.<br />
The uncertainties relating to asbestos and toxic waste<br />
claims on insurance policies written many years ago are<br />
exacerbated by inconsistent court decisions and judicial<br />
and legislative interpretations <strong>of</strong> coverage that in some<br />
cases have tended to erode the clear and express intent<br />
<strong>of</strong> such policies and in others have expanded theories <strong>of</strong><br />
liability. The industry as a whole is engaged in extensive<br />
litigation over these coverage and liability issues and is<br />
thus confronted with a continuing uncertainty in its<br />
eÅorts to quantify these exposures.<br />
Early asbestos claims focused on the major manufacturers,<br />
distributors or installers <strong>of</strong> asbestos products under<br />
the products liability section <strong>of</strong> primary general liability<br />
policies, which typically had aggregate limits that capped<br />
an insurer's liability. A growing number <strong>of</strong> asbestos<br />
claims by insureds are being presented as ""non-prod-<br />
ucts'' claims, such as those by installers <strong>of</strong> asbestos<br />
products and by property owners who allegedly had<br />
asbestos on their property, under the premises or<br />
operations section <strong>of</strong> primary general liability policies.<br />
Unlike products exposures, these non-products expo-<br />
sures typically had no aggregate limits, creating potentially<br />
greater exposure. Further, in an eÅort to seek<br />
additional insurance coverage, some insureds that have<br />
substantially eroded their products coverage are present-<br />
ing new asbestos claims as non-products premises or<br />
operations claims or attempting to reclassify old products<br />
claims. The extent to which insureds will be successful<br />
in obtaining coverage on this basis is uncertain.<br />
Asbestos remains the most signiÑcant and diÇcult mass<br />
tort for the insurance industry in terms <strong>of</strong> claims<br />
volume and dollar exposure. The continued Öow <strong>of</strong><br />
claims has pushed about a dozen manufacturers and<br />
users <strong>of</strong> asbestos products into bankruptcy since 2000.<br />
To date, approximately 50 companies have Ñled for<br />
bankruptcy as a result <strong>of</strong> asbestos liability. In part as a<br />
result <strong>of</strong> these bankruptcies, the volume and value <strong>of</strong><br />
claims against viable asbestos defendants continue to<br />
increase.<br />
Our most signiÑcant individual asbestos exposures<br />
involve traditional defendants who manufactured, distributed<br />
or installed asbestos products for whom we wrote<br />
excess liability coverages. While these insureds are<br />
relatively few in number, such exposure has increased in<br />
recent years due to the increased volume <strong>of</strong> claims, the<br />
erosion <strong>of</strong> much <strong>of</strong> the underlying limits and the<br />
bankruptcies <strong>of</strong> target defendants.<br />
33
As the costs <strong>of</strong> environmental clean-up became substan-<br />
tial, PRPs and others increasingly Ñled claims with their<br />
insurance carriers. Litigation against insurers extends to<br />
issues <strong>of</strong> liability, coverage and other policy provisions.<br />
The expanded focus <strong>of</strong> asbestos litigation beyond asbestos<br />
manufacturers and distributors to installers and<br />
premises owners has created in some instances conÖicts<br />
among insureds, primary insurers and excess insurers,<br />
primarily involving questions regarding allocation <strong>of</strong><br />
indemnity and expense costs and exhaustion <strong>of</strong> policy<br />
limits. These issues are generating costly coverage<br />
litigation with the potential for inconsistent results.<br />
SigniÑcant uncertainty remains as to our ultimate liability<br />
Federal legislation still appears to be the best vehicle for<br />
comprehensively addressing the asbestos problem. Any<br />
legislative solution would require the support <strong>of</strong> mem-<br />
bers <strong>of</strong> the plaintiÅs' bar.<br />
There is great uncertainty involved in estimating our<br />
liabilities related to these claims. First, the liabilities <strong>of</strong><br />
the claimants are extremely diÇcult to estimate. At any<br />
given site, the allocation <strong>of</strong> remediation costs among<br />
governmental authorities and the PRPs varies greatly<br />
depending on a variety <strong>of</strong> factors. Second, diÅerent<br />
courts have addressed liability and coverage issues<br />
regarding pollution claims and have reached inconsistent<br />
conclusions in their interpretation <strong>of</strong> several issues.<br />
These signiÑcant uncertainties are not likely to be<br />
resolved deÑnitively in the near future.<br />
related to asbestos related claims due to such factors as<br />
the long latency period between asbestos exposure and Uncertainties also remain as to the Superfund law itself.<br />
disease manifestation and the resulting potential for Superfund's taxing authority expired on December 31,<br />
involvement <strong>of</strong> multiple policy periods for individual 1995 and has not been re-enacted. Notwithstanding<br />
claims as well as the increase in the volume <strong>of</strong> claims by continued pressure by the insurance industry and other<br />
plaintiÅs who claim exposure but who have no symp- interested parties to achieve a legislative solution that<br />
toms <strong>of</strong> asbestos-related disease and an increase in claims would reform the liability provisions <strong>of</strong> the law, federal<br />
Ñled under the non-aggregate premises or operations legislation appears to be at a standstill. At this time, it is<br />
section <strong>of</strong> general liability policies.<br />
not possible to predict the direction that any reforms<br />
may take, when they may occur or the eÅect that any<br />
Hazardous waste sites are another signiÑcant potential changes may have on the insurance industry.<br />
exposure. Under the federal ""Superfund'' law and<br />
similar state statutes, when potentially responsible parties Without federal movement on Superfund reform, the<br />
(PRPs) fail to handle the clean-up at a site, regulators enforcement <strong>of</strong> Superfund liability is shifting to the<br />
have the work done and then attempt to establish legal states. States are being forced to reconsider state-level<br />
liability against the PRPs. Most PRPs named to date are cleanup statutes and regulations. As individual states<br />
parties who have been generators, transporters, past or move forward, the potential for conÖicting state regula-<br />
present land owners or past or present site operators. tion becomes greater. SigniÑcant uncertainty remains as<br />
The PRPs disposed <strong>of</strong> toxic materials at a waste dump to the cost <strong>of</strong> remediating the state sites. Because <strong>of</strong> the<br />
site or transported the materials to the site. In many large number <strong>of</strong> state sites, such sites could prove even<br />
instances, these PRPs had proper government authorization.<br />
more costly in the aggregate than Superfund sites.<br />
Most sites have multiple PRPs. <strong>Insurance</strong> policies<br />
issued to PRPs were not intended to cover the clean-up Toxic waste losses appear to be developing as expected<br />
costs <strong>of</strong> pollution and, in many cases, did not intend to due to relatively stable claim trends. In many cases,<br />
cover the pollution itself. Pollution was not a recognized claims are being settled for less than initially anticipated<br />
hazard at the time many <strong>of</strong> these policies were written. due to various factors, including more eÇcient site<br />
In more recent years, however, policies speciÑcally remediation eÅorts and increasing success with policy<br />
exclude such exposures.<br />
buy backs.<br />
34
occurred, including both those known to us and those<br />
yet to be reported. In establishing such reserves,<br />
management considers facts currently known and the<br />
present state <strong>of</strong> the law and coverage litigation. How-<br />
ever, given the expansion <strong>of</strong> coverage and liability by the<br />
courts and the legislatures in the past and the possibili-<br />
ties <strong>of</strong> similar interpretations in the future, particularly as<br />
they relate to asbestos and toxic waste claims, additional<br />
increases in loss reserves may emerge in future periods.<br />
Any such increases would have an adverse eÅect on<br />
future operating results. However, management does not<br />
expect that any such increases would have a material<br />
adverse eÅect on the Corporation's consolidated Ñnancial<br />
condition or liquidity.<br />
Litigation costs remain substantial, particularly for hazardous<br />
waste claims. Primary policies provide a limit on<br />
indemnity payments but many do not limit defense<br />
costs. This unlimited defense provided in the policies<br />
sometimes leads to the payment <strong>of</strong> defense costs<br />
substantially exceeding the indemnity exposure. A substantial<br />
portion <strong>of</strong> the funds we have expended to date<br />
has been for legal fees incurred in the prolonged<br />
litigation <strong>of</strong> coverage issues.<br />
The tragic event <strong>of</strong> September 11 changed the way the<br />
property and casualty insurance industry views cata-<br />
strophic risk. Numerous classes <strong>of</strong> business have become<br />
exposed to terrorism related catastrophic risks in addition<br />
to the catastrophic risks related to natural occur-<br />
rences. This has required us to change how we identify<br />
and evaluate risk accumulations. We have changed our<br />
underwriting protocols to address terrorism and the<br />
limited availability <strong>of</strong> terrorism reinsurance. However,<br />
given the uncertainty <strong>of</strong> the potential threats, we cannot<br />
be sure that we have addressed all the possibilities.<br />
Reserves for asbestos and toxic waste claims cannot be<br />
estimated with traditional loss reserving techniques that<br />
rely on historical accident year loss development factors.<br />
We have established case reserves and expense reserves<br />
for costs <strong>of</strong> related litigation where suÇcient information<br />
has been developed to indicate the involvement <strong>of</strong> a<br />
speciÑc insurance policy. In addition, IBNR reserves<br />
have been established to cover additional exposures on<br />
both known and unasserted claims.<br />
The following table presents loss reserve activity, net <strong>of</strong><br />
reinsurance recoverable, related to asbestos and toxic<br />
waste claims. Reinsurance recoveries related to these<br />
claims are not signiÑcant.<br />
Years Ended December 31<br />
<strong>2001</strong> 2000 1999<br />
(in millions)<br />
CATASTROPHE EXPOSURE<br />
Loss reserves, beginning <strong>of</strong> yearÏÏÏÏÏÏÏ $450 $524 $1,075(a)<br />
Incurred losses ÏÏÏÏÏÏÏÏÏÏÏÏÏÏÏÏÏÏÏÏ 61 31 47 The Corporation's property and casualty subsidiaries also<br />
Losses paid ÏÏÏÏÏÏÏÏÏÏÏÏÏÏÏÏÏÏÏÏÏÏÏ 99 105 598(a)<br />
have exposure to insured losses caused by hurricanes,<br />
Loss reserves, end <strong>of</strong> year ÏÏÏÏÏÏÏÏÏÏÏ $412 $450 $ 524 earthquakes, winter storms, windstorms and other natural<br />
(a) Includes $549 million related to asbestos claims against Fibreboard<br />
catastrophic events. The frequency and severity <strong>of</strong><br />
Corporation.<br />
natural catastrophes are unpredictable. The extent <strong>of</strong><br />
losses from a catastrophe is a function <strong>of</strong> both the total<br />
Reserves for asbestos and toxic waste claims are continu- amount <strong>of</strong> insured exposure in an area aÅected by the<br />
ally reviewed and updated. Further increases in such loss event and the severity <strong>of</strong> the event. We continually<br />
reserves in 2002 and future years are possible as legal assess our concentration <strong>of</strong> underwriting exposures in<br />
and factual issues concerning these claims continue to be catastrophe prone areas globally and develop strategies to<br />
clariÑed. The amount cannot be reasonably estimated at manage this exposure through individual risk selection,<br />
the present time.<br />
subject to regulatory constraints, and through the<br />
purchase <strong>of</strong> catastrophe reinsurance. In recent years, we<br />
Management believes that the aggregate loss reserves <strong>of</strong> have invested in modeling technologies and concentrathe<br />
property and casualty subsidiaries at December 31, tion management tools that enable us to better monitor<br />
<strong>2001</strong> were adequate to cover claims for losses that had and control catastrophe exposures. We also continue to<br />
35
1997<br />
1998<br />
1999<br />
2000<br />
<strong>2001</strong><br />
1997<br />
1998<br />
1999<br />
2000<br />
Property & Casualty <strong>Insurance</strong><br />
INVESTMENT INCOME AFTER TAXES<br />
(in millions <strong>of</strong> dollars)<br />
0<br />
Tax Exempt Interest<br />
<strong>2001</strong><br />
Tax Exempt<br />
Fixed Maturities<br />
$592<br />
Taxable<br />
Interest<br />
INVESTED ASSETS (in millions <strong>of</strong> dollars)<br />
$634<br />
$692<br />
$12,777<br />
600<br />
$735<br />
$749<br />
Dividends<br />
$13,715<br />
$14,870<br />
$15,805<br />
$16,853<br />
Taxable Equity Short<br />
Fixed Securities Term<br />
Maturities<br />
Investments<br />
explore and analyze credible scientiÑc evidence, including<br />
the impact <strong>of</strong> global climate change, that may aÅect our<br />
potential exposure under insurance policies.<br />
INVESTMENTS AND LIQUIDITY<br />
Property and casualty investment income after taxes<br />
increased 2% in <strong>2001</strong> compared with 2000 and 6% in<br />
2000 compared with 1999. <strong>Report</strong>ed growth in 2000<br />
was due in part to the inclusion <strong>of</strong> Executive Risk<br />
investment income for only six months in 1999.<br />
Excluding the eÅect <strong>of</strong> the acquisition <strong>of</strong> Executive Risk,<br />
growth was about 3% in 2000. Growth in <strong>2001</strong> and<br />
2000 was due to an increase in invested assets, which<br />
reÖected substantial cash Öow from operations over the<br />
period. Growth was dampened by lower available<br />
reinvestment rates on Ñxed maturities that matured in<br />
each year. The eÅective tax rate on our investment<br />
income was 17.0% in <strong>2001</strong> compared with 16.4% in<br />
2000 and 15.7% in 1999. The eÅective tax rate increased<br />
each year as a result <strong>of</strong> our holding a somewhat smaller<br />
proportion <strong>of</strong> our investment portfolio in tax-exempt<br />
securities.<br />
Generally, premiums are received by our property and<br />
casualty subsidiaries months or even years before losses<br />
are paid under the policies purchased by such premiums.<br />
These funds are used Ñrst to make current claim<br />
and expense payments. The balance is invested to<br />
augment the investment income generated by the<br />
existing portfolio. Historically, cash receipts from operations,<br />
consisting <strong>of</strong> insurance premiums and investment<br />
income, have provided more than suÇcient funds to pay<br />
losses, operating expenses and dividends to the<br />
Corporation.<br />
New cash available for investment by the property and<br />
casualty subsidiaries was approximately $570 million in<br />
<strong>2001</strong> compared with $560 million in 2000 and<br />
$940 million in 1999. New cash available in <strong>2001</strong> and<br />
2000 was lower than in 1999 due primarily to paid<br />
losses growing at a higher rate than premium receipts in<br />
these years.<br />
In addition to the cash from operations, the Corporation<br />
contributed $750 million to the property and<br />
casualty subsidiaries in the fourth quarter <strong>of</strong> <strong>2001</strong>, <strong>of</strong><br />
which $250 million was used to fund the purchase <strong>of</strong> a<br />
19% interest in Allied World Assurance Holdings, Ltd,<br />
a newly formed Bermuda-based insurer.<br />
In <strong>2001</strong>, we invested new cash primarily in corporate<br />
bonds. In 2000, we invested new cash primarily in<br />
mortgage-backed securities. In 1999, new cash was<br />
invested in tax-exempt bonds and corporate bonds.<br />
During 1999, we reduced our equity securities portfolio<br />
by approximately $350 million with $145 million <strong>of</strong> the<br />
proceeds used to fund the purchase <strong>of</strong> a 28% interest in<br />
Hiscox plc, a U.K. personal and commercial specialty<br />
insurer. In each year, we tried to achieve the appropriate<br />
mix <strong>of</strong> taxable and tax-exempt securities in our portfolio<br />
to balance both investment and tax strategies.<br />
We have evaluated our expected cash needs related to<br />
the settlement <strong>of</strong> claims from the September 11 attack.<br />
We expect to fund our obligations related to such claims<br />
from a combination <strong>of</strong> operating cash Öows, maturity <strong>of</strong><br />
Ñxed maturity securities and anticipated recovery <strong>of</strong><br />
reinsurance. The period over which the payment <strong>of</strong><br />
claims from the September 11 attack will be made is not<br />
yet determinable. Our property and casualty subsidiaries<br />
maintain investments in highly liquid, short-term and<br />
36
other marketable securities to provide for immediate<br />
cash needs. Should the need for additional liquidity<br />
develop, the Corporation could either sell a portion <strong>of</strong><br />
its investment portfolio or draw down under its existing<br />
commercial paper or bank credit facilities.<br />
Corporate and Other<br />
losses, related to numerous credit events, exceed a<br />
speciÑed attachment point.<br />
Credit default swaps are derivatives and are carried at<br />
estimated fair value in the Ñnancial statements. Changes<br />
in fair value are included in income in the period <strong>of</strong> the<br />
change. Valuation models are used to estimate the fair<br />
value <strong>of</strong> our obligation in each credit default swap. Such<br />
valuations require considerable judgment and are subject<br />
to signiÑcant uncertainty. The fair value <strong>of</strong> our credit<br />
default swaps is subject to Öuctuations arising from,<br />
among other factors, observable changes in credit<br />
Corporate and other includes investment income earned<br />
on corporate invested assets, interest expense and other<br />
expenses not allocated to the operating subsidiaries, and<br />
the results <strong>of</strong> <strong>Chubb</strong> Financial Solutions and our real<br />
estate and other non-insurance subsidiaries. Corporate<br />
and other produced a loss before taxes <strong>of</strong> $14 million in spreads and interest rates. Increases in the fair value <strong>of</strong><br />
<strong>2001</strong> compared with a loss <strong>of</strong> $4 million in both 2000 obligations, which would result in a charge to income,<br />
and 1999. Interest expense increased each year due to could be material upon the occurrence <strong>of</strong> an extreme,<br />
the inclusion <strong>of</strong> interest expense on the debt assumed in widespread or persistent economic event that suggests an<br />
connection with the Executive Risk acquisition in July actual loss is possible. The market risks associated with<br />
1999 and the issuance <strong>of</strong> short term and long term debt our obligations under credit default swaps are discussed<br />
in <strong>2001</strong>. In 2000, corporate and other included income under ""Market Risk Ì Credit Derivatives''.<br />
<strong>of</strong> $10 million from a noncompete payment related to<br />
the sale <strong>of</strong> the Corporation's 50% interest in Associated The insurance and reinsurance solutions that CFSI<br />
Aviation Underwriters, Inc. (AAU).<br />
develops to meet the risk management needs <strong>of</strong> its<br />
customers are written by our property and casualty<br />
CHUBB FINANCIAL SOLUTIONS<br />
subsidiaries. Results from this business are included<br />
<strong>Chubb</strong> Financial Solutions (CFSI) was organized by the<br />
within our insurance results. A property and casualty<br />
Corporation in 2000 to engage in developing and<br />
subsidiary issued a reinsurance contract to an insurer<br />
providing risk-Ñnancing services through the capital and<br />
that provides Ñnancial guarantees on asset-backed transinsurance<br />
markets. Since its inception, CFSI's nonactions.<br />
At December 31, <strong>2001</strong>, the amount <strong>of</strong> aggregate<br />
insurance operations have been primarily in the credit<br />
principal commitments related to the contract was<br />
derivatives business, principally as a counterparty to<br />
approximately $400 million, all <strong>of</strong> which expire by 2023.<br />
credit default swaps. The Corporation guarantees all <strong>of</strong><br />
these obligations. Income before taxes from the non-<br />
REAL ESTATE<br />
insurance business <strong>of</strong> CFSI was $7 million in <strong>2001</strong> and<br />
Real estate operations resulted in a loss before taxes <strong>of</strong><br />
$3 million in 2000, which amounts are included in the<br />
$4 million in each <strong>of</strong> the past three years, which<br />
corporate and other results. Revenues from this busiamounts<br />
are included in the corporate and other results.<br />
ness, consisting <strong>of</strong> earned fees, were $27 million and<br />
In each year, we sold selected commercial properties as<br />
$12 million in <strong>2001</strong> and 2000, respectively.<br />
well as residential properties. Real estate revenues were<br />
In a typical credit default swap, CFSI participates in the $87 million in <strong>2001</strong>, $75 million in 2000 and $97 milsenior<br />
or super senior layer <strong>of</strong> a structure designed to lion in 1999.<br />
replicate the performance <strong>of</strong> a portfolio <strong>of</strong> securities,<br />
loans or other debt obligations. The structure <strong>of</strong> these We own approximately $310 million <strong>of</strong> land that we<br />
credit default swaps generally requires CFSI to make expect will be developed in the future. In addition, we<br />
payment to counterparties to the extent cumulative own approximately $185 million <strong>of</strong> commercial proper-<br />
37
than temporary, the diÅerence between cost and esti-<br />
mated fair value is charged to income as a realized<br />
investment loss.<br />
ties and land parcels under lease. We are continuing to<br />
explore the sale <strong>of</strong> certain <strong>of</strong> our remaining properties.<br />
In <strong>2001</strong>, realized gains on sales <strong>of</strong> equity securities and<br />
Ñxed maturities <strong>of</strong> $46 million and $34 million, respec-<br />
tively, were substantially oÅset by writedowns due to the<br />
Loans receivable, which amounted to $98 million at<br />
December 31, <strong>2001</strong>, are primarily purchase money<br />
mortgages. Such loans, which were issued in connection<br />
with our joint venture activities and other property sales,<br />
are generally collateralized by buildings and, in some recognition <strong>of</strong> other than temporary impairment on<br />
cases, land. We continually evaluate the ultimate collec- certain securities. Sales <strong>of</strong> equity securities in 1999<br />
tibility <strong>of</strong> such loans and establish appropriate reserves. resulted in net realized investment gains due primarily to<br />
the signiÑcant appreciation in United States equity<br />
The recoverability <strong>of</strong> the carrying value <strong>of</strong> our real estate<br />
markets. A primary reason for the sale <strong>of</strong> Ñxed<br />
assets is assessed based on our ability to fully recover<br />
maturities in each <strong>of</strong> the last three years has been to<br />
costs through a future revenue stream. The assumptions<br />
improve our after-tax portfolio return without sacriÑcing<br />
used reÖect a continued improvement in demand for<br />
quality where market opportunities have existed to do<br />
oÇce space, an increase in rental rates and the ability<br />
so.<br />
and intent to obtain Ñnancing in order to hold and<br />
develop such remaining properties and protect our<br />
Fixed maturity securities which the Corporation and its<br />
interests over the long term. Management believes that it<br />
insurance subsidiaries have the ability and intent to hold<br />
has made adequate provisions for impairment <strong>of</strong> real<br />
to maturity are classiÑed as held-to-maturity. The<br />
estate assets. However, if the assets are not sold or<br />
remaining Ñxed maturities, which may be sold prior to<br />
developed as presently contemplated, it is possible that<br />
maturity to support our investment strategies, such as in<br />
additional impairment losses may be recognized.<br />
response to changes in interest rates and the yield curve<br />
Investment Gains and Losses<br />
or to maximize after-tax returns, are classiÑed as available-for-sale.<br />
Fixed maturities classiÑed as held-to-maturity<br />
Net investment gains realized by the Corporation and its<br />
are carried at amortized cost, while Ñxed maturities<br />
property and casualty subsidiaries were as follows:<br />
classiÑed as available-for-sale are carried at market value.<br />
Years Ended<br />
December 31<br />
<strong>2001</strong> 2000 1999<br />
(in millions)<br />
Equity securities ÏÏÏÏÏÏÏÏÏÏÏÏÏÏÏÏÏÏÏÏÏÏÏÏ $ 2 $(1) $63<br />
Fixed maturities ÏÏÏÏÏÏÏÏÏÏÏÏÏÏÏÏÏÏÏÏÏÏÏÏ (1) 8 24<br />
At December 31, <strong>2001</strong>, 8% <strong>of</strong> the Ñxed maturity<br />
portfolio was classiÑed as held-to-maturity compared with<br />
10% at December 31, 2000 and 12% at December 31,<br />
1999.<br />
Sale <strong>of</strong> AAU ÏÏÏÏÏÏÏÏÏÏÏÏÏÏÏÏÏÏÏÏÏÏÏÏÏÏ Ì 45 Ì The unrealized appreciation or depreciation <strong>of</strong> investments<br />
Realized investment gains before tax ÏÏÏÏÏÏÏÏ $ 1 $52 $87<br />
carried at market value, which includes equity<br />
Realized investment gains after taxÏÏÏÏÏÏÏÏÏÏ $ 1 $34 $56<br />
securities and Ñxed maturities classiÑed as available-forsale,<br />
is reÖected in a separate component <strong>of</strong> other<br />
Decisions to sell securities are governed principally by comprehensive income, net <strong>of</strong> applicable deferred<br />
considerations <strong>of</strong> investment opportunities and tax income tax.<br />
consequences. Thus, realized investment gains and losses<br />
on the sale <strong>of</strong> investments may vary signiÑcantly from<br />
The unrealized market appreciation before tax <strong>of</strong> those<br />
year to year.<br />
Ñxed maturities carried at amortized cost was $64 mil-<br />
lion, $69 million and $59 million at December 31, <strong>2001</strong>,<br />
We periodically review the value <strong>of</strong> our invested assets 2000 and 1999, respectively. Such unrealized appreciafor<br />
other than temporary impairment. If a decline in the tion was not reÖected in the consolidated Ñnancial<br />
fair value <strong>of</strong> an individual security is deemed to be other statements.<br />
38
Changes in unrealized market appreciation or depreciation<br />
<strong>of</strong> Ñxed maturities were due primarily to Öuctuations<br />
in interest rates.<br />
Market Risk<br />
Market risk represents the potential for loss due to<br />
adverse changes in the fair value <strong>of</strong> Ñnancial instruments.<br />
Our primary exposure to market risks relates to our<br />
investment portfolio, which exposes the Corporation<br />
and its property and casualty subsidiaries to risks related<br />
to interest rates and, to a lesser extent, credit quality,<br />
prepayment, foreign currency exchange rates and equity<br />
prices. We also have exposure to market risks through<br />
our credit derivatives business and our debt obligations.<br />
Analytical tools and monitoring systems are in place to<br />
assess each <strong>of</strong> these elements <strong>of</strong> market risk.<br />
INVESTMENTS<br />
guidelines established by management and approved by<br />
the boards <strong>of</strong> directors.<br />
The main objectives in managing the investment portfo-<br />
lios <strong>of</strong> the Corporation and its property and casualty<br />
subsidiaries are to maximize after-tax investment income<br />
and total investment returns while minimizing credit<br />
risks in order to provide maximum support to the<br />
insurance underwriting operations. Investment strategies<br />
are developed based on many factors including underwriting<br />
results and our resulting tax position, regulatory<br />
requirements, Öuctuations in interest rates and consideration<br />
<strong>of</strong> other market risks. Investment decisions are<br />
centrally managed by investment pr<strong>of</strong>essionals based on<br />
Interest rate risk is the price sensitivity <strong>of</strong> a security that<br />
promises a Ñxed return to changes in interest rates.<br />
Changes in market interest rates directly aÅect the<br />
market value <strong>of</strong> our Ñxed income securities. We view<br />
the potential changes in price <strong>of</strong> our Ñxed income<br />
investments within the overall context <strong>of</strong> asset and<br />
liability management. Our actuaries estimate the payout<br />
pattern <strong>of</strong> our liabilities, primarily our property and<br />
casualty loss reserves, to determine their duration, which<br />
is the present value <strong>of</strong> the weighted average payments<br />
expressed in years. We set duration targets for our Ñxed<br />
income investment portfolios after consideration <strong>of</strong> the<br />
duration <strong>of</strong> these liabilities and other factors, which we<br />
believe mitigates the overall eÅect <strong>of</strong> interest rate risk for<br />
the Corporation and its property and casualty<br />
subsidiaries.<br />
The following table provides information about our Ñxed<br />
maturity investments which are sensitive to changes in<br />
interest rates. The table presents cash Öows <strong>of</strong> principal<br />
amounts and related weighted average interest rates by<br />
expected maturity dates at December 31, <strong>2001</strong> and<br />
2000. The cash Öows are based on the earlier <strong>of</strong> the call<br />
date or the maturity date or, for mortgage-backed<br />
securities, expected payment patterns. Actual cash Öows<br />
could diÅer from the expected amounts.<br />
At December 31, <strong>2001</strong><br />
Total<br />
Estimated<br />
There- Amortized Market<br />
2002 2003 2004 2005 2006 after Cost Value<br />
(in millions)<br />
Tax-exempt ÏÏÏÏÏÏÏÏÏÏÏÏÏÏÏÏÏÏÏÏÏÏÏÏÏÏÏÏÏÏÏÏÏÏÏÏÏÏÏÏÏÏÏ $ 753 $ 528 $ 826 $1,308 $ 737 $5,120 $ 9,272 $ 9,656<br />
Average interest rate ÏÏÏÏÏÏÏÏÏÏÏÏÏÏÏÏÏÏÏÏÏÏÏÏÏÏÏÏÏÏÏÏÏÏ 6.2% 5.9% 5.8% 5.6% 5.5% 5.3% Ì Ì<br />
Taxable Ì other than mortgage-backed securities ÏÏÏÏÏÏÏÏÏÏÏÏÏ 295 353 407 550 459 2,233 4,297 4,395<br />
Average interest rate ÏÏÏÏÏÏÏÏÏÏÏÏÏÏÏÏÏÏÏÏÏÏÏÏÏÏÏÏÏÏÏÏÏÏ 6.5% 6.2% 6.5% 6.4% 6.4% 6.2% Ì Ì<br />
Mortgage-backed securities ÏÏÏÏÏÏÏÏÏÏÏÏÏÏÏÏÏÏÏÏÏÏÏÏÏÏÏÏÏÏÏ 310 337 226 142 126 971 2,112 2,130<br />
Average interest rate ÏÏÏÏÏÏÏÏÏÏÏÏÏÏÏÏÏÏÏÏÏÏÏÏÏÏÏÏÏÏÏÏÏÏ 7.1% 6.8% 6.4% 6.4% 6.5% 7.0% Ì Ì<br />
Total ÏÏÏÏÏÏÏÏÏÏÏÏÏÏÏÏÏÏÏÏÏÏÏÏÏÏÏÏÏÏÏÏÏÏÏÏÏÏÏÏÏÏÏÏÏÏÏÏ $1,358 $1,218 $1,459 $2,000 $1,322 $8,324 $15,681 $16,181<br />
39
At December 31, 2000<br />
Total<br />
Estimated<br />
There- Amortized Market<br />
<strong>2001</strong> 2002 2003 2004 2005 after Cost Value<br />
(in millions)<br />
Tax-exempt ÏÏÏÏÏÏÏÏÏÏÏÏÏÏÏÏÏÏÏÏÏÏÏÏÏÏÏÏÏÏÏÏÏÏÏÏÏÏÏÏÏÏÏ $ 662 $ 620 $ 586 $ 921 $1,308 $5,453 $ 9,550 $ 9,945<br />
Average interest rate ÏÏÏÏÏÏÏÏÏÏÏÏÏÏÏÏÏÏÏÏÏÏÏÏÏÏÏÏÏÏÏÏÏÏ 6.8% 6.1% 5.9% 5.8% 5.6% 5.3% Ì Ì<br />
Taxable Ì other than mortgage-backed securities ÏÏÏÏÏÏÏÏÏÏÏÏÏ 281 336 390 377 550 1,619 3,553 3,584<br />
Average interest rate ÏÏÏÏÏÏÏÏÏÏÏÏÏÏÏÏÏÏÏÏÏÏÏÏÏÏÏÏÏÏÏÏÏÏ 6.2% 6.4% 6.5% 6.7% 6.6% 6.2% Ì Ì<br />
Mortgage-backed securities ÏÏÏÏÏÏÏÏÏÏÏÏÏÏÏÏÏÏÏÏÏÏÏÏÏÏÏÏÏÏÏ 286 367 281 192 126 862 2,114 2,104<br />
Average interest rate ÏÏÏÏÏÏÏÏÏÏÏÏÏÏÏÏÏÏÏÏÏÏÏÏÏÏÏÏÏÏÏÏÏÏ 7.2% 7.3% 7.2% 7.2% 7.3% 7.4% Ì Ì<br />
Total ÏÏÏÏÏÏÏÏÏÏÏÏÏÏÏÏÏÏÏÏÏÏÏÏÏÏÏÏÏÏÏÏÏÏÏÏÏÏÏÏÏÏÏÏÏÏÏÏ $1,229 $1,323 $1,257 $1,490 $1,984 $7,934 $15,217 $15,633<br />
The Corporation and its property and casualty subsidiar- mortgages consisting <strong>of</strong> government agency pass-through<br />
ies have consistently invested in high quality marketable securities, government agency collateralized mortgage<br />
securities. As a result, we believe that we have minimal obligations (CMOs) and AAA rated non-agency CMOs<br />
credit quality risk. Taxable bonds in our domestic backed by government agency collateral or by single<br />
portfolio comprise U.S. Treasury, government agency, family home mortgages. The majority <strong>of</strong> the CMOs are<br />
mortgage-backed and corporate securities. Approximately actively traded in liquid markets and market value<br />
55% <strong>of</strong> our taxable bonds are issued by the U.S. information is readily available from broker/dealers. An<br />
Treasury or U.S. government agencies or rated AA or additional 30% <strong>of</strong> our mortgage-backed securities were<br />
better by Moody's or Standard and Poor's. Of the tax- call protected AAA rated commercial securities. The<br />
exempt bonds, more than 90% are rated AA or better, remaining mortgage-backed holdings were all in investwith<br />
more than 60% rated AAA. Less than 3% <strong>of</strong> our ment grade commercial mortgage-backed securities.<br />
bond portfolio is below investment grade. Our taxable<br />
bonds have an average maturity <strong>of</strong> six years, while our Foreign currency risk is the sensitivity to foreign<br />
tax-exempt bonds mature on average in eight years. exchange rate Öuctuations <strong>of</strong> the market value and<br />
investment income related to foreign currency denominated<br />
Prepayment risk refers to the changes in prepayment<br />
Ñnancial instruments. The functional currency <strong>of</strong><br />
patterns related to decreases and increases in interest our foreign operations is generally the currency <strong>of</strong> the<br />
rates that can either shorten or lengthen the expected local operating environment since their business is<br />
timing <strong>of</strong> the principal repayments and thus the average transacted primarily in such local currency. We reduce<br />
life and the eÅective yield <strong>of</strong> a security. Such risk exists the risks relating to currency Öuctuations by maintaining<br />
primarily within our portfolio <strong>of</strong> mortgage-backed securiproperty<br />
investments in those foreign currencies in which our<br />
ties. We monitor such risk regularly and invest primarily<br />
and casualty subsidiaries have loss reserves and<br />
in those classes <strong>of</strong> mortgage-backed securities that are other liabilities. Such investments have characteristics<br />
less subject to prepayment risk.<br />
similar to our liabilities in those currencies. At Decem-<br />
ber 31, <strong>2001</strong>, the property and casualty subsidiaries held<br />
Mortgage-backed securities comprised 33% and 37% <strong>of</strong> non-U.S. investments <strong>of</strong> $1.6 billion supporting their<br />
our taxable bond portfolio at year-end <strong>2001</strong> and 2000, international operations. These investments have quality<br />
respectively. About 50% <strong>of</strong> our mortgage-backed securi- and maturity characteristics similar to our domestic<br />
ties holdings at December 31, <strong>2001</strong> related to residential portfolio. The principal currencies creating foreign<br />
40
At December 31, <strong>2001</strong><br />
Total<br />
Estimated<br />
There- Amortized Market<br />
2002 2003 2004 2005 2006 after Cost Value<br />
(in millions)<br />
Euro ÏÏÏÏÏÏÏÏÏÏÏÏÏÏÏÏÏÏÏÏÏÏÏÏÏÏÏÏÏÏÏÏÏÏÏÏÏÏÏÏÏÏÏÏÏÏÏÏÏÏÏÏÏÏ $ 7 $20 $40 $20 $40 $284 $411 $417<br />
Canadian dollar ÏÏÏÏÏÏÏÏÏÏÏÏÏÏÏÏÏÏÏÏÏÏÏÏÏÏÏÏÏÏÏÏÏÏÏÏÏÏÏÏÏÏÏÏÏ 24 21 48 49 53 203 398 415<br />
British pound sterling ÏÏÏÏÏÏÏÏÏÏÏÏÏÏÏÏÏÏÏÏÏÏÏÏÏÏÏÏÏÏÏÏÏÏÏÏÏÏÏÏ 1 9 21 54 38 176 299 302<br />
At December 31, 2000<br />
Total<br />
Estimated<br />
There- Amortized Market<br />
<strong>2001</strong> 2002 2003 2004 2005 after Cost Value<br />
(in millions)<br />
Euro ÏÏÏÏÏÏÏÏÏÏÏÏÏÏÏÏÏÏÏÏÏÏÏÏÏÏÏÏÏÏÏÏÏÏÏÏÏÏÏÏÏÏÏÏÏÏÏÏÏÏÏÏÏÏ $ 9 $24 $25 $28 $14 $213 $313 $317<br />
Canadian dollar ÏÏÏÏÏÏÏÏÏÏÏÏÏÏÏÏÏÏÏÏÏÏÏÏÏÏÏÏÏÏÏÏÏÏÏÏÏÏÏÏÏÏÏÏÏ 23 21 29 26 31 232 362 377<br />
British pound sterling ÏÏÏÏÏÏÏÏÏÏÏÏÏÏÏÏÏÏÏÏÏÏÏÏÏÏÏÏÏÏÏÏÏÏÏÏÏÏÏÏ Ì 13 26 30 34 134 237 240<br />
exchange rate risk for the property and casualty each <strong>of</strong> the equity securities held at December 31, <strong>2001</strong><br />
subsidiaries are the euro, the Canadian dollar and the and 2000 would have resulted in a decrease <strong>of</strong><br />
British pound sterling. The table above provides infor- $71 million and $83 million, respectively, in the fair<br />
mation about those Ñxed maturity investments that are value <strong>of</strong> the equity securities portfolio.<br />
denominated in these currencies. The table presents<br />
cash Öows <strong>of</strong> principal amounts in U.S. dollar<br />
All <strong>of</strong> the above risks are monitored on an ongoing<br />
equivalents by expected maturity dates at December 31, basis. A combination <strong>of</strong> in-house systems and proprie-<br />
<strong>2001</strong> and 2000. Actual cash Öows could diÅer from the tary models and externally licensed s<strong>of</strong>tware are used to<br />
expected amounts.<br />
analyze individual securities as well as each portfolio.<br />
These tools provide the portfolio managers with infor-<br />
Equity price risk is the potential loss arising from mation to assist them in the evaluation <strong>of</strong> the market<br />
adverse changes in the value <strong>of</strong> equity securities. In risks <strong>of</strong> the portfolio.<br />
general, equities have more year-to-year price variability<br />
than intermediate term high grade bonds. However, CREDIT DERIVATIVES<br />
equity returns over longer time frames have been CFSI's obligations with respect to its credit derivatives<br />
consistently higher. Our publicly traded equity securities business are carried at estimated fair value. The fair<br />
are high quality, diversiÑed across industries and readily value <strong>of</strong> our credit default swaps is subject to Öuctuamarketable.<br />
Our portfolio also includes alternative tions arising from, among other factors, changes in<br />
investments, primarily investment partnerships. These credit spreads and interest rates. At December 31, <strong>2001</strong>,<br />
investments by their nature are less liquid than our the fair value <strong>of</strong> future obligations under CFSI's credit<br />
other investments. We actively manage our risk by derivatives business was approximately $48 million,<br />
allocating a comparatively small amount <strong>of</strong> funds to which is included in accrued expenses and other<br />
alternative investments, perform extensive research prior liabilities. For any particular credit default swap, an<br />
to investing in a new investment and monitor the increase in the estimated fair value <strong>of</strong> our obligation may<br />
performance <strong>of</strong> the entities in which we have invested. occur as a result <strong>of</strong> changing market conditions even<br />
A hypothetical decrease <strong>of</strong> 10% in the market price <strong>of</strong> when the probability <strong>of</strong> an actual loss to CFSI remains<br />
41
unlikely. The occurrence <strong>of</strong> an extreme, widespread or<br />
persistent economic event that suggests an actual loss is<br />
possible could result in a material increase in the fair<br />
value <strong>of</strong> our obligations.<br />
December 31, <strong>2001</strong>. For debt obligations, the table<br />
presents expected cash Öows <strong>of</strong> principal amounts and<br />
related weighted average interest rates by maturity date.<br />
For the interest rate swap, the table presents the<br />
notional amount and related interest rates by maturity<br />
date.<br />
We review credit default swaps using quantitative<br />
analysis. When we enter into a credit default swap, we<br />
believe the credit quality in most instances is at least Capital Resources<br />
equal to the upper end <strong>of</strong> the investment grade credit In July 1998, the Board <strong>of</strong> Directors authorized the<br />
spectrum. At December 31, <strong>2001</strong>, CFSI's aggregate repurchase <strong>of</strong> up to 12,500,000 shares <strong>of</strong> the Corporaexposure<br />
or retained risk, referred to as notional<br />
tion's common stock. In June <strong>2001</strong>, the Board <strong>of</strong><br />
amounts, from its open credit default swaps was<br />
Directors authorized the repurchase <strong>of</strong> up to an<br />
approximately $14.3 billion. The notional amounts are additional 16,000,000 shares. The 1998 authorization has<br />
used to express the extent <strong>of</strong> involvement in swap no expiration while the <strong>2001</strong> authorization will expire<br />
transactions. The notional amounts are not a quantiÑca- on June 30, 2003. As <strong>of</strong> December 31, <strong>2001</strong>, 3,287,100<br />
tion <strong>of</strong> market risk or credit risk and are not recorded shares remained under the 1998 share repurchase<br />
on the balance sheet. These amounts are used to authorization and 10,366,300 shares remained under the<br />
calculate the exchange <strong>of</strong> contractual cash Öows and are <strong>2001</strong> authorization. In the aggregate, the Corporation<br />
not necessarily representative <strong>of</strong> the potential for gain or repurchased 7,971,600 shares in open-market transacloss.<br />
Since our position is senior to other subordinated tions in <strong>2001</strong> at a cost <strong>of</strong> $556 million, 3,783,400 shares<br />
interests and exposure to a single default within a in 2000 at a cost <strong>of</strong> $242 million and 2,596,700 shares<br />
referenced portfolio is limited, the severity <strong>of</strong> loss from in 1999 at a cost <strong>of</strong> $145 million.<br />
our credit default swaps is likely to be lower than that<br />
<strong>of</strong> a similarly rated debt security portfolio valued at<br />
The Corporation's Ñnancial strength provides the capac-<br />
$14.3 billion.<br />
ity and Öexibility to raise funds in the capital markets.<br />
The Corporation Ñled a shelf registration statement in<br />
DEBT<br />
We also have interest rate risk on our debt obligations.<br />
The table below provides information about our long<br />
term debt obligations and related interest rate swap at<br />
December <strong>2001</strong>. When it is declared eÅective by the<br />
Securities and Exchange Commission, up to $1 billion<br />
<strong>of</strong> various types <strong>of</strong> securities may be issued by the<br />
Corporation.<br />
At December 31, <strong>2001</strong><br />
Estimated<br />
There-<br />
Market<br />
2002 2003 2004 2005 2006 after Total Value<br />
(in millions)<br />
Long-term debt<br />
Expected cash Öows <strong>of</strong> principal amountsÏÏÏÏÏÏÏÏÏÏÏÏÏÏÏÏÏÏÏÏÏÏÏ $ 8 $101 $Ì $301 $Ì $941 $1,351 $1,387<br />
Average interest rate ÏÏÏÏÏÏÏÏÏÏÏÏÏÏÏÏÏÏÏÏÏÏÏÏÏÏÏÏÏÏÏÏÏÏÏÏÏ 3.6% 6.9% Ì 6.2% Ì 6.8%<br />
Interest rate swap<br />
Notional amount ÏÏÏÏÏÏÏÏÏÏÏÏÏÏÏÏÏÏÏÏÏÏÏÏÏÏÏÏÏÏÏÏÏÏÏÏÏÏÏÏÏÏ $Ì $ Ì $Ì $ Ì $Ì $125 $ 125 $ Ì<br />
Variable pay rate ÏÏÏÏÏÏÏÏÏÏÏÏÏÏÏÏÏÏÏÏÏÏÏÏÏÏÏÏÏÏÏÏÏÏÏÏÏÏÏÏ<br />
4.3%(a)<br />
Fixed receive rate ÏÏÏÏÏÏÏÏÏÏÏÏÏÏÏÏÏÏÏÏÏÏÏÏÏÏÏÏÏÏÏÏÏÏÏÏÏÏÏÏ 8.7%<br />
(a) 3-month LIBOR rate plus 204 basis points<br />
42
In November <strong>2001</strong>, the Corporation sold $400 million The Corporation has two credit agreements with a<br />
<strong>of</strong> unsecured 6% notes due in 2011 and $200 million <strong>of</strong> group <strong>of</strong> banks that provide for unsecured borrowings<br />
unsecured 6.8% debentures due in 2031 under a<br />
<strong>of</strong> up to $500 million in the aggregate. The $200 million<br />
previously Ñled shelf registration. The proceeds were short term revolving credit facility, which was to have<br />
used for general corporate purposes. terminated on July 4, <strong>2001</strong>, was extended to July 2,<br />
2002. The $300 million medium term revolving credit<br />
The Corporation also has outstanding $300 million <strong>of</strong> facility terminates on July 11, 2002. On the respective<br />
unsecured 6.15% notes due in 2005 and $100 million <strong>of</strong> termination dates, any loans then outstanding become<br />
unsecured 6.60% debentures due in 2018. <strong>Chubb</strong> payable. There have been no borrowings under these<br />
Capital Corporation, a wholly owned subsidiary, has agreements. Management anticipates that similar credit<br />
outstanding $100 million <strong>of</strong> unsecured 6 7 /8% notes due agreements will replace these agreements. These facilities<br />
in 2003. The <strong>Chubb</strong> Capital notes are guaranteed by are available for general corporate purposes and to<br />
the Corporation.<br />
support the Corporation's commercial paper borrowing<br />
arrangement.<br />
The long term debt obligations <strong>of</strong> Executive Risk<br />
remained in place subsequent to its acquisition in 1999.<br />
Change in Accounting Principles<br />
<strong>Chubb</strong> Executive Risk Inc., a wholly owned subsidiary In June <strong>2001</strong>, the Financial Accounting Standards Board<br />
<strong>of</strong> the Corporation, has outstanding $75 million <strong>of</strong> issued Statement <strong>of</strong> Financial Accounting Standards<br />
unsecured 7 1/8% notes due in 2007. Executive Risk (SFAS) No. 142, Goodwill and Other Intangible<br />
Capital Trust, wholly owned by <strong>Chubb</strong> Executive Risk, Assets. The Statement addresses how intangible assets<br />
has outstanding $125 million <strong>of</strong> 8.675% capital securi- should be accounted for upon their acquisition and how<br />
ties. The sole assets <strong>of</strong> the Trust are debentures issued goodwill and other intangible assets should be accounted<br />
by <strong>Chubb</strong> Executive Risk. The capital securities are for after they have been initially recognized in the<br />
subject to mandatory redemption in 2027 upon repay- Ñnancial statements. Under SFAS No. 142, goodwill will<br />
ment <strong>of</strong> the debentures. The capital securities are also no longer be amortized but rather will be tested at least<br />
subject to mandatory redemption under certain circum- annually for impairment. The provisions <strong>of</strong> SFAS<br />
stances beginning in 2007. The Corporation has guaran- No. 142 are eÅective for the Corporation for the year<br />
teed the unsecured notes and the capital securities. beginning January 1, 2002. The Statement will be<br />
applied to goodwill recognized in the Corporation's<br />
In August <strong>2001</strong>, the Corporation entered into a<br />
Ñnancial statements at that date. SFAS No. 142 may not<br />
cancelable interest rate swap in order to monetize the be applied retroactively to Ñnancial statements <strong>of</strong> prior<br />
value <strong>of</strong> the call option embedded in the $125 million periods. The elimination <strong>of</strong> goodwill amortization is<br />
8.675% capital securities. Under the terms <strong>of</strong> the expected to result in an increase in net income in 2002<br />
interest rate swap, the Corporation receives 8.675% and <strong>of</strong> approximately $20 million. The Corporation is in the<br />
pays the counterparty the 3-month LIBOR rate plus process <strong>of</strong> assessing the eÅect, if any, that the implemen-<br />
204 basis points. As a result <strong>of</strong> entering into the swap, tation <strong>of</strong> the other provisions <strong>of</strong> SFAS No. 142 will<br />
interest costs related to this portion <strong>of</strong> our debt will have on its consolidated Ñnancial position or results <strong>of</strong><br />
Öoat with short term interest rates.<br />
operations.<br />
43
TEN YEAR FINANCIAL SUMMARY<br />
(in millions except for per share amounts)<br />
FOR THE YEAR <strong>2001</strong> 2000 1999<br />
Income<br />
Property and Casualty <strong>Insurance</strong><br />
Underwriting Income (Loss) ÏÏÏÏÏÏÏÏÏÏÏÏÏÏÏÏÏÏÏÏÏÏÏÏÏÏÏÏÏÏÏÏÏÏÏ $(903.5)(a) $ (23.6) $(178.8)<br />
Investment IncomeÏÏÏÏÏÏÏÏÏÏÏÏÏÏÏÏÏÏÏÏÏÏÏÏÏÏÏÏÏÏÏÏÏÏÏÏÏÏÏÏÏÏÏÏ 902.6 879.2 821.0<br />
Amortization <strong>of</strong> Goodwill and Other ChargesÏÏÏÏÏÏÏÏÏÏÏÏÏÏÏÏÏÏÏÏÏ (52.3)(a) (52.2) (16.0)<br />
Property and Casualty <strong>Insurance</strong> Income (Loss)ÏÏÏÏÏÏÏÏÏÏÏÏÏÏÏÏÏÏÏÏ (53.2) 803.4 626.2<br />
Corporate and OtherÏÏÏÏÏÏÏÏÏÏÏÏÏÏÏÏÏÏÏÏÏÏÏÏÏÏÏÏÏÏÏÏÏÏÏÏÏÏÏÏÏÏÏ (13.6) (3.9) (3.5)<br />
Operating Income (Loss) from Continuing Operations<br />
Before Income Tax ÏÏÏÏÏÏÏÏÏÏÏÏÏÏÏÏÏÏÏÏÏÏÏÏÏÏÏÏÏÏÏÏÏÏÏÏÏÏÏÏÏ (66.8) 799.5 622.7<br />
Federal and Foreign Income Tax (Credit)ÏÏÏÏÏÏÏÏÏÏÏÏÏÏÏÏÏÏÏÏÏÏÏÏÏ (177.8) 118.4 57.4<br />
Operating Income from Continuing Operations ÏÏÏÏÏÏÏÏÏÏÏÏÏÏÏÏÏÏ 111.0 681.1 565.3<br />
Realized Investment Gains from Continuing OperationsÏÏÏÏÏÏÏÏÏÏÏÏÏÏÏ .5 33.5 55.8<br />
Income from Continuing Operations ÏÏÏÏÏÏÏÏÏÏÏÏÏÏÏÏÏÏÏÏÏÏÏÏÏÏÏÏ 111.5 714.6 621.1<br />
Income from Discontinued Operations (1) ÏÏÏÏÏÏÏÏÏÏÏÏÏÏÏÏÏÏÏÏÏÏÏÏ Ì Ì Ì<br />
Net Income ÏÏÏÏÏÏÏÏÏÏÏÏÏÏÏÏÏÏÏÏÏÏÏÏÏÏÏÏÏÏÏÏÏÏÏÏÏÏÏÏÏÏÏÏÏÏÏÏÏÏ 111.5 714.6 621.1<br />
Property and Casualty Investment Income After Income TaxÏÏÏÏÏÏÏÏÏ 749.1 735.2 691.9<br />
Dividends Declared on Common Stock ÏÏÏÏÏÏÏÏÏÏÏÏÏÏÏÏÏÏÏÏÏÏÏÏÏÏÏÏÏ 234.8 230.6 216.5<br />
Net Change in Unrealized Appreciation or<br />
Depreciation <strong>of</strong> Investments, Net <strong>of</strong> Tax (2) ÏÏÏÏÏÏÏÏÏÏÏÏÏÏÏÏÏÏÏÏÏÏ 32.5 332.7 (527.3)<br />
Per Share<br />
Operating Income from Continuing Operations ÏÏÏÏÏÏÏÏÏÏÏÏÏÏÏÏÏÏÏÏ .63(a) 3.82 3.33<br />
Income from Continuing Operations ÏÏÏÏÏÏÏÏÏÏÏÏÏÏÏÏÏÏÏÏÏÏÏÏÏÏÏÏÏ .63 4.01 3.66<br />
Income from Discontinued Operations (1) ÏÏÏÏÏÏÏÏÏÏÏÏÏÏÏÏÏÏÏÏÏÏÏÏ Ì Ì Ì<br />
Net Income ÏÏÏÏÏÏÏÏÏÏÏÏÏÏÏÏÏÏÏÏÏÏÏÏÏÏÏÏÏÏÏÏÏÏÏÏÏÏÏÏÏÏÏÏÏÏÏÏÏÏÏ .63 4.01 3.66<br />
Dividends Declared on Common Stock ÏÏÏÏÏÏÏÏÏÏÏÏÏÏÏÏÏÏÏÏÏÏÏÏÏÏÏ 1.36 1.32 1.28<br />
Average Common and Potentially Dilutive Shares ÏÏÏÏÏÏÏÏÏÏÏÏÏÏÏÏÏÏÏÏ 175.8 178.3 169.8<br />
(1) In May 1997, the Corporation sold its life and health insurance operations, which have been classiÑed as discontinued operations.<br />
(2) Amounts prior to 1994 do not reÖect the accounting changes prescribed by Statement <strong>of</strong> Financial Accounting Standards No. 115,<br />
Accounting for Certain Investments in Debt and Equity Securities, as restatement <strong>of</strong> prior year amounts was not permitted. The change<br />
in unrealized appreciation or depreciation <strong>of</strong> investments for 1994 excludes a $220.5 million increase in unrealized appreciation, as <strong>of</strong><br />
January 1, 1994, resulting from the change in accounting principle.<br />
44
1998 1997 1996 1995 1994 1993 1992<br />
$ (6.6) $ 141.1 $ 54.3 $ 111.7 $ .4 $(528.9)(b) $ (46.3)<br />
748.9 711.2 646.1 603.0 560.5 533.7 493.5<br />
(57.4)(c) (24.1) (24.0) (17.5) (8.7) (6.2) (4.3)<br />
684.9 828.2 676.4 697.2 552.2 (1.4) 442.9<br />
22.9 40.7 (209.3)(d) 31.0 5.0 24.5 43.8<br />
707.8 868.9 467.1 728.2 557.2 23.1 486.7<br />
93.0 167.8 32.9 144.5 84.4 (107.0) 49.4<br />
614.8 701.1 434.2 583.7 472.8 130.1 437.3<br />
92.2 68.4 52.0 70.7 35.1 137.3 114.8<br />
707.0 769.5 486.2 654.4 507.9 267.4 552.1<br />
Ì Ì 26.5 42.2 20.6 76.8 65.0<br />
707.0 769.5 512.7 696.6 528.5 324.2 (e) 617.1<br />
634.1 592.3 544.2 507.2 475.0 455.4 422.8<br />
204.7 198.3 188.7 170.6 161.1 150.8 139.6<br />
14.6 161.4 (107.2) 470.2 (487.9) 46.5 (82.1)<br />
3.65 (c) 4.00 2.44 (d) 3.27 2.66 .77 (b) 2.47<br />
4.19 4.39 2.73 3.67 2.85 1.52 3.10<br />
Ì Ì .15 .23 .11 .42 .36<br />
4.19 4.39 2.88 3.90 2.96 1.83 (e) 3.46<br />
1.24 1.16 1.08 .98 .92 .86 .80<br />
168.6 176.2 181.6 180.9 181.6 182.2 181.4<br />
(a) Underwriting income has been reduced by net costs <strong>of</strong> $635.0 million and other charges include costs <strong>of</strong> $10.0 million (in the aggregate,<br />
$420.0 million after-tax or $2.39 per share) related to the September 11 attack. Underwriting income also has been reduced by net<br />
surety bond losses <strong>of</strong> $220.0 million ($143.0 million after-tax or $0.81 per share) related to the bankruptcy <strong>of</strong> Enron Corp.<br />
(b) Underwriting income has been reduced by $550.0 million ($357.5 million after-tax or $1.96 per share) for the net eÅect <strong>of</strong> a $675.0<br />
million increase in unpaid claims related to an agreement for the settlement <strong>of</strong> asbestos-related litigation and a $125.0 million return<br />
premium related to the commutation <strong>of</strong> a medical malpractice reinsurance agreement.<br />
(c) Property and casualty insurance other charges includes a restructuring charge <strong>of</strong> $40.0 million ($26.0 million after-tax or $0.15 per<br />
share).<br />
(d) Real estate income has been reduced by a charge <strong>of</strong> $255.0 million ($160.0 million after-tax or $0.89 per share) for the writedown <strong>of</strong> the<br />
carrying value <strong>of</strong> certain real estate assets to their estimated fair value.<br />
(e) Net income has been reduced by a one-time charge <strong>of</strong> $20.0 million or $0.11 per share for the cumulative eÅect <strong>of</strong> changes in accounting<br />
principles resulting from the Corporation's adoption <strong>of</strong> Statements <strong>of</strong> Financial Accounting Standards No. 106, Employers' Accounting<br />
for Postretirement BeneÑts Other Than Pensions, and No. 109, Accounting for Income Taxes. Income before the cumulative eÅect <strong>of</strong><br />
changes in accounting principles was $344.2 million or $1.94 per share.<br />
45
TEN YEAR FINANCIAL SUMMARY<br />
(in millions except for per share amounts)<br />
FOR THE YEAR <strong>2001</strong> 2000 1999<br />
Revenues<br />
Property and Casualty <strong>Insurance</strong><br />
Premiums Earned ÏÏÏÏÏÏÏÏÏÏÏÏÏÏÏÏÏÏÏÏÏÏÏÏÏÏÏÏÏÏÏÏÏÏÏÏÏÏÏÏ $ 6,656.4 $ 6,145.9 $ 5,652.0<br />
Investment Income ÏÏÏÏÏÏÏÏÏÏÏÏÏÏÏÏÏÏÏÏÏÏÏÏÏÏÏÏÏÏÏÏÏÏÏÏÏÏÏ 914.7 890.8 832.6<br />
Corporate Investment Income ÏÏÏÏÏÏÏÏÏÏÏÏÏÏÏÏÏÏÏÏÏÏÏÏÏÏÏÏÏÏ 68.1 66.4 60.8<br />
Real Estate and Other ÏÏÏÏÏÏÏÏÏÏÏÏÏÏÏÏÏÏÏÏÏÏÏÏÏÏÏÏÏÏÏÏÏÏÏÏÏ 114.0 96.9 96.8<br />
Realized Investment Gains ÏÏÏÏÏÏÏÏÏÏÏÏÏÏÏÏÏÏÏÏÏÏÏÏÏÏÏÏÏÏÏÏÏÏ .8 51.5 87.4<br />
Total Revenues ÏÏÏÏÏÏÏÏÏÏÏÏÏÏÏÏÏÏÏÏÏÏÏÏÏÏÏÏÏÏÏÏÏÏÏÏÏÏÏÏ 7,754.0 7,251.5 6,729.6<br />
AT YEAR END<br />
Total Assets ÏÏÏÏÏÏÏÏÏÏÏÏÏÏÏÏÏÏÏÏÏÏÏÏÏÏÏÏÏÏÏÏÏÏÏÏÏÏÏÏÏÏÏÏÏÏÏÏ 29,449.0 25,026.7 23,537.0<br />
Invested Assets<br />
Property and Casualty <strong>Insurance</strong> ÏÏÏÏÏÏÏÏÏÏÏÏÏÏÏÏÏÏÏÏÏÏÏÏÏÏÏÏ 16,853.3 15,804.5 14,869.9<br />
CorporateÏÏÏÏÏÏÏÏÏÏÏÏÏÏÏÏÏÏÏÏÏÏÏÏÏÏÏÏÏÏÏÏÏÏÏÏÏÏÏÏÏÏÏÏÏÏÏÏ 930.6 1,196.1 1,149.5<br />
Unpaid Claims and Claim ExpensesÏÏÏÏÏÏÏÏÏÏÏÏÏÏÏÏÏÏÏÏÏÏÏÏÏÏÏÏ 15,514.9 11,904.6 11,434.7<br />
Long Term DebtÏÏÏÏÏÏÏÏÏÏÏÏÏÏÏÏÏÏÏÏÏÏÏÏÏÏÏÏÏÏÏÏÏÏÏÏÏÏÏÏÏÏÏÏ 1,351.0 753.8 759.2<br />
Total Shareholders' Equity ÏÏÏÏÏÏÏÏÏÏÏÏÏÏÏÏÏÏÏÏÏÏÏÏÏÏÏÏÏÏÏÏÏÏÏ 6,525.3 6,981.7 6,271.8<br />
Per Common Share ÏÏÏÏÏÏÏÏÏÏÏÏÏÏÏÏÏÏÏÏÏÏÏÏÏÏÏÏÏÏÏÏÏÏÏÏÏÏÏ 38.37 39.91 35.74<br />
Per Common Share, with Available-for-Sale Fixed Maturities at<br />
Amortized Cost ÏÏÏÏÏÏÏÏÏÏÏÏÏÏÏÏÏÏÏÏÏÏÏÏÏÏÏÏÏÏÏÏÏÏÏÏÏÏÏÏÏ 36.60 38.60 36.58<br />
Actual Common Shares OutstandingÏÏÏÏÏÏÏÏÏÏÏÏÏÏÏÏÏÏÏÏÏÏÏÏÏÏÏ 170.1 174.9 175.5<br />
Amounts prior to 1994 do not reÖect the accounting changes prescribed by Statement <strong>of</strong> Financial Accounting Standards No. 115,<br />
Accounting for Certain Investments in Debt and Equity Securities, as restatement <strong>of</strong> prior year amounts was not permitted.<br />
46
1998 1997 1996 1995 1994 1993 1992<br />
$ 5,303.8 $ 5,157.4 $ 4,569.3 $ 4,147.2 $ 3,776.3 $ 3,504.8(a) $ 3,163.3<br />
760.0 721.4 656.2 613.3 570.5 541.7 501.1<br />
61.9 63.9 55.4 54.4 49.4 52.7 57.2<br />
82.2 616.1 319.8 287.8 204.9 160.6 150.0<br />
141.9 105.2 79.8 108.8 54.1 210.6 174.1<br />
6,349.8 6,664.0 5,680.5 5,211.5 4,655.2 4,470.4 4,045.7<br />
20,746.0 19,615.6 19,938.9 19,636.3 17,761.0 16,729.5 15,197.6<br />
13,715.0 12,777.3 11,190.7 10,013.6 8,938.8 8,403.1 7,767.5<br />
1,040.3 1,272.3 890.4 906.6 879.5 965.7 955.8<br />
10,356.5 9,772.5 9,523.7 9,588.2 8,913.2 8,235.4 7,220.9<br />
607.5 398.6 1,070.5 1,150.8 1,279.6 1,267.2 1,065.6<br />
5,644.1 5,657.1 5,462.9 5,262.7 4,247.0 4,196.1 3,954.4<br />
34.78 33.53 31.24 30.14 24.46 23.92 22.59<br />
32.59 31.69 30.27 28.51 25.30 23.92 22.59<br />
162.3 168.7 174.9 174.6 173.6 175.4 175.0<br />
(a) Premiums earned have been increased by a $125.0 million return premium to the Corporation's property and casualty insurance<br />
subsidiaries related to the commutation <strong>of</strong> a medical malpractice reinsurance agreement.<br />
47
THE CHUBB CORPORATION<br />
Consolidated Statements <strong>of</strong> Income<br />
Revenues<br />
In Millions<br />
Years Ended December 31<br />
<strong>2001</strong> 2000 1999<br />
Premiums Earned ÏÏÏÏÏÏÏÏÏÏÏÏÏÏÏÏÏÏÏÏÏÏÏÏÏÏÏÏÏÏÏÏÏÏÏÏÏÏÏÏÏÏÏÏÏÏÏÏÏ $6,656.4 $6,145.9 $5,652.0<br />
Investment Income ÏÏÏÏÏÏÏÏÏÏÏÏÏÏÏÏÏÏÏÏÏÏÏÏÏÏÏÏÏÏÏÏÏÏÏÏÏÏÏÏÏÏÏÏÏÏÏÏ 982.8 957.2 893.4<br />
Real Estate and Other Revenues ÏÏÏÏÏÏÏÏÏÏÏÏÏÏÏÏÏÏÏÏÏÏÏÏÏÏÏÏÏÏÏÏÏÏÏÏ 114.0 96.9 96.8<br />
Realized Investment GainsÏÏÏÏÏÏÏÏÏÏÏÏÏÏÏÏÏÏÏÏÏÏÏÏÏÏÏÏÏÏÏÏÏÏÏÏÏÏÏÏÏÏ .8 51.5 87.4<br />
TOTAL REVENUES ÏÏÏÏÏÏÏÏÏÏÏÏÏÏÏÏÏÏÏÏÏÏÏÏÏÏÏÏÏÏÏÏÏÏÏÏÏÏÏÏÏ 7,754.0 7,251.5 6,729.6<br />
Claims and Expenses<br />
<strong>Insurance</strong> Claims and Claim Expenses ÏÏÏÏÏÏÏÏÏÏÏÏÏÏÏÏÏÏÏÏÏÏÏÏÏÏÏÏÏÏÏÏ 5,357.4 4,127.7 3,942.0<br />
Amortization <strong>of</strong> Deferred Policy Acquisition Costs ÏÏÏÏÏÏÏÏÏÏÏÏÏÏÏÏÏÏÏÏÏ 1,771.4 1,645.4 1,529.7<br />
Other <strong>Insurance</strong> Operating Costs and Expenses ÏÏÏÏÏÏÏÏÏÏÏÏÏÏÏÏÏÏÏÏÏÏÏ 483.4 448.6 375.1<br />
Real Estate and Other Expenses ÏÏÏÏÏÏÏÏÏÏÏÏÏÏÏÏÏÏÏÏÏÏÏÏÏÏÏÏÏÏÏÏÏÏÏÏÏ 110.1 87.9 100.3<br />
Investment ExpensesÏÏÏÏÏÏÏÏÏÏÏÏÏÏÏÏÏÏÏÏÏÏÏÏÏÏÏÏÏÏÏÏÏÏÏÏÏÏÏÏÏÏÏÏÏÏÏ 14.1 13.7 13.7<br />
Corporate Expenses ÏÏÏÏÏÏÏÏÏÏÏÏÏÏÏÏÏÏÏÏÏÏÏÏÏÏÏÏÏÏÏÏÏÏÏÏÏÏÏÏÏÏÏÏÏÏÏ 83.6 77.2 58.7<br />
TOTAL CLAIMS AND EXPENSES ÏÏÏÏÏÏÏÏÏÏÏÏÏÏÏÏÏÏÏÏÏÏÏÏÏÏÏÏ 7,820.0 6,400.5 6,019.5<br />
INCOME (LOSS) BEFORE FEDERAL AND FOREIGN<br />
INCOME TAX ÏÏÏÏÏÏÏÏÏÏÏÏÏÏÏÏÏÏÏÏÏÏÏÏÏÏÏÏÏÏÏÏÏÏÏÏÏÏÏÏÏÏÏÏÏ (66.0) 851.0 710.1<br />
Federal and Foreign Income Tax (Credit) ÏÏÏÏÏÏÏÏÏÏÏÏÏÏÏÏÏÏÏÏÏÏÏÏÏÏÏÏÏ (177.5) 136.4 89.0<br />
NET INCOME ÏÏÏÏÏÏÏÏÏÏÏÏÏÏÏÏÏÏÏÏÏÏÏÏÏÏÏÏÏÏÏÏÏÏÏÏÏÏÏÏÏÏÏÏÏÏÏ $ 111.5 $ 714.6 $ 621.1<br />
Net Income Per Share<br />
Basic ÏÏÏÏÏÏÏÏÏÏÏÏÏÏÏÏÏÏÏÏÏÏÏÏÏÏÏÏÏÏÏÏÏÏÏÏÏÏÏÏÏÏÏÏÏÏÏÏÏÏÏÏÏÏÏÏ $ .65 $ 4.10 $ 3.70<br />
Diluted ÏÏÏÏÏÏÏÏÏÏÏÏÏÏÏÏÏÏÏÏÏÏÏÏÏÏÏÏÏÏÏÏÏÏÏÏÏÏÏÏÏÏÏÏÏÏÏÏÏÏÏÏÏÏ .63 4.01 3.66<br />
See accompanying notes.<br />
48
THE CHUBB CORPORATION<br />
Consolidated Balance Sheets<br />
In Millions<br />
December 31<br />
Assets<br />
Invested Assets<br />
Short Term InvestmentsÏÏÏÏÏÏÏÏÏÏÏÏÏÏÏÏÏÏÏÏÏÏÏÏÏÏÏÏÏÏÏÏÏÏÏÏÏÏÏÏÏÏ $<br />
<strong>2001</strong><br />
956.8 $<br />
2000<br />
605.6<br />
Fixed Maturities<br />
Held-to-Maturity Ì Tax Exempt (market $1,282.5 and $1,564.7) ÏÏÏÏ 1,218.5 1,496.1<br />
Available-for-Sale<br />
Tax Exempt (cost $8,053.8 and $8,053.8) ÏÏÏÏÏÏÏÏÏÏÏÏÏÏÏÏÏÏÏÏÏÏ 8,372.9 8,380.5<br />
Taxable (cost $6,408.2 and $5,666.6) ÏÏÏÏÏÏÏÏÏÏÏÏÏÏÏÏÏÏÏÏÏÏÏÏÏÏ 6,525.3 5,687.8<br />
Equity Securities (cost $757.9 and $839.8)ÏÏÏÏÏÏÏÏÏÏÏÏÏÏÏÏÏÏÏÏÏÏÏÏÏÏ 710.4 830.6<br />
TOTAL INVESTED ASSETS ÏÏÏÏÏÏÏÏÏÏÏÏÏÏÏÏÏÏÏÏÏÏÏÏÏÏÏÏÏÏÏÏÏÏ 17,783.9 17,000.6<br />
Cash ÏÏÏÏÏÏÏÏÏÏÏÏÏÏÏÏÏÏÏÏÏÏÏÏÏÏÏÏÏÏÏÏÏÏÏÏÏÏÏÏÏÏÏÏÏÏÏÏÏÏÏÏÏÏÏÏÏÏÏÏ 25.8 22.4<br />
Securities Lending Collateral ÏÏÏÏÏÏÏÏÏÏÏÏÏÏÏÏÏÏÏÏÏÏÏÏÏÏÏÏÏÏÏÏÏÏÏÏÏÏÏÏ 417.5 451.1<br />
Accrued Investment Income ÏÏÏÏÏÏÏÏÏÏÏÏÏÏÏÏÏÏÏÏÏÏÏÏÏÏÏÏÏÏÏÏÏÏÏÏÏÏÏÏ 247.7 246.8<br />
Premiums ReceivableÏÏÏÏÏÏÏÏÏÏÏÏÏÏÏÏÏÏÏÏÏÏÏÏÏÏÏÏÏÏÏÏÏÏÏÏÏÏÏÏÏÏÏÏÏÏÏ 1,692.8 1,409.8<br />
Reinsurance Recoverable on Unpaid Claims and Claim Expenses ÏÏÏÏÏÏÏÏ 4,505.2 1,853.3<br />
Prepaid Reinsurance Premiums ÏÏÏÏÏÏÏÏÏÏÏÏÏÏÏÏÏÏÏÏÏÏÏÏÏÏÏÏÏÏÏÏÏÏÏÏÏÏ 340.8 246.0<br />
Deferred Policy Acquisition CostsÏÏÏÏÏÏÏÏÏÏÏÏÏÏÏÏÏÏÏÏÏÏÏÏÏÏÏÏÏÏÏÏÏÏÏÏ 928.8 842.0<br />
Real Estate Assets ÏÏÏÏÏÏÏÏÏÏÏÏÏÏÏÏÏÏÏÏÏÏÏÏÏÏÏÏÏÏÏÏÏÏÏÏÏÏÏÏÏÏÏÏÏÏÏÏÏ 646.6 677.1<br />
Investments in Partially Owned <strong>Companies</strong>ÏÏÏÏÏÏÏÏÏÏÏÏÏÏÏÏÏÏÏÏÏÏÏÏÏÏÏÏ 386.2 122.9<br />
Deferred Income Tax ÏÏÏÏÏÏÏÏÏÏÏÏÏÏÏÏÏÏÏÏÏÏÏÏÏÏÏÏÏÏÏÏÏÏÏÏÏÏÏÏÏÏÏÏÏÏ 674.8 501.0<br />
Goodwill ÏÏÏÏÏÏÏÏÏÏÏÏÏÏÏÏÏÏÏÏÏÏÏÏÏÏÏÏÏÏÏÏÏÏÏÏÏÏÏÏÏÏÏÏÏÏÏÏÏÏÏÏÏÏÏÏÏ 467.4 487.3<br />
Other AssetsÏÏÏÏÏÏÏÏÏÏÏÏÏÏÏÏÏÏÏÏÏÏÏÏÏÏÏÏÏÏÏÏÏÏÏÏÏÏÏÏÏÏÏÏÏÏÏÏÏÏÏÏÏÏ 1,331.5 1,166.4<br />
TOTAL ASSETS ÏÏÏÏÏÏÏÏÏÏÏÏÏÏÏÏÏÏÏÏÏÏÏÏÏÏÏÏÏÏÏÏÏÏÏÏÏÏÏÏÏÏÏÏÏ $29,449.0 $25,026.7<br />
Liabilities<br />
Unpaid Claims and Claim Expenses ÏÏÏÏÏÏÏÏÏÏÏÏÏÏÏÏÏÏÏÏÏÏÏÏÏÏÏÏÏÏÏÏÏÏ $15,514.9 $11,904.6<br />
Unearned Premiums ÏÏÏÏÏÏÏÏÏÏÏÏÏÏÏÏÏÏÏÏÏÏÏÏÏÏÏÏÏÏÏÏÏÏÏÏÏÏÏÏÏÏÏÏÏÏÏ 3,916.2 3,516.3<br />
Securities Lending Payable ÏÏÏÏÏÏÏÏÏÏÏÏÏÏÏÏÏÏÏÏÏÏÏÏÏÏÏÏÏÏÏÏÏÏÏÏÏÏÏÏÏÏ 417.5 451.1<br />
Short Term DebtÏÏÏÏÏÏÏÏÏÏÏÏÏÏÏÏÏÏÏÏÏÏÏÏÏÏÏÏÏÏÏÏÏÏÏÏÏÏÏÏÏÏÏÏÏÏÏÏÏÏ 199.0 Ì<br />
Long Term Debt ÏÏÏÏÏÏÏÏÏÏÏÏÏÏÏÏÏÏÏÏÏÏÏÏÏÏÏÏÏÏÏÏÏÏÏÏÏÏÏÏÏÏÏÏÏÏÏÏÏÏ 1,351.0 753.8<br />
Dividend Payable to Shareholders ÏÏÏÏÏÏÏÏÏÏÏÏÏÏÏÏÏÏÏÏÏÏÏÏÏÏÏÏÏÏÏÏÏÏÏÏ 57.8 57.8<br />
Accrued Expenses and Other LiabilitiesÏÏÏÏÏÏÏÏÏÏÏÏÏÏÏÏÏÏÏÏÏÏÏÏÏÏÏÏÏÏÏ 1,467.3 1,361.4<br />
TOTAL LIABILITIES ÏÏÏÏÏÏÏÏÏÏÏÏÏÏÏÏÏÏÏÏÏÏÏÏÏÏÏÏÏÏÏÏÏÏÏÏÏÏÏÏÏ 22,923.7 18,045.0<br />
Commitments and Contingent Liabilities (Notes 9, 15 and 16)<br />
Shareholders' Equity<br />
Preferred Stock Ì Authorized 4,000,000 Shares;<br />
$1 Par Value; Issued Ì None ÏÏÏÏÏÏÏÏÏÏÏÏÏÏÏÏÏÏÏÏÏÏÏÏÏÏÏÏÏÏÏÏÏÏÏÏÏ Ì Ì<br />
Common Stock Ì Authorized 600,000,000 Shares;<br />
$1 Par Value; Issued 180,131,238 and 178,833,278 Shares ÏÏÏÏÏÏÏÏÏÏÏÏÏ 180.1 178.8<br />
Paid-In Surplus ÏÏÏÏÏÏÏÏÏÏÏÏÏÏÏÏÏÏÏÏÏÏÏÏÏÏÏÏÏÏÏÏÏÏÏÏÏÏÏÏÏÏÏÏÏÏÏÏÏÏÏ 527.0 466.0<br />
Retained Earnings ÏÏÏÏÏÏÏÏÏÏÏÏÏÏÏÏÏÏÏÏÏÏÏÏÏÏÏÏÏÏÏÏÏÏÏÏÏÏÏÏÏÏÏÏÏÏÏÏÏ 6,369.3 6,492.6<br />
Accumulated Other Comprehensive Income<br />
Unrealized Appreciation <strong>of</strong> Investments, Net <strong>of</strong> Tax ÏÏÏÏÏÏÏÏÏÏÏÏÏÏÏÏÏÏ 252.6 220.1<br />
Foreign Currency Translation Losses, Net <strong>of</strong> Tax ÏÏÏÏÏÏÏÏÏÏÏÏÏÏÏÏÏÏÏÏ (73.0) (68.5)<br />
Receivable from Employee Stock Ownership Plan ÏÏÏÏÏÏÏÏÏÏÏÏÏÏÏÏÏÏÏÏÏÏ (48.9) (62.5)<br />
Treasury Stock, at Cost Ì 10,059,857 and 3,914,105 SharesÏÏÏÏÏÏÏÏÏÏÏÏÏ (681.8) (244.8)<br />
TOTAL SHAREHOLDERS' EQUITYÏÏÏÏÏÏÏÏÏÏÏÏÏÏÏÏÏÏÏÏÏÏÏÏÏÏÏ 6,525.3 6,981.7<br />
TOTAL LIABILITIES AND SHAREHOLDERS' EQUITYÏÏÏÏÏÏÏÏÏ $29,449.0 $25,026.7<br />
See accompanying notes.<br />
49
THE CHUBB CORPORATION<br />
Consolidated Statements <strong>of</strong> Shareholders' Equity<br />
Preferred Stock<br />
In Millions<br />
Years Ended December 31<br />
<strong>2001</strong> 2000 1999<br />
Balance, Beginning and End <strong>of</strong> Year ÏÏÏÏÏÏÏÏÏÏÏÏÏÏÏÏÏÏÏÏÏÏ $ Ì $ Ì $ Ì<br />
Common Stock<br />
Balance, Beginning <strong>of</strong> Year ÏÏÏÏÏÏÏÏÏÏÏÏÏÏÏÏÏÏÏÏÏÏÏÏÏÏÏÏÏÏ 178.8 177.3 176.0<br />
Share Activity Related to Acquisition <strong>of</strong> Executive Risk ÏÏÏÏÏ Ì Ì .6<br />
Share Activity under Option and Incentive Plans ÏÏÏÏÏÏÏÏÏÏÏ 1.3 1.5 .7<br />
Paid-In Surplus<br />
Balance, End <strong>of</strong> Year ÏÏÏÏÏÏÏÏÏÏÏÏÏÏÏÏÏÏÏÏÏÏÏÏÏÏÏÏÏÏÏ 180.1 178.8 177.3<br />
Balance, Beginning <strong>of</strong> Year ÏÏÏÏÏÏÏÏÏÏÏÏÏÏÏÏÏÏÏÏÏÏÏÏÏÏÏÏÏÏ 466.0 418.4 546.7<br />
Share Activity Related to Acquisition <strong>of</strong> Executive Risk ÏÏÏÏÏ Ì Ì (126.3)<br />
Share Activity under Option and Incentive Plans ÏÏÏÏÏÏÏÏÏÏÏ 61.0 47.6 (2.0)<br />
Balance, End <strong>of</strong> Year ÏÏÏÏÏÏÏÏÏÏÏÏÏÏÏÏÏÏÏÏÏÏÏÏÏÏÏÏÏÏÏ 527.0 466.0 418.4<br />
Retained Earnings<br />
Balance, Beginning <strong>of</strong> Year ÏÏÏÏÏÏÏÏÏÏÏÏÏÏÏÏÏÏÏÏÏÏÏÏÏÏÏÏÏÏ 6,492.6 6,008.6 5,604.0<br />
Net Income ÏÏÏÏÏÏÏÏÏÏÏÏÏÏÏÏÏÏÏÏÏÏÏÏÏÏÏÏÏÏÏÏÏÏÏÏÏÏÏÏÏÏÏ 111.5 714.6 621.1<br />
Dividends Declared (per share $1.36, $1.32 and $1.28) ÏÏÏÏÏ (234.8) (230.6) (216.5)<br />
Balance, End <strong>of</strong> Year ÏÏÏÏÏÏÏÏÏÏÏÏÏÏÏÏÏÏÏÏÏÏÏÏÏÏÏÏÏÏÏ 6,369.3 6,492.6 6,008.6<br />
Unrealized Appreciation (Depreciation) <strong>of</strong> Investments<br />
Balance, Beginning <strong>of</strong> Year ÏÏÏÏÏÏÏÏÏÏÏÏÏÏÏÏÏÏÏÏÏÏÏÏÏÏÏÏÏÏ 220.1 (112.6) 414.7<br />
Change During Year, Net <strong>of</strong> TaxÏÏÏÏÏÏÏÏÏÏÏÏÏÏÏÏÏÏÏÏÏÏÏÏÏ 32.5 332.7 (527.3)<br />
Balance, End <strong>of</strong> Year ÏÏÏÏÏÏÏÏÏÏÏÏÏÏÏÏÏÏÏÏÏÏÏÏÏÏÏÏÏÏÏ 252.6 220.1 (112.6)<br />
Foreign Currency Translation Losses<br />
Balance, Beginning <strong>of</strong> Year ÏÏÏÏÏÏÏÏÏÏÏÏÏÏÏÏÏÏÏÏÏÏÏÏÏÏÏÏÏÏ (68.5) (44.8) (36.0)<br />
Change During Year, Net <strong>of</strong> TaxÏÏÏÏÏÏÏÏÏÏÏÏÏÏÏÏÏÏÏÏÏÏÏÏÏ (4.5) (23.7) (8.8)<br />
Balance, End <strong>of</strong> Year ÏÏÏÏÏÏÏÏÏÏÏÏÏÏÏÏÏÏÏÏÏÏÏÏÏÏÏÏÏÏÏ (73.0) (68.5) (44.8)<br />
Receivable from Employee Stock Ownership Plan<br />
Balance, Beginning <strong>of</strong> Year ÏÏÏÏÏÏÏÏÏÏÏÏÏÏÏÏÏÏÏÏÏÏÏÏÏÏÏÏÏÏ (62.5) (74.9) (86.3)<br />
Principal RepaymentsÏÏÏÏÏÏÏÏÏÏÏÏÏÏÏÏÏÏÏÏÏÏÏÏÏÏÏÏÏÏÏÏÏÏÏ 13.6 12.4 11.4<br />
Balance, End <strong>of</strong> Year ÏÏÏÏÏÏÏÏÏÏÏÏÏÏÏÏÏÏÏÏÏÏÏÏÏÏÏÏÏÏÏ (48.9) (62.5) (74.9)<br />
Treasury Stock, at Cost<br />
Balance, Beginning <strong>of</strong> Year ÏÏÏÏÏÏÏÏÏÏÏÏÏÏÏÏÏÏÏÏÏÏÏÏÏÏÏÏÏÏ (244.8) (100.2) (975.0)<br />
Repurchase <strong>of</strong> SharesÏÏÏÏÏÏÏÏÏÏÏÏÏÏÏÏÏÏÏÏÏÏÏÏÏÏÏÏÏÏÏÏÏÏÏ (555.6) (242.3) (145.0)<br />
Share Activity Related to Acquisition <strong>of</strong> Executive Risk ÏÏÏÏÏ Ì Ì 957.2<br />
Share Activity under Option and Incentive Plans ÏÏÏÏÏÏÏÏÏÏÏ 118.6 97.7 62.6<br />
Balance, End <strong>of</strong> Year ÏÏÏÏÏÏÏÏÏÏÏÏÏÏÏÏÏÏÏÏÏÏÏÏÏÏÏÏÏÏÏ (681.8) (244.8) (100.2)<br />
TOTAL SHAREHOLDERS' EQUITY ÏÏÏÏÏÏÏÏÏÏÏÏÏÏÏ $6,525.3 $6,981.7 $6,271.8<br />
See accompanying notes.<br />
50
THE CHUBB CORPORATION<br />
Consolidated Statements <strong>of</strong> Cash Flows<br />
In Millions<br />
Years Ended December 31<br />
<strong>2001</strong> 2000 1999<br />
Cash Flows from Operating Activities<br />
Net Income ÏÏÏÏÏÏÏÏÏÏÏÏÏÏÏÏÏÏÏÏÏÏÏÏÏÏÏÏÏÏÏÏÏÏÏÏÏÏÏÏÏ $ 111.5 $ 714.6 $ 621.1<br />
Adjustments to Reconcile Net Income to Net Cash<br />
Provided by Operating Activities<br />
Increase in Unpaid Claims and Claim Expenses, Net ÏÏÏÏ 958.4 302.5 93.1<br />
Increase in Unearned Premiums, Net ÏÏÏÏÏÏÏÏÏÏÏÏÏÏÏÏÏ 305.1 187.3 49.1<br />
Decrease (Increase) in Premiums ReceivableÏÏÏÏÏÏÏÏÏÏÏ (283.0) (175.1) 14.9<br />
Decrease in Funds Held for Asbestos-Related<br />
Settlement ÏÏÏÏÏÏÏÏÏÏÏÏÏÏÏÏÏÏÏÏÏÏÏÏÏÏÏÏÏÏÏÏÏÏÏÏÏ Ì Ì 607.4<br />
Decrease (Increase) in Deferred Policy Acquisition<br />
CostsÏÏÏÏÏÏÏÏÏÏÏÏÏÏÏÏÏÏÏÏÏÏÏÏÏÏÏÏÏÏÏÏÏÏÏÏÏÏÏÏÏÏ (86.8) (62.3) 4.2<br />
Deferred Income Tax (Credit) ÏÏÏÏÏÏÏÏÏÏÏÏÏÏÏÏÏÏÏÏÏÏ (189.9) (25.3) 5.3<br />
Depreciation ÏÏÏÏÏÏÏÏÏÏÏÏÏÏÏÏÏÏÏÏÏÏÏÏÏÏÏÏÏÏÏÏÏÏÏÏÏÏ 95.1 84.4 68.4<br />
Realized Investment Gains ÏÏÏÏÏÏÏÏÏÏÏÏÏÏÏÏÏÏÏÏÏÏÏÏÏÏ (.8) (51.5) (87.4)<br />
Other, NetÏÏÏÏÏÏÏÏÏÏÏÏÏÏÏÏÏÏÏÏÏÏÏÏÏÏÏÏÏÏÏÏÏÏÏÏÏÏÏÏ 101.1 (10.3) (37.2)<br />
NET CASH PROVIDED BY OPERATING<br />
ACTIVITIESÏÏÏÏÏÏÏÏÏÏÏÏÏÏÏÏÏÏÏÏÏÏÏÏÏÏÏÏÏÏÏÏÏÏ 1,010.7 964.3 1,338.9<br />
Cash Flows from Investing Activities<br />
Proceeds from Sales <strong>of</strong> Fixed Maturities Ì<br />
Available-for-Sale ÏÏÏÏÏÏÏÏÏÏÏÏÏÏÏÏÏÏÏÏÏÏÏÏÏÏÏÏÏÏÏÏÏÏÏ 4,581.5 2,180.8 1,427.5<br />
Proceeds from Maturities <strong>of</strong> Fixed MaturitiesÏÏÏÏÏÏÏÏÏÏÏÏÏ 1,246.2 741.6 860.3<br />
Proceeds from Sales <strong>of</strong> Equity SecuritiesÏÏÏÏÏÏÏÏÏÏÏÏÏÏÏÏÏ 458.1 453.5 1,030.6<br />
Proceeds from Sale <strong>of</strong> Interest in Associated Aviation<br />
Underwriters, Inc. ÏÏÏÏÏÏÏÏÏÏÏÏÏÏÏÏÏÏÏÏÏÏÏÏÏÏÏÏÏÏÏÏÏÏ Ì 55.0 Ì<br />
Purchases <strong>of</strong> Fixed Maturities ÏÏÏÏÏÏÏÏÏÏÏÏÏÏÏÏÏÏÏÏÏÏÏÏÏÏ (6,307.2) (3,463.3) (3,252.2)<br />
Purchases <strong>of</strong> Equity Securities ÏÏÏÏÏÏÏÏÏÏÏÏÏÏÏÏÏÏÏÏÏÏÏÏÏ (374.6) (579.4) (590.7)<br />
Purchase <strong>of</strong> Investments in Partially Owned <strong>Companies</strong> ÏÏÏ (276.5) Ì (145.3)<br />
Decrease (Increase) in Short Term Investments, Net ÏÏÏÏÏ (351.2) 125.5 (190.9)<br />
Purchases <strong>of</strong> Property and Equipment, Net ÏÏÏÏÏÏÏÏÏÏÏÏÏÏ (185.2) (138.7) (98.4)<br />
Other, NetÏÏÏÏÏÏÏÏÏÏÏÏÏÏÏÏÏÏÏÏÏÏÏÏÏÏÏÏÏÏÏÏÏÏÏÏÏÏÏÏÏÏ 44.0 1.5 1.6<br />
NET CASH USED IN INVESTING ACTIVITIES ÏÏÏÏ (1,164.9) (623.5) (957.5)<br />
Cash Flows from Financing Activities<br />
Increase in Short Term Debt, NetÏÏÏÏÏÏÏÏÏÏÏÏÏÏÏÏÏÏÏÏÏÏ 199.0 Ì Ì<br />
Proceeds from Issuance <strong>of</strong> Long Term Debt ÏÏÏÏÏÏÏÏÏÏÏÏÏ 600.0 Ì Ì<br />
Repayment <strong>of</strong> Long Term Debt ÏÏÏÏÏÏÏÏÏÏÏÏÏÏÏÏÏÏÏÏÏÏÏÏ (2.8) (5.4) (48.3)<br />
Proceeds from Issuance <strong>of</strong> Common Stock Under<br />
Incentive and Purchase Plans ÏÏÏÏÏÏÏÏÏÏÏÏÏÏÏÏÏÏÏÏÏÏÏÏÏ 146.8 119.3 22.7<br />
Repurchase <strong>of</strong> SharesÏÏÏÏÏÏÏÏÏÏÏÏÏÏÏÏÏÏÏÏÏÏÏÏÏÏÏÏÏÏÏÏÏ (555.6) (242.3) (145.0)<br />
Dividends Paid to Shareholders ÏÏÏÏÏÏÏÏÏÏÏÏÏÏÏÏÏÏÏÏÏÏÏÏ (234.8) (229.0) (210.6)<br />
Other, NetÏÏÏÏÏÏÏÏÏÏÏÏÏÏÏÏÏÏÏÏÏÏÏÏÏÏÏÏÏÏÏÏÏÏÏÏÏÏÏÏÏÏ 5.0 16.3 14.2<br />
NET CASH PROVIDED BY (USED IN)<br />
FINANCING ACTIVITIES ÏÏÏÏÏÏÏÏÏÏÏÏÏÏÏÏÏÏÏÏÏ 157.6 (341.1) (367.0)<br />
Net Increase (Decrease) in CashÏÏÏÏÏÏÏÏÏÏÏÏÏÏÏÏÏÏÏÏÏÏÏÏÏ 3.4 (.3) 14.4<br />
Cash at Beginning <strong>of</strong> Year ÏÏÏÏÏÏÏÏÏÏÏÏÏÏÏÏÏÏÏÏÏÏÏÏÏÏÏÏÏÏ 22.4 22.7 8.3<br />
CASH AT END OF YEAR ÏÏÏÏÏÏÏÏÏÏÏÏÏÏÏÏÏÏÏÏÏÏÏ $ 25.8 $ 22.4 $ 22.7<br />
Consolidated Statements <strong>of</strong> Comprehensive Income<br />
Net Income ÏÏÏÏÏÏÏÏÏÏÏÏÏÏÏÏÏÏÏÏÏÏÏÏÏÏÏÏÏÏÏÏÏÏÏÏÏÏÏÏÏÏÏ $ 111.5 $ 714.6 $ 621.1<br />
Other Comprehensive Income (Loss)<br />
Change in Unrealized Appreciation or Depreciation <strong>of</strong><br />
Investments, Net <strong>of</strong> Tax ÏÏÏÏÏÏÏÏÏÏÏÏÏÏÏÏÏÏÏÏÏÏÏÏÏÏÏÏ 32.5 332.7 (527.3)<br />
Foreign Currency Translation Losses, Net <strong>of</strong> TaxÏÏÏÏÏÏÏÏÏ (4.5) (23.7) (8.8)<br />
28.0 309.0 (536.1)<br />
COMPREHENSIVE INCOME ÏÏÏÏÏÏÏÏÏÏÏÏÏÏÏÏÏÏÏÏ $ 139.5 $ 1,023.6 $ 85.0<br />
See accompanying notes.<br />
51
NOTES TO CONSOLIDATED FINANCIAL STATEMENTS<br />
(1) Summary <strong>of</strong> SigniÑcant Accounting Policies Those Ñxed maturities that the Corporation and its<br />
(a) Basis <strong>of</strong> Presentation<br />
insurance subsidiaries have the ability and positive intent<br />
to hold to maturity are classiÑed as held-to-maturity and<br />
The accompanying consolidated Ñnancial statements<br />
carried at amortized cost.<br />
have been prepared in accordance with generally ac-<br />
Premiums and discounts arising from the purchase <strong>of</strong><br />
cepted accounting principles and include the accounts <strong>of</strong><br />
mortgage-backed securities are amortized using the inter-<br />
The <strong>Chubb</strong> Corporation (Corporation) and its subsidiest<br />
method over the estimated remaining term <strong>of</strong> the<br />
aries. SigniÑcant intercompany transactions have been<br />
securities, adjusted for anticipated prepayments.<br />
eliminated in consolidation.<br />
The consolidated Ñnancial statements include amounts<br />
based on informed estimates and judgments <strong>of</strong> management<br />
for those transactions that are not yet complete or<br />
for which the ultimate eÅects cannot be precisely deter-<br />
mined. Such estimates and judgments aÅect the reported<br />
amounts <strong>of</strong> assets and liabilities and disclosure <strong>of</strong> contin-<br />
gent assets and liabilities at the date <strong>of</strong> the Ñnancial<br />
statements and the reported amounts <strong>of</strong> revenues and<br />
expenses during the reporting period. Actual results<br />
could diÅer from those estimates.<br />
Certain amounts in the consolidated Ñnancial state-<br />
ments for prior years have been reclassiÑed to conform<br />
with the <strong>2001</strong> presentation.<br />
(b) Invested Assets<br />
Short term investments, which have an original maturity<br />
<strong>of</strong> one year or less, are carried at amortized cost.<br />
Investments in partially owned companies include the<br />
Corporation's minority ownership interest in entities<br />
where its ownership interest is greater than 20% but less<br />
than 50% and in corporate joint ventures. At Decem-<br />
ber 31, <strong>2001</strong>, investments in partially owned companies<br />
included the Corporation's 28% interest in Hiscox plc<br />
and 19% interest in Allied World Assurance Holdings,<br />
Ltd. The equity method <strong>of</strong> accounting is used for invest-<br />
ments in partially owned companies.<br />
Fixed maturities, which include bonds and redeemable<br />
preferred stocks, are purchased to support the investment<br />
strategies <strong>of</strong> the Corporation and its insurance<br />
subsidiaries. These strategies are developed based on<br />
many factors including rate <strong>of</strong> return, maturity, credit<br />
risk, tax considerations and regulatory requirements.<br />
Fixed maturities which may be sold prior to maturity to<br />
support the investment strategies <strong>of</strong> the Corporation and<br />
its insurance subsidiaries are classiÑed as available-for-sale<br />
and carried at market value as <strong>of</strong> the balance sheet date.<br />
Equity securities include common stocks, non-redeemable<br />
preferred stocks and alternative investments, primarily<br />
investment partnerships. Common and non-<br />
redeemable preferred stocks are carried at market value<br />
as <strong>of</strong> the balance sheet date. Investment partnerships are<br />
carried at the equity in the estimated market value <strong>of</strong> the<br />
investments held by the partnerships.<br />
The Corporation is a holding company with subsidiar-<br />
ies principally engaged in the property and casualty<br />
insurance business. The property and casualty insurance<br />
subsidiaries underwrite most lines <strong>of</strong> property and casu-<br />
alty insurance in the United States, Canada, Europe,<br />
Australia and parts <strong>of</strong> Latin America and the Far East.<br />
The geographic distribution <strong>of</strong> property and casualty<br />
business in the United States is broad with a particularly<br />
strong market presence in the Northeast. <strong>Chubb</strong> Finan-<br />
cial Solutions (CFSI) was organized by the Corporation<br />
in 2000 to engage in developing and providing risk-<br />
Ñnancing services through the capital and insurance markets.<br />
Since its inception, CFSI's non-insurance operations<br />
have been primarily in the credit derivatives<br />
business, principally as a counterparty to credit default<br />
swaps. <strong>Insurance</strong> and reinsurance solutions developed by<br />
CFSI are written by the Corporation's property and<br />
casualty insurance subsidiaries.<br />
Unrealized appreciation or depreciation <strong>of</strong> investments<br />
carried at market value is excluded from net income and<br />
credited or charged, net <strong>of</strong> applicable deferred income<br />
tax, directly to a separate component <strong>of</strong> comprehensive<br />
income.<br />
Realized gains and losses on the sale <strong>of</strong> investments are<br />
determined on the basis <strong>of</strong> the cost <strong>of</strong> the speciÑc<br />
investments sold and are credited or charged to net<br />
income. When the market value <strong>of</strong> any investment is<br />
lower than its cost and such decline is determined to be<br />
other than temporary, the cost <strong>of</strong> the investment is<br />
written down to market value and the amount <strong>of</strong> the<br />
writedown is charged to net income as a realized investment<br />
loss.<br />
The Corporation engages in securities lending<br />
whereby certain securities from its portfolio are loaned to<br />
other institutions for short periods <strong>of</strong> time. Cash collateral<br />
from the borrower, equal to the market value <strong>of</strong> the<br />
loaned securities plus accrued interest, is deposited with<br />
a lending agent and retained and invested by the lending<br />
agent in accordance with the Corporation's guidelines to<br />
generate additional income for the Corporation. The<br />
Corporation maintains full ownership rights to the secu-<br />
rities loaned and, accordingly, such securities are included<br />
in invested assets. The securities lending collateral<br />
is recognized as an asset with a corresponding liability for<br />
the obligation to return the collateral.<br />
(c) Investments in Partially Owned <strong>Companies</strong><br />
52
(d) Premium Revenues and Related Expenses<br />
Premiums are earned on a monthly pro rata basis over<br />
the terms <strong>of</strong> the policies and include estimates <strong>of</strong> audit<br />
premiums and premiums on retrospectively rated policies.<br />
Unearned premiums represent the portion <strong>of</strong> premiums<br />
written applicable to the unexpired terms <strong>of</strong><br />
policies in force.<br />
Ceded premiums are charged to income over the terms<br />
<strong>of</strong> the reinsurance contracts. Prepaid reinsurance premiums<br />
represent the portion <strong>of</strong> insurance premiums ceded<br />
to reinsurers applicable to the unexpired terms <strong>of</strong> the<br />
reinsurance contracts in force.<br />
Acquisition costs that vary with and are primarily<br />
related to the production <strong>of</strong> business are deferred by<br />
major product groups and amortized over the period in<br />
which the related premiums are earned. Such costs<br />
include commissions, premium taxes and certain other<br />
underwriting and policy issuance costs. Commissions<br />
received related to reinsurance premiums ceded are considered<br />
in determining net acquisition costs eligible for<br />
deferral. Deferred policy acquisition costs are reviewed to<br />
determine that they do not exceed recoverable amounts,<br />
after considering anticipated investment income.<br />
(e) Unpaid Claims and Claim Expenses<br />
Liabilities for unpaid claims and claim expenses include<br />
the accumulation <strong>of</strong> individual case estimates for claims<br />
reported as well as estimates <strong>of</strong> incurred but not reported<br />
claims and estimates <strong>of</strong> claim settlement expenses, less<br />
estimates <strong>of</strong> anticipated salvage and subrogation<br />
recoveries.<br />
Reinsurance recoverable on unpaid claims and claim<br />
expenses represent estimates <strong>of</strong> the portion <strong>of</strong> such<br />
liabilities that will be recovered from reinsurers.<br />
Amounts recoverable from reinsurers are recognized as<br />
assets at the same time and in a manner consistent with<br />
the unpaid claims liabilities associated with the reinsured<br />
policies.<br />
Goodwill, which represents the excess <strong>of</strong> the purchase<br />
price over the fair value <strong>of</strong> net assets <strong>of</strong> subsidiaries<br />
acquired, is being amortized using the straight-line<br />
method over 26 years. The carrying value <strong>of</strong> goodwill is<br />
periodically reviewed for impairment. If it became proba-<br />
ble that projected future undiscounted cash Öows were<br />
not suÇcient to recover the carrying value <strong>of</strong> the good-<br />
will, an impairment loss would be recognized, resulting in<br />
a writedown <strong>of</strong> the carrying value <strong>of</strong> the goodwill. EÅective<br />
January 1, 2002, the accounting for goodwill will<br />
change (see Note (1)(n)).<br />
Estimates are based upon past claim experience modi-<br />
Ñed for current trends as well as prevailing economic,<br />
legal and social conditions. Such estimates are continually<br />
reviewed and updated. Any changes in estimates are<br />
reÖected in operating results in the period in which the<br />
estimates are changed.<br />
(f) Credit Derivatives<br />
Credit derivatives, principally credit default swaps, are<br />
carried at estimated fair value as <strong>of</strong> the balance sheet date.<br />
Changes in fair value are credited or charged to net<br />
income.<br />
(g) Real Estate<br />
Real estate properties are carried at cost, net <strong>of</strong> writedowns<br />
for impairment. Real estate taxes, interest and<br />
other carrying costs incurred prior to completion <strong>of</strong> the<br />
assets for their intended use are capitalized. Also, costs<br />
incurred during the initial leasing <strong>of</strong> income producing<br />
properties are capitalized until the project is substantially<br />
complete, subject to a maximum time period subsequent<br />
to completion <strong>of</strong> major construction activity.<br />
Real estate properties are reviewed for impairment<br />
whenever events or circumstances indicate that the carrying<br />
value <strong>of</strong> such properties may not be recoverable. In<br />
performing the review for recoverability <strong>of</strong> carrying<br />
value, estimates are made <strong>of</strong> the future undiscounted<br />
cash Öows from each <strong>of</strong> the properties during the period<br />
the property will be held and upon its eventual disposition.<br />
If the expected future undiscounted cash Öows are<br />
less than the carrying value <strong>of</strong> any property, an impair-<br />
ment loss is recognized, resulting in a writedown <strong>of</strong> the<br />
carrying value <strong>of</strong> the property. Measurement <strong>of</strong> such<br />
impairment is based on the fair value <strong>of</strong> the property.<br />
Real estate mortgages and notes receivable are carried<br />
at unpaid principal balances less an allowance for uncol-<br />
lectible amounts. A loan is considered impaired when it<br />
is probable that all principal and interest amounts will<br />
not be collected according to the contractual terms <strong>of</strong> the<br />
loan agreement. An allowance for uncollectible amounts<br />
is established to recognize any such impairment. Measurement<br />
<strong>of</strong> impairment is based on the discounted<br />
expected future cash Öows <strong>of</strong> the loan, subject to the<br />
estimated fair value <strong>of</strong> the underlying collateral. These<br />
cash Öows are discounted at the loan's eÅective interest<br />
rate.<br />
Rental revenues are recognized on a straight-line basis<br />
over the term <strong>of</strong> the lease. ProÑts on land, townhome<br />
unit and commercial building sales are recognized at<br />
closing, subject to compliance with applicable accounting<br />
guidelines.<br />
(h) Goodwill<br />
(i) Property and Equipment<br />
Property and equipment used in operations, including<br />
certain costs incurred to develop or obtain computer<br />
s<strong>of</strong>tware for internal use, are capitalized and carried at<br />
cost less accumulated depreciation. Depreciation is calculated<br />
using the straight-line method over the estimated<br />
useful lives <strong>of</strong> the assets.<br />
53
(j) Stock-Based Compensation<br />
The intrinsic value method <strong>of</strong> accounting is used for<br />
stock-based compensation plans. Under the intrinsic<br />
value method, compensation cost is measured as the<br />
excess, if any, <strong>of</strong> the quoted market price <strong>of</strong> the stock at<br />
the measurement date over the amount an employee<br />
must pay to acquire the stock.<br />
(k) Income Taxes<br />
The Corporation and its domestic subsidiaries Ñle a<br />
consolidated federal income tax return.<br />
Deferred income tax assets and liabilities are recognized<br />
for the expected future tax eÅects attributable to<br />
temporary diÅerences between the Ñnancial reporting<br />
and tax bases <strong>of</strong> assets and liabilities, based on enacted tax<br />
rates and other provisions <strong>of</strong> tax law. The eÅect <strong>of</strong> a<br />
change in tax laws or rates is recognized in net income in<br />
the period in which such change is enacted.<br />
U.S. federal income taxes are accrued on undistributed<br />
earnings <strong>of</strong> foreign subsidiaries.<br />
(l) Foreign Exchange<br />
Assets and liabilities relating to foreign operations are<br />
translated into U.S. dollars using current exchange rates;<br />
revenues and expenses are translated into U.S. dollars<br />
using the average exchange rates for each year.<br />
The functional currency <strong>of</strong> foreign operations is gener-<br />
ally the currency <strong>of</strong> the local operating environment<br />
since their business is primarily transacted in such local<br />
currency. Translation gains and losses, net <strong>of</strong> applicable<br />
income tax, are excluded from net income and are<br />
credited or charged directly to a separate component <strong>of</strong><br />
comprehensive income.<br />
(m) Cash Flow Information<br />
In the statement <strong>of</strong> cash Öows, short term investments<br />
are not considered to be cash equivalents. The eÅect <strong>of</strong><br />
changes in foreign exchange rates on cash balances was<br />
immaterial.<br />
In 1999, the Corporation acquired all <strong>of</strong> the outstanding<br />
common shares <strong>of</strong> Executive Risk Inc. in exchange<br />
for common stock <strong>of</strong> the Corporation (see<br />
Note (3)(a)). The details <strong>of</strong> the acquisition were as<br />
follows: fair value <strong>of</strong> assets acquired, including goodwill,<br />
$2,459 million; fair value <strong>of</strong> liabilities assumed, $1,627<br />
million; and fair value <strong>of</strong> common stock issued and<br />
options assumed, $832 million. This noncash transaction<br />
has been excluded from the consolidated statements <strong>of</strong><br />
cash Öows.<br />
(n) Accounting Pronouncements Not Yet Adopted<br />
In June <strong>2001</strong>, the Financial Accounting Standards<br />
Board issued Statement <strong>of</strong> Financial Accounting Stan-<br />
dards (SFAS) No. 142, Goodwill and Other Intangible<br />
Assets. The Statement addresses how intangible assets<br />
should be accounted for upon their acquisition and how<br />
goodwill and other intangible assets should be accounted<br />
for after they have been initially recognized in the Ñnan-<br />
cial statements. Under SFAS No. 142, goodwill will no<br />
longer be amortized but rather will be tested at least<br />
annually for impairment. The provisions <strong>of</strong><br />
SFAS No. 142 are eÅective for the Corporation for the<br />
year beginning January 1, 2002. The Statement shall be<br />
applied to goodwill recognized in the Corporation's Ñ-<br />
nancial statements at that date. SFAS No. 142 may not<br />
be applied retroactively to Ñnancial statements <strong>of</strong> prior<br />
periods. The elimination <strong>of</strong> goodwill amortization is<br />
expected to result in an increase in net income in 2002 <strong>of</strong><br />
approximately $20 million. The Corporation is in the<br />
process <strong>of</strong> assessing the eÅect, if any, that the implemen-<br />
tation <strong>of</strong> the other provisions <strong>of</strong> SFAS No. 142 will have<br />
on its Ñnancial position or results <strong>of</strong> operations.<br />
(2) Adoption <strong>of</strong> New Accounting Pronouncements<br />
EÅective January 1, <strong>2001</strong>, the Corporation adopted<br />
SFAS No. 133, Accounting for Derivative Instruments<br />
and Hedging Activities, and SFAS No. 138, Accounting<br />
for Certain Derivative Instruments and Certain Hedging<br />
Activities. SFAS No. 133 establishes accounting and<br />
reporting standards for derivative instruments and hedg-<br />
ing activities and SFAS No. 138 provides additional<br />
guidance related to accounting and reporting for certain<br />
derivative instruments and hedging activities.<br />
SFAS No. 133 requires that all derivatives be recognized<br />
in the balance sheet as assets or liabilities and be mea-<br />
sured at fair value. Changes in the fair value <strong>of</strong> a<br />
derivative are reported in net income or other compre-<br />
hensive income, depending on the intended use <strong>of</strong> the<br />
derivative and whether it qualiÑes for hedge accounting.<br />
The Statements may not be applied retroactively to<br />
Ñnancial statements <strong>of</strong> prior periods. The Corporation's<br />
use <strong>of</strong> derivatives has not been signiÑcant. Thus, the<br />
adoption <strong>of</strong> SFAS No. 133 and SFAS No. 138 did not<br />
have a signiÑcant eÅect on the Corporation's Ñnancial<br />
position or results <strong>of</strong> operations.<br />
EÅective April 1, <strong>2001</strong>, the Corporation adopted the<br />
Emerging Issues Task Force (EITF) consensus on Issue<br />
No. 99-20, Recognition <strong>of</strong> Interest Income and Impair-<br />
ment on Purchased and Retained BeneÑcial Interests in<br />
Securitized Financial Assets. EITF Issue No. 99-20<br />
requires that investors in certain asset-backed securities<br />
recognize changes in a security's estimated yield prospec-<br />
tively. EITF Issue No. 99-20 also requires that if the<br />
carrying value <strong>of</strong> any such asset-backed security exceeds<br />
its current fair value, a determination should be made as<br />
to whether the excess represents an other than temporary<br />
decline in value and any such decline should be<br />
recognized as a loss in the income statement. The adoption<br />
<strong>of</strong> EITF Issue No. 99-20 did not have a signiÑcant<br />
eÅect on the Corporation's Ñnancial position or results <strong>of</strong><br />
operations.<br />
54
(3) Acquisitions and Dispositions<br />
(4) SigniÑcant Losses<br />
(a) In July 1999, the Corporation completed its acquilion<br />
were incurred related to the September 11 attack in<br />
(a) In the third quarter <strong>of</strong> <strong>2001</strong>, net costs <strong>of</strong> $645 milsition<br />
<strong>of</strong> Executive Risk Inc., a specialty insurance comthe<br />
United States. The net costs consisted <strong>of</strong> estimated<br />
pany oÅering directors and oÇcers, errors and omissions<br />
and pr<strong>of</strong>essional liability coverages.<br />
net claims and claim expenses <strong>of</strong> $665 million less net<br />
reinsurance reinstatement premium revenue <strong>of</strong> $30 million<br />
plus a $10 million charge for the Corporation's<br />
Executive Risk shareholders received 1.235 shares <strong>of</strong><br />
the Corporation's common stock for each outstanding share <strong>of</strong> the losses publicly estimated by Hiscox.<br />
common share <strong>of</strong> Executive Risk. In addition, outstand-<br />
Gross claims and claim expenses <strong>of</strong> the property and<br />
ing Executive Risk stock options were assumed and<br />
casualty insurance subsidiaries from the September 11<br />
adjusted as options to purchase common stock <strong>of</strong> the<br />
attack are estimated at about $3 billion. Most <strong>of</strong> the<br />
Corporation. Approximately 14.3 million shares <strong>of</strong> comclaims<br />
were from property exposure and business intermon<br />
stock <strong>of</strong> the Corporation were issued to Executive<br />
ruption losses. There were also signiÑcant workers' com-<br />
Risk shareholders and an additional 1.8 million shares <strong>of</strong><br />
pensation losses. The net claims and claim expenses <strong>of</strong><br />
common stock <strong>of</strong> the Corporation were reserved for<br />
$665 million were signiÑcantly lower than the gross<br />
issuance upon exercise <strong>of</strong> the assumed Executive Risk<br />
amount due to various reinsurance agreements. The<br />
stock options.<br />
property exposures were protected by facultative reinsurance,<br />
a property per risk treaty that limited the net loss<br />
The acquisition has been accounted for using the<br />
purchase method <strong>of</strong> accounting. Therefore, the results <strong>of</strong><br />
per risk, and a property catastrophe treaty. Workers'<br />
operations <strong>of</strong> Executive Risk are included in the Corpotrophe<br />
treaty and a casualty clash treaty.<br />
compensation losses were protected by a casualty catas-<br />
ration's consolidated results <strong>of</strong> operations from the date<br />
<strong>of</strong> acquisition. The assets and liabilities <strong>of</strong> Executive Risk While it is possible that the estimated ultimate net<br />
were recorded at their estimated fair values at the date <strong>of</strong> losses related to the September 11 attack may change in<br />
acquisition. The value <strong>of</strong> the stock options assumed by the future, management does not expect that any such<br />
the Corporation was included in the purchase price. The change would have a material eÅect on the Corporation's<br />
total purchase price was approximately $832 million. The Ñnancial condition.<br />
excess <strong>of</strong> the purchase price over the estimated fair value<br />
<strong>of</strong> the net assets acquired, amounting to approximately (b) In the fourth quarter <strong>of</strong> <strong>2001</strong>, surety bond losses<br />
$517 million, has been recorded as goodwill and is being <strong>of</strong> $220 million, net <strong>of</strong> reinsurance, were recognized<br />
amortized using an expected useful life <strong>of</strong> 26 years. related to the bankruptcy <strong>of</strong> Enron Corp. The surety<br />
Beginning in 2002, the remaining goodwill will no longer losses represent the maximum exposure <strong>of</strong> the property<br />
be amortized (see Note (1)(n)).<br />
and casualty insurance subsidiaries relating to bonds<br />
issued to various obligees in connection with Enron<br />
Pro forma results <strong>of</strong> operations showing the eÅects on commitments. However, certain <strong>of</strong> these bonds are the<br />
the Corporation's operations prior to the date <strong>of</strong> acquisi- subject <strong>of</strong> litigation. Management believes there are reation<br />
have not been presented due to immateriality. sonable grounds for challenging the validity <strong>of</strong> the obligations<br />
under the bonds that are the subject <strong>of</strong> the<br />
(b) In March 1999, the Corporation purchased a 28% litigation and intends to pursue the litigation vigorously.<br />
interest in Hiscox plc, a U.K. personal and commercial If the Corporation is successful in the litigation, any<br />
specialty insurer, for approximately $145 million.<br />
favorable development would be reÖected in future operating<br />
results.<br />
(c) In November <strong>2001</strong>, the Corporation acquired a<br />
19% interest in Allied World Assurance Holdings, Ltd, a<br />
newly formed Bermuda-based company, for approximately<br />
$250 million. Allied World Assurance was established<br />
to underwrite insurance and reinsurance business<br />
worldwide.<br />
(d) In September 2000, the Corporation sold its 50%<br />
interest in Associated Aviation Underwriters, Inc.<br />
(AAU). The consideration from the sale was $65 million,<br />
consisting <strong>of</strong> a base purchase price <strong>of</strong> $55 million<br />
and a non-compete payment <strong>of</strong> $10 million.<br />
55
(5) Invested Assets and Related Income<br />
(a) The amortized cost and estimated market value <strong>of</strong> Ñxed maturities were as follows:<br />
December 31<br />
<strong>2001</strong> 2000<br />
Gross Gross Estimated Gross Gross Estimated<br />
Amortized Unrealized Unrealized Market Amortized Unrealized Unrealized Market<br />
Cost Appreciation Depreciation Value Cost Appreciation Depreciation Value<br />
(in millions)<br />
Held-to-maturity Ì Tax exempt ÏÏÏÏÏÏÏ $ 1,218.5 $ 64.0 $ Ì $ 1,282.5 $ 1,496.1 $ 68.6 $ Ì $ 1,564.7<br />
Available-for-sale<br />
Tax exempt ÏÏÏÏÏÏÏÏÏÏÏÏÏÏÏÏÏÏÏÏÏÏÏ 8,053.8 334.0 14.9 8,372.9 8,053.8 337.5 10.8 8,380.5<br />
Taxable<br />
U.S. Government and government<br />
agency and authority obligations ÏÏÏ 660.0 24.9 Ì 684.9 613.3 14.9 .3 627.9<br />
Corporate bonds ÏÏÏÏÏÏÏÏÏÏÏÏÏÏÏÏ 2,009.4 57.5 28.7 2,038.2 1,564.7 14.3 23.9 1,555.1<br />
Foreign bondsÏÏÏÏÏÏÏÏÏÏÏÏÏÏÏÏÏÏÏ 1,581.9 44.3 .6 1,625.6 1,267.1 32.3 5.1 1,294.3<br />
Mortgage-backed securities ÏÏÏÏÏÏÏÏ 2,111.8 35.6 17.0 2,130.4 2,113.6 19.2 29.3 2,103.5<br />
Redeemable preferred stocks ÏÏÏÏÏÏ 45.1 1.1 Ì 46.2 107.9 Ì .9 107.0<br />
6,408.2 163.4 46.3 6,525.3 5,666.6 80.7 59.5 5,687.8<br />
Total available-for-sale ÏÏÏÏÏÏÏÏÏÏ 14,462.0 497.4 61.2 14,898.2 13,720.4 418.2 70.3 14,068.3<br />
Total Ñxed maturitiesÏÏÏÏÏÏÏÏÏÏÏ $15,680.5 $561.4 $61.2 $16,180.7 $15,216.5 $486.8 $70.3 $15,633.0<br />
The amortized cost and estimated market value <strong>of</strong> Ñxed maturities at December 31, <strong>2001</strong> by contractual maturity were<br />
as follows:<br />
Estimated<br />
Amortized<br />
Cost<br />
Market<br />
Value<br />
(in millions)<br />
Held-to-maturity<br />
Due in one year or less ÏÏÏÏÏÏÏÏÏÏÏÏÏÏÏÏÏÏÏÏÏÏÏÏÏÏÏÏÏÏÏÏÏÏÏÏÏÏÏÏÏÏÏÏÏÏÏÏÏÏÏÏÏÏÏÏÏÏÏÏÏÏÏÏÏÏÏÏÏÏÏÏÏÏ $ 65.0 $ 66.3<br />
Due after one year through Ñve yearsÏÏÏÏÏÏÏÏÏÏÏÏÏÏÏÏÏÏÏÏÏÏÏÏÏÏÏÏÏÏÏÏÏÏÏÏÏÏÏÏÏÏÏÏÏÏÏÏÏÏÏÏÏÏÏÏÏÏÏÏÏÏÏ 600.9 629.3<br />
Due after Ñve years through ten years ÏÏÏÏÏÏÏÏÏÏÏÏÏÏÏÏÏÏÏÏÏÏÏÏÏÏÏÏÏÏÏÏÏÏÏÏÏÏÏÏÏÏÏÏÏÏÏÏÏÏÏÏÏÏÏÏÏÏÏÏÏÏ 364.4 384.6<br />
Due after ten years ÏÏÏÏÏÏÏÏÏÏÏÏÏÏÏÏÏÏÏÏÏÏÏÏÏÏÏÏÏÏÏÏÏÏÏÏÏÏÏÏÏÏÏÏÏÏÏÏÏÏÏÏÏÏÏÏÏÏÏÏÏÏÏÏÏÏÏÏÏÏÏÏÏÏÏÏÏÏ 188.2 202.3<br />
$ 1,218.5 $ 1,282.5<br />
Available-for-sale<br />
Due in one year or less ÏÏÏÏÏÏÏÏÏÏÏÏÏÏÏÏÏÏÏÏÏÏÏÏÏÏÏÏÏÏÏÏÏÏÏÏÏÏÏÏÏÏÏÏÏÏÏÏÏÏÏÏÏÏÏÏÏÏÏÏÏÏÏÏÏÏÏÏÏÏÏÏÏÏ $ 320.0 $ 326.9<br />
Due after one year through Ñve yearsÏÏÏÏÏÏÏÏÏÏÏÏÏÏÏÏÏÏÏÏÏÏÏÏÏÏÏÏÏÏÏÏÏÏÏÏÏÏÏÏÏÏÏÏÏÏÏÏÏÏÏÏÏÏÏÏÏÏÏÏÏÏÏ 2,772.5 2,892.1<br />
Due after Ñve years through ten years ÏÏÏÏÏÏÏÏÏÏÏÏÏÏÏÏÏÏÏÏÏÏÏÏÏÏÏÏÏÏÏÏÏÏÏÏÏÏÏÏÏÏÏÏÏÏÏÏÏÏÏÏÏÏÏÏÏÏÏÏÏÏ 5,056.2 5,245.5<br />
Due after ten years ÏÏÏÏÏÏÏÏÏÏÏÏÏÏÏÏÏÏÏÏÏÏÏÏÏÏÏÏÏÏÏÏÏÏÏÏÏÏÏÏÏÏÏÏÏÏÏÏÏÏÏÏÏÏÏÏÏÏÏÏÏÏÏÏÏÏÏÏÏÏÏÏÏÏÏÏÏÏ 4,201.5 4,303.3<br />
12,350.2 12,767.8<br />
Mortgage-backed securitiesÏÏÏÏÏÏÏÏÏÏÏÏÏÏÏÏÏÏÏÏÏÏÏÏÏÏÏÏÏÏÏÏÏÏÏÏÏÏÏÏÏÏÏÏÏÏÏÏÏÏÏÏÏÏÏÏÏÏÏÏÏÏÏÏÏÏÏÏÏÏÏÏ 2,111.8 2,130.4<br />
$14,462.0 $14,898.2<br />
Actual maturities could diÅer from contractual maturities because borrowers may have the right to call or prepay<br />
obligations.<br />
(b) The components <strong>of</strong> unrealized appreciation or depreciation <strong>of</strong> investments carried at market value were as<br />
follows:<br />
December 31<br />
<strong>2001</strong> 2000<br />
(in millions)<br />
Equity securities<br />
Gross unrealized appreciation ÏÏÏÏÏÏÏÏÏÏÏÏÏÏÏÏÏÏÏÏÏÏÏÏÏÏÏÏÏÏÏÏÏÏÏÏÏÏÏÏÏÏÏÏÏÏÏÏÏÏÏÏÏÏÏÏÏÏÏÏÏÏÏÏÏÏÏÏÏÏÏÏÏÏÏÏÏ $ 20.7 $ 51.9<br />
Gross unrealized depreciationÏÏÏÏÏÏÏÏÏÏÏÏÏÏÏÏÏÏÏÏÏÏÏÏÏÏÏÏÏÏÏÏÏÏÏÏÏÏÏÏÏÏÏÏÏÏÏÏÏÏÏÏÏÏÏÏÏÏÏÏÏÏÏÏÏÏÏÏÏÏÏÏÏÏÏÏÏ 68.2 61.1<br />
(47.5) (9.2)<br />
Fixed maturities<br />
Gross unrealized appreciation ÏÏÏÏÏÏÏÏÏÏÏÏÏÏÏÏÏÏÏÏÏÏÏÏÏÏÏÏÏÏÏÏÏÏÏÏÏÏÏÏÏÏÏÏÏÏÏÏÏÏÏÏÏÏÏÏÏÏÏÏÏÏÏÏÏÏÏÏÏÏÏÏÏÏÏÏÏ 497.4 418.2<br />
Gross unrealized depreciationÏÏÏÏÏÏÏÏÏÏÏÏÏÏÏÏÏÏÏÏÏÏÏÏÏÏÏÏÏÏÏÏÏÏÏÏÏÏÏÏÏÏÏÏÏÏÏÏÏÏÏÏÏÏÏÏÏÏÏÏÏÏÏÏÏÏÏÏÏÏÏÏÏÏÏÏÏ 61.2 70.3<br />
436.2 347.9<br />
388.7 338.7<br />
Deferred income tax liabilityÏÏÏÏÏÏÏÏÏÏÏÏÏÏÏÏÏÏÏÏÏÏÏÏÏÏÏÏÏÏÏÏÏÏÏÏÏÏÏÏÏÏÏÏÏÏÏÏÏÏÏÏÏÏÏÏÏÏÏÏÏÏÏÏÏÏÏÏÏÏÏÏÏÏÏÏÏÏÏÏ 136.1 118.6<br />
$252.6 $220.1<br />
56
The change in unrealized appreciation or depreciation (6) Deferred Policy Acquisition Costs<br />
<strong>of</strong> investments carried at market value was as follows:<br />
Years Ended December 31 Policy acquisition costs deferred and the related amor-<br />
<strong>2001</strong> 2000 1999 tization charged against income were as follows:<br />
(in millions)<br />
Years Ended December 31<br />
Change in unrealized appreciation or<br />
depreciation <strong>of</strong> equity securities ÏÏÏÏ $(38.3) $ (63.4) $ (35.4)<br />
<strong>2001</strong> 2000 1999<br />
Change in unrealized appreciation or<br />
(in millions)<br />
depreciation <strong>of</strong> Ñxed maturitiesÏÏÏÏÏ 88.3 514.7 (715.2) Balance, beginning <strong>of</strong> year ÏÏÏÏÏÏÏ $ 842.0 $ 779.7 $ 728.7<br />
50.0 451.3 (750.6) Increase related to acquisition <strong>of</strong><br />
Deferred income tax (credit) ÏÏÏÏÏÏÏÏ 17.5 158.0 (262.7) Executive Risk ÏÏÏÏÏÏÏÏÏÏÏÏÏÏÏ Ì Ì 55.2<br />
Increase (decrease) in valuation<br />
Costs deferred during year<br />
allowance ÏÏÏÏÏÏÏÏÏÏÏÏÏÏÏÏÏÏÏÏÏÏÏ Ì (39.4) 39.4 Commissions and brokerage ÏÏÏ 950.9 869.0 784.4<br />
$ 32.5 $ 332.7 $(527.3) Premium taxes and assessments ÏÏ<br />
Salaries and operating costs ÏÏÏÏÏ<br />
163.8<br />
743.5<br />
138.3<br />
700.4<br />
132.8<br />
608.3<br />
1,858.2 1,707.7 1,525.5<br />
The unrealized appreciation <strong>of</strong> Ñxed maturities carried Amortization during year ÏÏÏÏÏÏÏÏ (1,771.4) (1,645.4) (1,529.7)<br />
at amortized cost is not reÖected in the Ñnancial state- Balance, end <strong>of</strong> year ÏÏÏÏÏÏÏÏÏÏÏÏ $ 928.8 $ 842.0 $ 779.7<br />
ments. The change in unrealized appreciation <strong>of</strong> Ñxed<br />
maturities carried at amortized cost was a decrease <strong>of</strong><br />
$4.6 million, an increase <strong>of</strong> $9.5 million and a decrease <strong>of</strong><br />
$78.9 million for the years ended December 31, <strong>2001</strong>,<br />
(7) Real Estate<br />
2000 and 1999, respectively. The components <strong>of</strong> real estate assets were as follows:<br />
(c) The sources <strong>of</strong> net investment income were as<br />
December 31<br />
follows: <strong>2001</strong> 2000<br />
Years Ended December 31<br />
(in millions)<br />
<strong>2001</strong> 2000 1999<br />
Mortgages and notes receivable (net <strong>of</strong> allowance for<br />
(in millions)<br />
uncollectible amounts <strong>of</strong> $.7 and $2.1)ÏÏÏÏÏÏÏÏÏÏÏÏÏÏ $ 97.7 $ 89.7<br />
Fixed maturitiesÏÏÏÏÏÏÏÏÏÏÏÏÏÏÏÏÏÏÏÏÏÏ $921.8 $895.4 $816.9 Income producing properties ÏÏÏÏÏÏÏÏÏÏÏÏÏÏÏÏÏÏÏÏÏÏÏÏ 186.9 192.8<br />
Equity securities ÏÏÏÏÏÏÏÏÏÏÏÏÏÏÏÏÏÏÏÏÏ 25.6 23.5 31.2 Construction in progressÏÏÏÏÏÏÏÏÏÏÏÏÏÏÏÏÏÏÏÏÏÏÏÏÏÏÏÏ 51.8 69.0<br />
Short term investments ÏÏÏÏÏÏÏÏÏÏÏÏÏÏÏ 34.8 38.5 43.8 Land under development and unimproved land ÏÏÏÏÏÏÏÏÏÏÏ 310.2 325.6<br />
Other ÏÏÏÏÏÏÏÏÏÏÏÏÏÏÏÏÏÏÏÏÏÏÏÏÏÏÏÏÏÏ .6 (.2) 1.5 $646.6 $677.1<br />
Gross investment income ÏÏÏÏÏÏÏÏÏÏÏ 982.8 957.2 893.4<br />
Investment expensesÏÏÏÏÏÏÏÏÏÏÏÏÏÏÏÏÏÏ 14.1 13.7 13.7<br />
Substantially all mortgages and notes receivable are<br />
$968.7 $943.5 $879.7<br />
secured by buildings and land. Mortgages and notes<br />
(d) Realized investment gains and losses were as follows:<br />
receivable had an estimated aggregate fair value <strong>of</strong><br />
$89.0 million and $81.9 million at December 31, <strong>2001</strong><br />
Years Ended December 31 and 2000, respectively. The fair value amounts represent<br />
<strong>2001</strong> 2000 1999 point-in-time estimates that are not relevant in predicting<br />
(in millions)<br />
Gross realized investment gains<br />
future earnings or cash Öows related to such receivables.<br />
Fixed maturitiesÏÏÏÏÏÏÏÏÏÏÏÏÏÏÏÏÏÏÏÏ $ 56.9 $ 48.2 $ 38.2<br />
Equity securities ÏÏÏÏÏÏÏÏÏÏÏÏÏÏÏÏÏÏÏ 81.6 94.0 172.9 Depreciation expense related to income producing<br />
Sale <strong>of</strong> AAU ÏÏÏÏÏÏÏÏÏÏÏÏÏÏÏÏÏÏÏÏÏÏ Ì 44.9 Ì properties was $4.2 million, $4.0 million and $3.5 million<br />
138.5 187.1 211.1 for <strong>2001</strong>, 2000 and 1999, respectively.<br />
Gross realized investment losses<br />
Fixed maturitiesÏÏÏÏÏÏÏÏÏÏÏÏÏÏÏÏÏÏÏÏ 57.7 40.5 14.3<br />
Equity securities ÏÏÏÏÏÏÏÏÏÏÏÏÏÏÏÏÏÏÏ 80.0 95.1 109.4<br />
(8) Property and Equipment<br />
137.7 135.6 123.7 Property and equipment included in other assets were<br />
Realized investment gains ÏÏÏÏÏÏÏÏÏÏÏÏÏ .8 51.5 87.4 as follows:<br />
Income taxÏÏÏÏÏÏÏÏÏÏÏÏÏÏÏÏÏÏÏÏÏÏÏÏÏÏ .3 18.0 31.6<br />
December 31<br />
$ .5 $ 33.5 $ 55.8<br />
<strong>2001</strong> 2000<br />
(in millions)<br />
Cost ÏÏÏÏÏÏÏÏÏÏÏÏÏÏÏÏÏÏÏÏÏÏÏÏÏÏÏÏÏÏÏÏÏÏÏÏÏÏÏÏÏ $727.0 $599.8<br />
Accumulated depreciationÏÏÏÏÏÏÏÏÏÏÏÏÏÏÏÏÏÏÏÏÏÏÏ 279.8 235.9<br />
$447.2 $363.9<br />
Depreciation expense related to property and equipment<br />
was $90.9 million, $80.4 million and $64.9 million<br />
for <strong>2001</strong>, 2000 and 1999, respectively.<br />
57
(9) Unpaid Claims and Claim Expenses basis. As the Ñnancial resources <strong>of</strong> traditional asbestos<br />
defendants have been depleted, plaintiÅs are targeting<br />
The process <strong>of</strong> establishing loss reserves is complex<br />
these peripheral parties with greater frequency and, in<br />
and imprecise as it reÖects signiÑcant judgmental factors.<br />
many cases, for larger awards. In addition, the plaintiÅs'<br />
This is true because claim settlements to be made in the<br />
bar continues to solicit new claimants through extensive<br />
future will be impacted by changing rates <strong>of</strong> inÖation and<br />
advertising and through asbestos medical screenings. Litiother<br />
economic conditions, changing legislative, judicial<br />
gation is then initiated even though many <strong>of</strong> the claimand<br />
social environments and changes in the property and<br />
ants do not show any signs <strong>of</strong> asbestos-related illness.<br />
casualty insurance subsidiaries' claim handling<br />
Thus, new asbestos claims and new exposures on existing<br />
procedures.<br />
claims have continued unabated despite the fact that<br />
Most <strong>of</strong> the property and casualty insurance subsidiar- usage <strong>of</strong> asbestos has declined since the mid-1970's.<br />
ies' loss reserves relate to long tail liability classes <strong>of</strong> Based on published projections, it is expected that the<br />
business. For many liability claims signiÑcant periods <strong>of</strong> property and casualty insurance subsidiaries will con-<br />
time, ranging up to several years or more, may elapse tinue receiving asbestos claims at the current rate for at<br />
between the occurrence <strong>of</strong> the loss, the reporting <strong>of</strong> the least the next several years.<br />
loss and the settlement <strong>of</strong> the claim. The longer the time<br />
span between the incidence <strong>of</strong> a loss and the settlement Early asbestos claims focused on the major manufac-<br />
<strong>of</strong> the claim, the more the ultimate settlement amount turers, distributors or installers <strong>of</strong> asbestos products<br />
can vary.<br />
under the products liability section <strong>of</strong> primary general<br />
liability policies, which typically had aggregate limits that<br />
Judicial decisions and legislative actions continue to capped an insurer's liability. A growing number <strong>of</strong> asbesbroaden<br />
liability and policy deÑnitions and to increase tos claims by insureds are being presented as<br />
the severity <strong>of</strong> claim payments. As a result <strong>of</strong> this and ""non-products'' claims, such as those by installers <strong>of</strong><br />
other societal and economic developments, the uncer- asbestos products and by property owners who allegedly<br />
tainties inherent in estimating ultimate claim costs on the had asbestos on their property, under the premises or<br />
basis <strong>of</strong> past experience have been exacerbated, further operations section <strong>of</strong> primary general liability policies.<br />
complicating the already complex loss reserving process. Unlike products exposures, these non-products exposures<br />
typically had no aggregate limits, creating poten-<br />
The uncertainties relating to asbestos and toxic waste<br />
claims on insurance policies written many years ago are tially greater exposure. Further, in an eÅort to seek<br />
exacerbated by inconsistent court decisions and judicial additional insurance coverage, some insureds that have<br />
and legislative interpretations <strong>of</strong> coverage that in some substantially eroded their products coverage are present-<br />
cases have tended to erode the clear and express intent <strong>of</strong> ing new asbestos claims as non-products premises or<br />
such policies and in others have expanded theories <strong>of</strong> operations claims or attempting to reclassify old products<br />
liability. The industry as a whole is engaged in extensive claims. The extent to which insureds will be successful in<br />
litigation over these coverage and liability issues and is obtaining coverage on this basis is uncertain.<br />
thus confronted with a continuing uncertainty in its<br />
eÅorts to quantify these exposures.<br />
The expanded focus <strong>of</strong> asbestos litigation beyond as-<br />
bestos manufacturers and distributors to installers and<br />
Asbestos remains the most signiÑcant and diÇcult mass premises owners has created in some instances conÖicts<br />
tort for the insurance industry in terms <strong>of</strong> claims volume among insureds, primary insurers and excess insurers,<br />
and dollar exposure.<br />
primarily involving questions regarding allocation <strong>of</strong> indemnity<br />
and expense costs and exhaustion <strong>of</strong> policy<br />
The property and casualty insurance subsidiaries' most<br />
signiÑcant individual asbestos exposures involve tradition<br />
with the potential for inconsistent results.<br />
limits. These issues are generating costly coverage litiga-<br />
tional defendants who manufactured, distributed or installed<br />
asbestos products for whom excess liability<br />
coverages were written. While these insureds are relaity<br />
<strong>of</strong> the property and casualty insurance subsidiaries<br />
SigniÑcant uncertainty remains as to the ultimate liabil-<br />
tively few in number, such exposure has increased in<br />
recent years due to the increased volume <strong>of</strong> claims, the<br />
related to asbestos related claims due to such factors as<br />
erosion <strong>of</strong> much <strong>of</strong> the underlying limits and the bankdisease<br />
manifestation and the resulting potential for in-<br />
the long latency period between asbestos exposure and<br />
ruptcies <strong>of</strong> target defendants.<br />
volvement <strong>of</strong> multiple policy periods for individual<br />
Other asbestos exposures are mostly peripheral de- claims as well as the increase in the volume <strong>of</strong> claims by<br />
fendants, including a mix <strong>of</strong> manufacturers, distributors plaintiÅs who claim exposure but who have no symptoms<br />
and installers <strong>of</strong> certain products that contain asbestos as <strong>of</strong> asbestos-related disease and an increase in claims Ñled<br />
well as premises owners. Generally, these insureds are under the non-aggregate premises or operations section<br />
named defendants on a regional rather than a nationwide <strong>of</strong> general liability policies.<br />
58
Hazardous waste sites are another signiÑcant potential<br />
exposure. Under the federal ""Superfund'' law and similar<br />
state statutes, when potentially responsible parties<br />
(PRPs) fail to handle the clean-up at a site, regulators<br />
have the work done and then attempt to establish legal<br />
liability against the PRPs. Most PRPs named to date are<br />
parties who have been generators, transporters, past or<br />
present land owners or past or present site operators.<br />
The PRPs disposed <strong>of</strong> toxic materials at a waste dump site<br />
or transported the materials to the site. <strong>Insurance</strong> policies<br />
issued to PRPs were not intended to cover the cleanup<br />
costs <strong>of</strong> pollution and, in many cases, did not intend<br />
to cover the pollution itself.<br />
As the costs <strong>of</strong> environmental clean-up became substantial,<br />
PRPs and others increasingly Ñled claims with<br />
their insurance carriers. Litigation against insurers extends<br />
to issues <strong>of</strong> liability, coverage and other policy<br />
provisions.<br />
A reconciliation <strong>of</strong> the beginning and ending liability<br />
for unpaid claims and claim expenses, net <strong>of</strong> reinsurance<br />
recoverable, and a reconciliation <strong>of</strong> the net liability to the<br />
corresponding liability on a gross basis is as follows:<br />
<strong>2001</strong> 2000 1999<br />
(in millions)<br />
Gross liability, beginning <strong>of</strong> year ÏÏÏ $11,904.6 $11,434.7 $10,356.5<br />
Reinsurance recoverable,<br />
beginning <strong>of</strong> yearÏÏÏÏÏÏÏÏÏÏÏÏ 1,853.3 1,685.9 1,306.6<br />
Net liability, beginning <strong>of</strong> year ÏÏÏÏ 10,051.3 9,748.8 9,049.9<br />
Increase related to acquisition <strong>of</strong><br />
Executive Risk (net <strong>of</strong><br />
reinsurance recoverable<br />
<strong>of</strong> $339.5) ÏÏÏÏÏÏÏÏÏÏÏÏÏÏÏÏÏ Ì Ì 605.8<br />
Net incurred claims and claim<br />
expenses related to<br />
Current year ÏÏÏÏÏÏÏÏÏÏÏÏÏ 5,552.9 4,357.7 4,147.6<br />
Prior years ÏÏÏÏÏÏÏÏÏÏÏÏÏÏÏ (195.5) (230.0) (205.6)<br />
5,357.4 4,127.7 3,942.0<br />
There is great uncertainty involved in estimating the Net payments for claims and<br />
property and casualty insurance subsidiaries' liabilities claim expenses related to<br />
Current year ÏÏÏÏÏÏÏÏÏÏÏÏÏ 1,605.3 1,342.5 1,278.9<br />
related to these claims. First, the liabilities <strong>of</strong> the claim- Prior years ÏÏÏÏÏÏÏÏÏÏÏÏÏÏÏ 2,793.7 2,482.7 2,570.0<br />
ants are extremely diÇcult to estimate. At any given site, 4,399.0 3,825.2 3,848.9<br />
the allocation <strong>of</strong> remediation costs among governmental Net liability, end <strong>of</strong> yearÏÏÏÏÏÏÏÏ 11,009.7 10,051.3 9,748.8<br />
authorities and the PRPs varies greatly depending on a<br />
variety <strong>of</strong> factors. Second, diÅerent courts have addressed<br />
liability and coverage issues regarding pollution claims<br />
Reinsurance recoverable,<br />
end <strong>of</strong> year ÏÏÏÏÏÏÏÏÏÏÏÏÏÏÏÏÏ 4,505.2 1,853.3 1,685.9<br />
and have reached inconsistent conclusions in their inter- Gross liability, end <strong>of</strong> year ÏÏÏÏÏÏ $15,514.9 $11,904.6 $11,434.7<br />
pretation <strong>of</strong> several issues. These signiÑcant uncertainties<br />
are not likely to be resolved deÑnitively in the near<br />
future.<br />
At December 31, <strong>2001</strong>, the gross liability for unpaid<br />
claims and claim expenses and reinsurance recoverable<br />
included $2,775.2 million and $2,238.8 million, respec-<br />
tively, related to the September 11 attack.<br />
Uncertainties also remain as to the Superfund law<br />
itself. Superfund's taxing authority expired on December<br />
31, 1995 and has not been re-enacted. At this time, it<br />
is not possible to predict the direction that any reforms<br />
may take, when they may occur or the eÅect that any<br />
changes may have on the insurance industry.<br />
Reserves for asbestos and toxic waste claims cannot be<br />
estimated with traditional loss reserving techniques that<br />
rely on historical accident year loss development factors.<br />
Case reserves and expense reserves for costs <strong>of</strong> related<br />
litigation have been established where suÇcient information<br />
has been developed to indicate the involvement <strong>of</strong> a<br />
speciÑc insurance policy. In addition, incurred but not<br />
reported reserves have been established to cover additional<br />
exposures on both known and unasserted claims.<br />
Reserves for asbestos and toxic waste claims are continually<br />
reviewed and updated. Further increases in such loss<br />
reserves in future years are possible as legal and factual<br />
issues concerning these claims continue to be clariÑed.<br />
The amount cannot be reasonably estimated at the present<br />
time.<br />
Without federal movement on Superfund reform, the<br />
enforcement <strong>of</strong> Superfund liability is shifting to the<br />
states. States are being forced to reconsider state-level<br />
cleanup statutes and regulations. As individual states<br />
move forward, the potential for conÖicting state regulation<br />
becomes greater. SigniÑcant uncertainty remains as<br />
to the cost <strong>of</strong> remediating the state sites. Because <strong>of</strong> the<br />
large number <strong>of</strong> state sites, such sites could prove even<br />
more costly in the aggregate than Superfund sites.<br />
During <strong>2001</strong>, the property and casualty insurance<br />
subsidiaries experienced overall favorable development <strong>of</strong><br />
$195.5 million on net unpaid claims and claim expenses<br />
established as <strong>of</strong> the previous year-end. This compares<br />
with favorable development <strong>of</strong> $230.0 million and<br />
$205.6 million in 2000 and 1999, respectively. Such<br />
redundancies were reÖected in operating results in these<br />
respective years. Each <strong>of</strong> the past three years beneÑted<br />
from favorable claim experience for certain liability clas-<br />
ses, oÅset in part by losses related to asbestos and toxic<br />
waste claims.<br />
Management believes that the aggregate loss reserves<br />
<strong>of</strong> the property and casualty insurance subsidiaries at<br />
December 31, <strong>2001</strong> were adequate to cover claims for<br />
losses that had occurred, including both those known<br />
and those yet to be reported. In establishing such<br />
reserves, management considers facts currently known<br />
and the present state <strong>of</strong> the law and coverage litigation.<br />
However, given the expansion <strong>of</strong> coverage and liability by<br />
the courts and the legislatures in the past and the<br />
possibilities <strong>of</strong> similar interpretations in the future, particularly<br />
as they relate to asbestos and toxic waste claims,<br />
additional increases in loss reserves may emerge in future<br />
periods. Any such increases would have an adverse eÅect<br />
on future operating results. However, management does<br />
not expect that any such increases would have a material<br />
adverse eÅect on the Corporation's Ñnancial condition.<br />
59
(10) Debt and Credit Arrangements Executive Risk Capital Trust, wholly owned by <strong>Chubb</strong><br />
(a) Short term debt consists <strong>of</strong> commercial paper Executive Risk, has outstanding $125.0 million <strong>of</strong><br />
issued by <strong>Chubb</strong> Capital Corporation (<strong>Chubb</strong> Capital), 8.675% capital securities. The Trust in turn used the<br />
a wholly owned subsidiary <strong>of</strong> the Corporation, and is proceeds from the issuance <strong>of</strong> the capital securities to<br />
fully and unconditionally guaranteed by the Corporajunior<br />
acquire $125.0 million <strong>of</strong> <strong>Chubb</strong> Executive Risk 8.675%<br />
tion. Borrowings are unsecured and are on terms and at<br />
subordinated deferrable interest debentures due<br />
interest rates generally extended to prime borrowers. February 1, 2027. The sole assets <strong>of</strong> the Trust are the<br />
The weighted average interest rate on short term debt debentures. The debentures and the related income<br />
approximated 1.9% at December 31, <strong>2001</strong>.<br />
eÅects are eliminated in the consolidated Ñnancial state-<br />
(b) Long term debt consisted <strong>of</strong> the following:<br />
ments. The capital securities are subject to mandatory<br />
redemption on February 1, 2027, upon repayment <strong>of</strong> the<br />
December 31<br />
<strong>2001</strong> 2000 debentures. The capital securities are also subject to<br />
Carrying Fair Carrying Fair mandatory redemption in certain other speciÑed circum-<br />
Value Value Value Value stances beginning in 2007 at a redemption price that<br />
(in millions)<br />
includes a make whole premium through 2017 and at par<br />
Term loan ÏÏÏÏÏÏÏÏÏÏÏÏÏÏ $ 7.5 $ 7.5 $ 10.0 $ 10.0<br />
MortgagesÏÏÏÏÏÏÏÏÏÏÏÏÏÏÏ 43.5 52.5 43.8 49.0 thereafter. <strong>Chubb</strong> Executive Risk has the right, at any<br />
6% notes ÏÏÏÏÏÏÏÏÏÏÏÏÏÏÏ 400.0 393.5 Ì Ì<br />
6.15% notes ÏÏÏÏÏÏÏÏÏÏÏÏÏ 300.0 311.8 300.0 294.3 time, to defer payments <strong>of</strong> interest on the debentures and<br />
6.60% debentures ÏÏÏÏÏÏÏÏ 100.0 97.8 100.0 90.3 hence distributions on the capital securities for a period<br />
6.80% debentures ÏÏÏÏÏÏÏÏ 200.0 198.2 Ì Ì<br />
6∑% notes ÏÏÏÏÏÏÏÏÏÏÏÏÏÏ 100.0 104.4 100.0 100.8 not exceeding ten consecutive semi-annual periods up to<br />
7±% notes ÏÏÏÏÏÏÏÏÏÏÏÏÏÏ 75.0 79.4 75.0 75.6 the maturity dates <strong>of</strong> the respective securities. During<br />
8.675% capital securities ÏÏ 125.0 142.0 125.0 125.8<br />
$1,351.0 $1,387.1 $753.8 $745.8 any such period, interest will continue to accrue and<br />
<strong>Chubb</strong> Executive Risk may not declare or pay any<br />
The term loan and mortgages are obligations <strong>of</strong> the dividends to the Corporation. The capital securities are<br />
real estate subsidiaries. The term loan matures in 2002. unconditionally and on a subordinated basis guaranteed<br />
The mortgages payable are due in varying amounts by the Corporation.<br />
monthly through 2010. At December 31, <strong>2001</strong>, the<br />
interest rate on the term loan was 3.6% and the interest In August <strong>2001</strong>, the Corporation entered into a can-<br />
rate for the mortgages payable approximated 8 1 /2%. The celable interest rate swap agreement with a notional<br />
term loan and mortgages payable are secured by real amount <strong>of</strong> $125 million that replaces the Ñxed rate <strong>of</strong> the<br />
estate assets with a net book value <strong>of</strong> $179.4 million at capital securities with the 3-month LIBOR rate plus 204<br />
December 31, <strong>2001</strong>.<br />
basis points. The swap agreement provides only for the<br />
exchange <strong>of</strong> interest on the notional amount. The inter-<br />
In November <strong>2001</strong>, the Corporation sold $400.0 milest<br />
rate swap matures in February 2027. The fair value <strong>of</strong><br />
lion <strong>of</strong> unsecured 6% notes due November 15, 2011 and<br />
the swap at December 31, <strong>2001</strong> was not signiÑcant.<br />
$200 million <strong>of</strong> unsecured 6.80% debentures due<br />
November 15, 2031, the aggregate net proceeds from The Corporation Ñled a shelf registration statement<br />
which were $591.8 million.<br />
with the Securities and Exchange Commission in December<br />
The Corporation also has outstanding $300.0 million<br />
<strong>2001</strong>. When the registration statement is de-<br />
<strong>of</strong> unsecured 6.15% notes due August 15, 2005 and clared eÅective, up to $1.0 billion <strong>of</strong> various types <strong>of</strong><br />
$100.0 million <strong>of</strong> unsecured 6.60% debentures due August<br />
securities may be issued by the Corporation.<br />
15, 2018.<br />
The amounts <strong>of</strong> long term debt due annually during<br />
<strong>Chubb</strong> Capital has outstanding $100.0 million <strong>of</strong> un- the Ñve years subsequent to December 31, <strong>2001</strong> are as<br />
secured 6∑% notes due February 1, 2003. These notes follows:<br />
are fully and unconditionally guaranteed by the<br />
Years Ending<br />
Term Loan<br />
Corporation.<br />
December 31 and Mortgages Notes Total<br />
<strong>Chubb</strong> Executive Risk Inc., a wholly owned subsidiary<br />
(in millions)<br />
2002 ÏÏÏÏÏÏÏÏÏÏÏÏÏÏÏÏÏ $ 7.9 $ Ì $ 7.9<br />
<strong>of</strong> the Corporation, has outstanding $75.0 million <strong>of</strong><br />
2003 ÏÏÏÏÏÏÏÏÏÏÏÏÏÏÏÏÏ .4 100.0 100.4<br />
unsecured 7±% notes due December 15, 2007. These<br />
2004 ÏÏÏÏÏÏÏÏÏÏÏÏÏÏÏÏÏ .4 Ì .4<br />
notes are fully and unconditionally guaranteed by the 2005 ÏÏÏÏÏÏÏÏÏÏÏÏÏÏÏÏÏ .6 300.0 300.6<br />
Corporation. 2006 ÏÏÏÏÏÏÏÏÏÏÏÏÏÏÏÏÏ .6 Ì .6<br />
60
(c) Interest costs <strong>of</strong> $55.0 million, $52.9 million and subsidiaries <strong>of</strong> their primary obligation to the policyhold-<br />
$48.5 million were incurred in <strong>2001</strong>, 2000 and 1999, ers. Thus, a credit exposure exists with respect to reinrespectively.<br />
Interest paid was $55.5 million, $52.7 mil- surance ceded to the extent that any reinsurer is unable<br />
lion and $48.0 million in <strong>2001</strong>, 2000 and 1999, to meet the obligations assumed under the reinsurance<br />
respectively.<br />
contracts. The Corporation evaluates the Ñnancial condition<br />
(d) The Corporation has two credit agreements with<br />
<strong>of</strong> its reinsurers on an ongoing basis.<br />
a group <strong>of</strong> banks that provide for unsecured borrowings Premiums earned and insurance claims and claim ex<strong>of</strong><br />
up to $500.0 million in the aggregate. The $200.0 mil- penses are reported net <strong>of</strong> reinsurance in the consolilion<br />
short term revolving credit facility, which was to dated statements <strong>of</strong> income.<br />
have terminated on July 4, <strong>2001</strong>, was extended to July 2,<br />
2002, and may be renewed or replaced. The $300.0 milearned<br />
The eÅect <strong>of</strong> reinsurance on the premiums written and<br />
lion medium term revolving credit facility terminates on<br />
<strong>of</strong> the property and casualty insurance subsidiar-<br />
July 11, 2002. On the respective termination dates for ies was as follows:<br />
these agreements, any loans then outstanding become<br />
Years Ended December 31<br />
payable. There have been no borrowings under these<br />
<strong>2001</strong> 2000 1999<br />
agreements. Various interest rate options are available to<br />
(in millions)<br />
Direct premiums written ÏÏÏÏÏÏÏ $7,534.3 $6,741.6 $6,042.6<br />
the Corporation, all <strong>of</strong> which are based on market rates. Reinsurance assumed ÏÏÏÏÏÏÏÏÏÏ 525.2 384.4 275.2<br />
The Corporation pays a fee to have these credit facilities Reinsurance cededÏÏÏÏÏÏÏÏÏÏÏÏÏ (1,098.0) (792.8) (616.7)<br />
available. Unused credit facilities are available for general Net premiums writtenÏÏÏÏÏÏÏÏ $6,961.5 $6,333.2 $5,701.1<br />
corporate purposes and to support <strong>Chubb</strong> Capital's com-<br />
Direct premiums earned ÏÏÏÏÏÏÏÏ $7,125.8 $6,550.2 $6,037.1<br />
mercial paper borrowing arrangement. Reinsurance assumed ÏÏÏÏÏÏÏÏÏÏ 533.9 382.6 246.5<br />
Reinsurance cededÏÏÏÏÏÏÏÏÏÏÏÏÏ (1,003.3) (786.9) (631.6)<br />
(11) Reinsurance<br />
Net premiums earned ÏÏÏÏÏÏÏÏ $6,656.4 $6,145.9 $5,652.0<br />
In the ordinary course <strong>of</strong> business, the Corporation's<br />
Assumed reinsurance premiums earned and written<br />
insurance subsidiaries assume and cede reinsurance with<br />
and ceded reinsurance premiums earned and written for<br />
other insurance companies and are members <strong>of</strong> various<br />
<strong>2001</strong> included reinstatement premiums <strong>of</strong> $95.0 million<br />
pools and associations. Reinsurance is ceded to provide<br />
and $65.0 million, respectively, related to the Septemgreater<br />
diversiÑcation <strong>of</strong> risk and to limit the maximum<br />
ber 11 attack.<br />
net loss potential arising from large or concentrated risks.<br />
A large portion <strong>of</strong> the reinsurance is eÅected under Reinsurance recoveries by the property and casualty<br />
contracts known as treaties and in some instances by insurance subsidiaries that have been deducted from<br />
negotiation on individual risks. Certain <strong>of</strong> these arrange- insurance claims and claim expenses were $3,367.4 milments<br />
consist <strong>of</strong> excess <strong>of</strong> loss and catastrophe contracts lion, $791.0 million and $501.2 million in <strong>2001</strong>, 2000<br />
that protect against losses over stipulated amounts arising and 1999, respectively. The <strong>2001</strong> amount included refrom<br />
any one occurrence or event. Ceded reinsurance coveries <strong>of</strong> $2,385.2 million related to the September 11<br />
contracts do not relieve the Corporation's insurance attack.<br />
61
(12) Federal and Foreign Income Tax<br />
(a) Income tax expense (credit) consisted <strong>of</strong> the following components:<br />
Years Ended December 31<br />
<strong>2001</strong> 2000 1999<br />
(in millions)<br />
Current tax (credit)<br />
United StatesÏÏÏÏÏÏÏÏÏÏÏÏÏÏÏÏÏÏÏÏÏÏÏÏÏÏÏÏÏÏÏÏÏÏÏÏÏÏÏÏÏÏÏÏÏÏÏÏÏÏÏÏÏÏÏÏÏÏÏÏÏÏÏÏÏÏÏÏÏÏÏÏÏÏ $ (8.3) $152.1 $41.0<br />
Foreign ÏÏÏÏÏÏÏÏÏÏÏÏÏÏÏÏÏÏÏÏÏÏÏÏÏÏÏÏÏÏÏÏÏÏÏÏÏÏÏÏÏÏÏÏÏÏÏÏÏÏÏÏÏÏÏÏÏÏÏÏÏÏÏÏÏÏÏÏÏÏÏÏÏÏÏÏÏÏÏ 20.7 9.6 42.7<br />
Deferred tax (credit), principally United StatesÏÏÏÏÏÏÏÏÏÏÏÏÏÏÏÏÏÏÏÏÏÏÏÏÏÏÏÏÏÏÏÏÏÏÏÏÏÏÏÏÏÏÏÏÏÏÏ (189.9) (25.3) 5.3<br />
$(177.5) $136.4 $89.0<br />
Federal and foreign income taxes paid were $53.4 million, $159.7 million and $83.5 million in <strong>2001</strong>, 2000 and<br />
1999, respectively.<br />
(b) The provision for federal and foreign income tax gives eÅect to permanent diÅerences between income for<br />
Ñnancial reporting purposes and taxable income. Accordingly, the eÅective income tax rate is diÅerent than the statutory<br />
federal corporate tax rate. The reasons for the diÅerent eÅective tax rate were as follows:<br />
Years Ended December 31<br />
<strong>2001</strong> 2000 1999<br />
% <strong>of</strong> % <strong>of</strong> % <strong>of</strong><br />
Pre-Tax Pre-Tax Pre-Tax<br />
Amount Income Amount Income Amount Income<br />
(in millions)<br />
Income (loss) before federal and foreign income tax ÏÏÏÏÏÏÏÏÏÏÏÏÏ $ (66.0) $ 851.0 $ 710.1<br />
Tax (credit) at statutory federal income tax rate ÏÏÏÏÏÏÏÏÏÏÏÏÏÏÏÏÏ $ (23.1) (35.0)% $ 297.9 35.0% $ 248.5 35.0%<br />
Tax exempt interest income ÏÏÏÏÏÏÏÏÏÏÏÏÏÏÏÏÏÏÏÏÏÏÏÏÏÏÏÏÏÏÏÏÏÏ (149.3) (226.2) (153.9) (18.1) (150.6) (21.2)<br />
Other, net ÏÏÏÏÏÏÏÏÏÏÏÏÏÏÏÏÏÏÏÏÏÏÏÏÏÏÏÏÏÏÏÏÏÏÏÏÏÏÏÏÏÏÏÏÏÏÏÏÏ (5.1) (7.7) (7.6) (.9) (8.9) (1.3)<br />
Actual tax (credit) ÏÏÏÏÏÏÏÏÏÏÏÏÏÏÏÏÏÏÏÏÏÏÏÏÏÏÏÏÏÏÏÏÏÏÏÏ $(177.5) (268.9)% $ 136.4 16.0% $ 89.0 12.5%<br />
(c) The tax eÅects <strong>of</strong> temporary diÅerences that gave rise to deferred income tax assets and liabilities were as<br />
follows:<br />
December 31<br />
<strong>2001</strong> 2000<br />
(in millions)<br />
Deferred income tax assets<br />
Unpaid claims and claim expenses ÏÏÏÏÏÏÏÏÏÏÏÏÏÏÏÏÏÏÏÏÏÏÏÏÏÏÏÏÏÏÏÏÏÏÏÏÏÏÏÏÏÏÏÏÏÏÏÏÏÏÏÏÏÏÏÏÏÏÏÏÏ $ 560.3 $528.6<br />
Unearned premiums ÏÏÏÏÏÏÏÏÏÏÏÏÏÏÏÏÏÏÏÏÏÏÏÏÏÏÏÏÏÏÏÏÏÏÏÏÏÏÏÏÏÏÏÏÏÏÏÏÏÏÏÏÏÏÏÏÏÏÏÏÏÏÏÏÏÏÏÏÏÏÏÏÏ 219.9 201.6<br />
Postretirement beneÑts ÏÏÏÏÏÏÏÏÏÏÏÏÏÏÏÏÏÏÏÏÏÏÏÏÏÏÏÏÏÏÏÏÏÏÏÏÏÏÏÏÏÏÏÏÏÏÏÏÏÏÏÏÏÏÏÏÏÏÏÏÏÏÏÏÏÏÏÏÏÏÏ 79.8 77.8<br />
Alternative minimum tax credit carryforward ÏÏÏÏÏÏÏÏÏÏÏÏÏÏÏÏÏÏÏÏÏÏÏÏÏÏÏÏÏÏÏÏÏÏÏÏÏÏÏÏÏÏÏÏÏÏÏÏÏÏÏÏ 141.4 62.9<br />
Other, net ÏÏÏÏÏÏÏÏÏÏÏÏÏÏÏÏÏÏÏÏÏÏÏÏÏÏÏÏÏÏÏÏÏÏÏÏÏÏÏÏÏÏÏÏÏÏÏÏÏÏÏÏÏÏÏÏÏÏÏÏÏÏÏÏÏÏÏÏÏÏÏÏÏÏÏÏÏÏÏÏÏ 163.7 81.5<br />
Total ÏÏÏÏÏÏÏÏÏÏÏÏÏÏÏÏÏÏÏÏÏÏÏÏÏÏÏÏÏÏÏÏÏÏÏÏÏÏÏÏÏÏÏÏÏÏÏÏÏÏÏÏÏÏÏÏÏÏÏÏÏÏÏÏÏÏÏÏÏÏÏÏÏÏÏÏÏÏÏÏÏÏÏÏ 1,165.1 952.4<br />
Deferred income tax liabilities<br />
Deferred policy acquisition costsÏÏÏÏÏÏÏÏÏÏÏÏÏÏÏÏÏÏÏÏÏÏÏÏÏÏÏÏÏÏÏÏÏÏÏÏÏÏÏÏÏÏÏÏÏÏÏÏÏÏÏÏÏÏÏÏÏÏÏÏÏÏÏ 285.4 258.5<br />
Real estate assets ÏÏÏÏÏÏÏÏÏÏÏÏÏÏÏÏÏÏÏÏÏÏÏÏÏÏÏÏÏÏÏÏÏÏÏÏÏÏÏÏÏÏÏÏÏÏÏÏÏÏÏÏÏÏÏÏÏÏÏÏÏÏÏÏÏÏÏÏÏÏÏÏÏÏÏÏ 68.8 74.3<br />
Unrealized appreciation <strong>of</strong> investments ÏÏÏÏÏÏÏÏÏÏÏÏÏÏÏÏÏÏÏÏÏÏÏÏÏÏÏÏÏÏÏÏÏÏÏÏÏÏÏÏÏÏÏÏÏÏÏÏÏÏÏÏÏÏÏÏÏ 136.1 118.6<br />
Total ÏÏÏÏÏÏÏÏÏÏÏÏÏÏÏÏÏÏÏÏÏÏÏÏÏÏÏÏÏÏÏÏÏÏÏÏÏÏÏÏÏÏÏÏÏÏÏÏÏÏÏÏÏÏÏÏÏÏÏÏÏÏÏÏÏÏÏÏÏÏÏÏÏÏÏÏÏÏÏÏÏÏÏÏ 490.3 451.4<br />
Net deferred income tax asset ÏÏÏÏÏÏÏÏÏÏÏÏÏÏÏÏÏÏÏÏÏÏÏÏÏÏÏÏÏÏÏÏÏÏÏÏÏÏÏÏÏÏÏÏÏÏÏÏÏÏÏÏÏÏÏÏÏÏÏÏÏ $ 674.8 $501.0<br />
62
(13) Stock-Based Compensation Plans<br />
(a) In 2000, the Corporation adopted the Long-Term Stock Incentive Plan (2000), which succeeded the Long-<br />
Term Stock Incentive Plan (1996). The Long-Term Stock Incentive Plan (2000), which is similar to the 1996 plan,<br />
provides for the granting <strong>of</strong> stock options, performance shares, restricted stock and other stock-based awards to key<br />
employees. The maximum number <strong>of</strong> shares <strong>of</strong> the Corporation's common stock in respect to which stock-based awards<br />
may be granted under the 2000 Plan is 13,000,000. At December 31, <strong>2001</strong>, 9,075,809 shares were available for grant<br />
under the 2000 Plan.<br />
Stock options are granted at exercise prices not less than the fair market value <strong>of</strong> the Corporation's common stock<br />
on the date <strong>of</strong> grant. The terms and conditions upon which options become exercisable may vary among grants. Options<br />
expire no later than ten years from the date <strong>of</strong> grant.<br />
Information concerning stock options is as follows:<br />
<strong>2001</strong> 2000 1999<br />
Number Weighted Average Number Weighted Average Number Weighted Average<br />
<strong>of</strong> Shares Exercise Price <strong>of</strong> Shares Exercise Price <strong>of</strong> Shares Exercise Price<br />
Outstanding, beginning <strong>of</strong> year ÏÏÏÏÏÏÏÏÏ 16,683,741 $55.66 14,565,584 $55.58 9,765,090 $54.78<br />
Exchanged for Executive Risk options ÏÏÏ Ì Ì Ì Ì 1,809,885 36.77<br />
Granted ÏÏÏÏÏÏÏÏÏÏÏÏÏÏÏÏÏÏÏÏÏÏÏÏÏÏÏÏ 3,760,311 72.60 5,833,616 50.88 4,761,683 60.31<br />
ExercisedÏÏÏÏÏÏÏÏÏÏÏÏÏÏÏÏÏÏÏÏÏÏÏÏÏÏÏÏ (1,740,701) 47.80 (3,242,900) 46.05 (1,359,855) 39.50<br />
Forfeited ÏÏÏÏÏÏÏÏÏÏÏÏÏÏÏÏÏÏÏÏÏÏÏÏÏÏÏÏ (327,047) 67.51 (472,559) 60.13 (411,219) 64.20<br />
Outstanding, end <strong>of</strong> year ÏÏÏÏÏÏÏÏÏÏÏÏÏÏ 18,376,304 59.66 16,683,741 55.66 14,565,584 55.58<br />
Exercisable, end <strong>of</strong> year ÏÏÏÏÏÏÏÏÏÏÏÏÏÏÏ 12,215,260 57.86 8,787,173 57.80 9,187,352 51.09<br />
December 31, <strong>2001</strong><br />
Options Outstanding<br />
Options Exercisable<br />
Weighted Average<br />
Range <strong>of</strong> Number Weighted Average Remaining Number Weighted Average<br />
Option Exercise Prices Outstanding Exercise Price Contractual Life Exercisable Exercise Price<br />
$ 3.95 Ì $46.84 ÏÏÏÏÏÏÏÏÏÏÏÏÏÏÏÏÏÏÏ 1,437,650 $39.75 2.4 1,437,650 $39.75<br />
47.06 Ì 59.97 ÏÏÏÏÏÏÏÏÏÏÏÏÏÏÏÏÏÏÏ 9,243,089 52.95 6.7 6,782,637 54.31<br />
60.25 Ì 78.97 ÏÏÏÏÏÏÏÏÏÏÏÏÏÏÏÏÏÏÏ 7,695,565 71.44 6.7 3,994,973 70.41<br />
18,376,304 59.66 6.4 12,215,260 57.86<br />
Performance share awards are based on the achievement <strong>of</strong> various goals over performance cycle periods and are<br />
payable in cash, in shares <strong>of</strong> the Corporation's common stock or in a combination <strong>of</strong> both. Restricted stock awards<br />
consist <strong>of</strong> shares <strong>of</strong> common stock <strong>of</strong> the Corporation granted at no cost. Shares <strong>of</strong> restricted stock become outstanding<br />
when granted, receive dividends and have voting rights. The shares are subject to forfeiture and to restrictions that limit<br />
the sale or transfer during the restriction period.<br />
The Corporation uses the intrinsic value based method <strong>of</strong> accounting for stock-based compensation, under which<br />
compensation cost is measured as the excess, if any, <strong>of</strong> the quoted market price <strong>of</strong> the stock at the measurement date<br />
over the amount an employee must pay to acquire the stock. Since the exercise price <strong>of</strong> stock options granted under the<br />
Long-Term Stock Incentive Plans is not less than the market price <strong>of</strong> the underlying stock on the date <strong>of</strong> grant, no<br />
compensation cost is recognized for such grants. The cost <strong>of</strong> performance share awards is expensed over the<br />
performance cycle. An amount equal to the fair market value <strong>of</strong> restricted share awards at the date <strong>of</strong> grant is expensed<br />
over the restriction period. The aggregate amount charged against income with respect to performance share and<br />
restricted stock awards was $13.5 million in <strong>2001</strong>, $11.5 million in 2000 and $5.2 million in 1999.<br />
63
The following pro forma net income and earnings per share information has been determined as if the Corporation<br />
had accounted for stock-based compensation awarded under the Long-Term Stock Incentive Plans using the fair value<br />
based method. Under the fair value based method, the estimated fair value <strong>of</strong> awards at the grant date would be charged<br />
against income on a straight-line basis over the vesting period.<br />
<strong>2001</strong> 2000 1999<br />
As Pro As Pro As Pro<br />
<strong>Report</strong>ed Forma <strong>Report</strong>ed Forma <strong>Report</strong>ed Forma<br />
(in millions except for per share amounts)<br />
Net income ÏÏÏÏÏÏÏÏÏÏÏÏÏÏÏÏÏÏÏÏÏÏÏÏ $111.5 $65.7 $714.6 $669.6 $621.1 $585.6<br />
Diluted earnings per share ÏÏÏÏÏÏÏÏÏÏÏ .63 .37 4.01 3.76 3.66 3.45<br />
The weighted average fair value <strong>of</strong> options granted determined at the discretion <strong>of</strong> the Corporation's Board<br />
under the Long-Term Stock Incentive Plans during <strong>of</strong> Directors. The contributions, together with the divi-<br />
<strong>2001</strong>, 2000 and 1999 was $18.22, $11.98 and $13.77, dends on the shares <strong>of</strong> common stock in the ESOP, are<br />
respectively. The fair value <strong>of</strong> each option grant was used by the ESOP to make loan interest and principal<br />
estimated on the date <strong>of</strong> grant using the Black-Scholes payments to the Corporation. As interest and principal<br />
option pricing model with the following weighted aver- are paid, a portion <strong>of</strong> the common stock is allocated to<br />
age assumptions. The risk-free interest rates for <strong>2001</strong>, eligible employees.<br />
2000 and 1999 were 4.7%, 6.7% and 5.4%, respectively.<br />
The expected volatility <strong>of</strong> the market price <strong>of</strong> the Corporecognizing<br />
The Corporation uses the cash payment method <strong>of</strong><br />
ration's common stock for <strong>2001</strong>, 2000 and 1999 grants<br />
ESOP expense. In <strong>2001</strong>, 2000 and 1999, cash<br />
was 25.7%, 21.9% and 19.0%, respectively. The expected contributions to the ESOP <strong>of</strong> $11.3 million, $11.0 mil-<br />
average term <strong>of</strong> the granted options was 5 1 /2 years for lion and $11.2 million, respectively, were charged against<br />
<strong>2001</strong>, 2000 and 1999. The dividend yield was 1.9% for income. Dividends on shares <strong>of</strong> common stock in the<br />
<strong>2001</strong>, 2.7% for 2000 and 2.1% for 1999.<br />
ESOP used for debt service were $7.7 million for <strong>2001</strong>,<br />
2000 and 1999.<br />
(b) The Corporation has a leveraged Employee<br />
Stock Ownership Plan (ESOP) in which substantially all The number <strong>of</strong> allocated and unallocated shares<br />
employees are eligible to participate. At its inception in held by the ESOP at December 31, <strong>2001</strong> were 4,008,152<br />
1989, the ESOP used the proceeds <strong>of</strong> a $150.0 million and 1,558,444, respectively. All such shares are considloan<br />
from the Corporation to purchase 7,792,204 newly ered outstanding for the computation <strong>of</strong> earnings per<br />
issued shares <strong>of</strong> the Corporation's common stock. The share.<br />
loan is due in September 2004 and bears interest at 9%.<br />
The Corporation has recorded the receivable from the (c) The Corporation has a Stock Purchase Plan<br />
ESOP as a separate reduction <strong>of</strong> shareholders' equity on under which substantially all employees are eligible to<br />
the consolidated balance sheets. This balance is reduced purchase shares <strong>of</strong> the Corporation's common stock<br />
as repayments are made on the loan principal.<br />
based on compensation. In March <strong>2001</strong>, approximately<br />
1,100,000 shares were issued under the plan at a price <strong>of</strong><br />
The Corporation and its participating subsidiaries $53.89 per share. At December 31, <strong>2001</strong>, there were no<br />
make semi-annual contributions to the ESOP in amounts subscribed shares.<br />
64
(14) Employee BeneÑts The weighted average discount rate used in determining<br />
the actuarial present value <strong>of</strong> the projected beneÑt<br />
(a) The Corporation and its subsidiaries have several<br />
obligation at December 31, <strong>2001</strong> and 2000 was 7 1 /4% and<br />
non-contributory deÑned beneÑt pension plans covering<br />
7 1 /2%, respectively, and the rate <strong>of</strong> increase in future<br />
substantially all employees. Prior to <strong>2001</strong>, beneÑts were<br />
compensation levels was 4 1 /2% for both years. The exgenerally<br />
based on an employee's years <strong>of</strong> service and<br />
pected long term rate <strong>of</strong> return on assets was 9% for both<br />
average compensation during the last Ñve years <strong>of</strong> emyears.<br />
Plan assets are principally invested in publicly<br />
ployment. EÅective January 1, <strong>2001</strong>, the Corporation<br />
traded stocks and bonds.<br />
changed the formula for providing pension beneÑts from<br />
the Ñnal average pay formula to a cash balance formula, (b) The Corporation and its subsidiaries provide certain<br />
which credits employees semi-annually with an amount other postretirement benefits, principally health care and<br />
equal to a percentage <strong>of</strong> eligible compensation based on life insurance, to retired employees and their beneficiaries<br />
age and years <strong>of</strong> service as well as an interest credit based and covered dependents. Substantially all employees hired<br />
on individual account balances. Employees hired prior to before January 1, 1999 may become eligible for these<br />
<strong>2001</strong> will generally be eligible to receive vested beneÑts benefits upon retirement if they meet minimum age and<br />
based on the higher <strong>of</strong> the Ñnal average pay or cash years <strong>of</strong> service requirements. The expected cost <strong>of</strong> these<br />
balance formulas. This change in the pension beneÑt benefits is accrued during the years that the employees<br />
formula did not have a signiÑcant eÅect on the Corpora- render the necessary service.<br />
tion's Ñnancial position or results <strong>of</strong> operations.<br />
The Corporation does not fund these beneÑts in<br />
The Corporation's policy is to make annual contribu- advance. BeneÑts are paid as covered expenses are intions<br />
that meet the minimum funding requirements <strong>of</strong> curred. Health care coverage is contributory. Retiree<br />
the Employee Retirement Income Security Act <strong>of</strong> 1974. contributions vary based upon a retiree's age, type <strong>of</strong><br />
Contributions are intended to provide not only for coverage and years <strong>of</strong> service with the Corporation. Life<br />
beneÑts attributed to service to date but also for those insurance coverage is non-contributory.<br />
expected to be earned in the future.<br />
The components <strong>of</strong> net postretirement beneÑt cost<br />
The components <strong>of</strong> net pension cost were as follows: were as follows:<br />
Years Ended December 31 Years Ended December 31<br />
<strong>2001</strong> 2000 1999 <strong>2001</strong> 2000 1999<br />
(in millions)<br />
(in millions)<br />
Service cost <strong>of</strong> current period ÏÏÏÏ $ 28.6 $ 26.4 $ 22.2 Service cost <strong>of</strong> current period ÏÏÏÏÏÏ $ 5.0 $ 4.8 $ 4.5<br />
Interest cost on projected<br />
Interest cost on accumulated<br />
benefit obligation ÏÏÏÏÏÏÏÏÏÏÏÏÏ 43.9 40.2 37.6 beneÑt obligation ÏÏÏÏÏÏÏÏÏÏÏÏÏÏÏ 9.2 8.7 8.6<br />
Expected return on plan assets ÏÏÏÏ (53.5) (49.9) (44.5)<br />
Net amortization and deferral ÏÏÏÏÏÏÏ (1.4) (1.5) (1.0)<br />
Other gains ÏÏÏÏÏÏÏÏÏÏÏÏÏÏÏÏÏÏÏ (5.0) (6.3) (2.5)<br />
Net postretirement beneÑt cost ÏÏÏ $12.8 $12.0 $12.1<br />
Net pension cost ÏÏÏÏÏÏÏÏÏÏ $ 14.0 $ 10.4 $ 12.8<br />
The following table sets forth the plans' funded status<br />
and amounts recognized in the balance sheets:<br />
The components <strong>of</strong> the accumulated postretirement<br />
beneÑt obligation were as follows:<br />
December 31<br />
December 31 <strong>2001</strong> 2000<br />
<strong>2001</strong> 2000 (in millions)<br />
(in millions)<br />
Actuarial present value <strong>of</strong> projected beneÑt<br />
Accumulated postretirement benefit obligation ÏÏÏÏÏ $137.0 $126.3<br />
obligation for service rendered to date ÏÏÏÏÏÏÏ $665.2 $589.2 Unrecognized net gain from past experience<br />
Plan assets at fair value ÏÏÏÏÏÏÏÏÏÏÏÏÏÏÏÏÏÏÏÏÏÏ 538.8 594.1<br />
diÅerent from that assumed ÏÏÏÏÏÏÏÏÏÏÏÏÏÏÏÏÏ 31.7 35.6<br />
Projected beneÑt obligation in excess <strong>of</strong><br />
Postretirement beneÑt liability included in<br />
(less than) plan assetsÏÏÏÏÏÏÏÏÏÏÏÏÏÏÏÏÏÏÏÏÏ 126.4 (4.9)<br />
other liabilities ÏÏÏÏÏÏÏÏÏÏÏÏÏÏÏÏÏÏÏÏÏÏÏÏÏÏ $168.7 $161.9<br />
Unrecognized net gain from past experience<br />
diÅerent from that assumed ÏÏÏÏÏÏÏÏÏÏÏÏÏÏÏÏ 4.0 115.8<br />
Unrecognized prior service costs ÏÏÏÏÏÏÏÏÏÏÏÏÏÏ (19.7) (10.9)<br />
Unrecognized net asset at January 1, 1985,<br />
being recognized principally over 19 years ÏÏÏÏÏ .6 2.1<br />
Pension liability included in other liabilitiesÏÏÏÏÏ $111.3 $102.1<br />
65
The weighted average discount rate used in determin- At December 31, <strong>2001</strong>, future minimum rental paying<br />
the actuarial present value <strong>of</strong> the accumulated postre- ments required under non-cancellable operating leases<br />
tirement beneÑt obligation at December 31, <strong>2001</strong> and were as follows:<br />
2000 was 7 1 /4% and 7 1 /2%, respectively. At December 31,<br />
Years Ending<br />
<strong>2001</strong>, the weighted average health care cost trend rate December 31 (in millions)<br />
used to measure the accumulated postretirement cost for<br />
2002 ÏÏÏÏÏÏÏÏÏÏÏÏÏÏÏÏÏÏÏÏÏÏÏÏÏÏÏÏÏÏÏÏÏÏÏ $ 91.3<br />
medical beneÑts was 10% for 2002 and was assumed to 2003 ÏÏÏÏÏÏÏÏÏÏÏÏÏÏÏÏÏÏÏÏÏÏÏÏÏÏÏÏÏÏÏÏÏÏÏ 82.1<br />
decrease gradually to 5% for the year 2009 and remain at 2004 ÏÏÏÏÏÏÏÏÏÏÏÏÏÏÏÏÏÏÏÏÏÏÏÏÏÏÏÏÏÏÏÏÏÏÏ 73.4<br />
that level thereafter. The health care cost trend rate 2005 ÏÏÏÏÏÏÏÏÏÏÏÏÏÏÏÏÏÏÏÏÏÏÏÏÏÏÏÏÏÏÏÏÏÏÏ 65.0<br />
2006 ÏÏÏÏÏÏÏÏÏÏÏÏÏÏÏÏÏÏÏÏÏÏÏÏÏÏÏÏÏÏÏÏÏÏÏ 58.6<br />
assumption has a signiÑcant eÅect on the amount <strong>of</strong> the<br />
After 2006 ÏÏÏÏÏÏÏÏÏÏÏÏÏÏÏÏÏÏÏÏÏÏÏÏÏÏÏÏÏÏ 349.8<br />
accumulated postretirement beneÑt obligation and the<br />
$720.2<br />
net postretirement beneÑt cost reported. To illustrate, a<br />
one percent increase or decrease in the trend rate for<br />
each year would increase or decrease the accumulated (16) Commitments and Contingent Liabilities<br />
postretirement beneÑt obligation at December 31, <strong>2001</strong><br />
(a) CFSI participates in the credit derivatives busiby<br />
approximately $22 million and the aggregate <strong>of</strong> the<br />
ness, principally as a counterparty to credit default swaps.<br />
service and interest cost components <strong>of</strong> net postretire-<br />
The Corporation has issued unconditional guarantees<br />
ment beneÑt cost for the year ended December 31, <strong>2001</strong><br />
with respect to all obligations <strong>of</strong> CFSI arising from these<br />
by approximately $3 million.<br />
transactions.<br />
(c) The Corporation and its subsidiaries have a sav- Obligations with respect to credit default swaps are<br />
ings plan, the Capital Accumulation Plan, in which carried at estimated fair value. At December 31, <strong>2001</strong>,<br />
substantially all employees are eligible to participate. the fair value <strong>of</strong> future obligations under credit default<br />
Under this plan, the employer makes a matching contri- swaps was $47.9 million. At that date, the aggregate<br />
bution equal to 100% <strong>of</strong> each eligible employee's pre-tax exposure or retained risk, referred to as notional<br />
elective contributions, up to 4% <strong>of</strong> the employee's com- amounts, from open credit default swaps was approxipensation.<br />
Contributions are invested at the election <strong>of</strong> mately $14.3 billion. The notional amounts are used to<br />
the employee in the Corporation's common stock or in express the extent <strong>of</strong> involvement in swap transactions.<br />
various other investment funds. Employer contributions Notional amounts are not a quantiÑcation <strong>of</strong> market risk<br />
<strong>of</strong> $18.6 million, $17.1 million and $15.1 million were or credit risk and are not recorded on the balance sheet.<br />
charged against income in <strong>2001</strong>, 2000 and 1999, The notional amounts are used to calculate the exchange<br />
respectively.<br />
<strong>of</strong> contractual cash Öows and are not necessarily representative<br />
<strong>of</strong> the potential for gain or loss.<br />
(15) Leases<br />
(b) A property and casualty insurance subsidiary issued<br />
The Corporation and its subsidiaries occupy oÇce<br />
a reinsurance contract to an insurer that provides<br />
facilities under lease agreements that expire at various Ñnancial guarantees on asset-backed transactions. At De-<br />
dates through 2019; such leases are generally renewed or cember 31, <strong>2001</strong>, the aggregate principal commitments<br />
replaced by other leases. In addition, the Corporation's related to the contract for which the subsidiary was<br />
subsidiaries lease data processing, oÇce and transportalion,<br />
contingently liable amounted to approximately $400 mil-<br />
tion equipment.<br />
all <strong>of</strong> which expire by<br />
2023.<br />
Most leases contain renewal options for increments<br />
ranging from three to Ñve years; certain lease agreements<br />
provide for rent increases based on price-level factors. All<br />
leases are operating leases.<br />
Rent expense was as follows:<br />
Years Ended<br />
December 31<br />
<strong>2001</strong> 2000 1999<br />
(in millions)<br />
OÇce facilities ÏÏÏÏÏÏÏÏÏÏÏÏÏÏÏÏÏÏÏÏÏÏÏÏÏÏÏÏ $82.3 $75.2 $71.0<br />
Equipment ÏÏÏÏÏÏÏÏÏÏÏÏÏÏÏÏÏÏÏÏÏÏÏÏÏÏÏÏÏÏÏ 15.5 14.6 13.4<br />
$97.8 $89.8 $84.4<br />
66
(17) Earnings Per Share<br />
Basic earnings per common share is based on net income divided by the weighted average number <strong>of</strong> common<br />
shares outstanding during each year. Diluted earnings per share includes the maximum dilutive eÅect <strong>of</strong> awards under<br />
stock-based compensation plans.<br />
The following table sets forth the computation <strong>of</strong> basic and diluted earnings per share:<br />
Years Ended December 31<br />
<strong>2001</strong> 2000 1999<br />
(in millions except for per<br />
share amounts)<br />
Basic earnings per share:<br />
Net income ÏÏÏÏÏÏÏÏÏÏÏÏÏÏÏÏÏÏÏÏÏÏÏÏÏÏÏÏÏÏÏÏÏÏÏÏÏÏÏÏÏÏÏÏÏÏÏÏÏÏÏÏÏÏÏÏÏÏÏÏÏÏÏÏÏÏÏÏÏÏÏÏÏÏÏÏÏÏÏÏÏÏÏÏ $111.5 $714.6 $621.1<br />
Weighted average number <strong>of</strong> common shares outstanding ÏÏÏÏÏÏÏÏÏÏÏÏÏÏÏÏÏÏÏÏÏÏÏÏÏÏÏÏÏÏÏÏÏÏÏÏÏÏÏÏÏÏÏÏ 172.2 174.3 167.7<br />
Basic earnings per share ÏÏÏÏÏÏÏÏÏÏÏÏÏÏÏÏÏÏÏÏÏÏÏÏÏÏÏÏÏÏÏÏÏÏÏÏÏÏÏÏÏÏÏÏÏÏÏÏÏÏÏÏÏÏÏÏÏÏÏÏÏÏÏÏÏÏÏÏÏÏÏÏÏ $ .65 $ 4.10 $ 3.70<br />
Diluted earnings per share:<br />
Net income ÏÏÏÏÏÏÏÏÏÏÏÏÏÏÏÏÏÏÏÏÏÏÏÏÏÏÏÏÏÏÏÏÏÏÏÏÏÏÏÏÏÏÏÏÏÏÏÏÏÏÏÏÏÏÏÏÏÏÏÏÏÏÏÏÏÏÏÏÏÏÏÏÏÏÏÏÏÏÏÏÏÏÏÏ $111.5 $714.6 $621.1<br />
Weighted average number <strong>of</strong> common shares outstanding ÏÏÏÏÏÏÏÏÏÏÏÏÏÏÏÏÏÏÏÏÏÏÏÏÏÏÏÏÏÏÏÏÏÏÏÏÏÏÏÏÏÏÏÏ 172.2 174.3 167.7<br />
Additional shares from assumed exercise <strong>of</strong> stock-based compensation awardsÏÏÏÏÏÏÏÏÏÏÏÏÏÏÏÏÏÏÏÏÏÏÏÏÏÏÏÏ 3.6 4.0 2.1<br />
Weighted average number <strong>of</strong> common shares and potential common shares assumed outstanding for<br />
computing diluted earnings per share ÏÏÏÏÏÏÏÏÏÏÏÏÏÏÏÏÏÏÏÏÏÏÏÏÏÏÏÏÏÏÏÏÏÏÏÏÏÏÏÏÏÏÏÏÏÏÏÏÏÏÏÏÏÏÏÏÏÏÏÏ 175.8 178.3 169.8<br />
Diluted earnings per share ÏÏÏÏÏÏÏÏÏÏÏÏÏÏÏÏÏÏÏÏÏÏÏÏÏÏÏÏÏÏÏÏÏÏÏÏÏÏÏÏÏÏÏÏÏÏÏÏÏÏÏÏÏÏÏÏÏÏÏÏÏÏÏÏÏÏÏÏÏÏÏ $ .63 $ 4.01 $ 3.66<br />
In <strong>2001</strong>, 2000 and 1999, options to purchase 4.0 million shares, 3.5 million shares and 5.2 million shares <strong>of</strong><br />
common stock with weighted average exercise prices <strong>of</strong> $76.27 per share, $68.81 per share and $67.71 per share,<br />
respectively, were excluded from the computation <strong>of</strong> diluted earnings per share because the options' exercise prices were<br />
greater than the average market price <strong>of</strong> the Corporation's common stock.<br />
For additional disclosure regarding the stock-based compensation awards, see Note (13).<br />
(18) Segments Information<br />
The property and casualty operations include three<br />
reportable underwriting segments and the investment<br />
function. The underwriting segments are personal insurance,<br />
commercial insurance and specialty insurance. The<br />
personal segment targets the personal insurance market.<br />
The personal classes include automobile, homeowners<br />
and other personal coverages. The commercial segment<br />
includes those classes <strong>of</strong> business that are generally avail-<br />
able in broad markets and are <strong>of</strong> a more commodity<br />
nature. Commercial classes include multiple peril, casu-<br />
alty, workers' compensation and property and marine.<br />
The specialty segment includes those classes <strong>of</strong> business<br />
that are available in more limited markets since they<br />
require specialized underwriting and claim settlement.<br />
Specialty classes include executive protection, Ñnancial<br />
institutions and other specialty coverages.<br />
The property and casualty underwriting segments<br />
were changed in <strong>2001</strong> to present results in a manner<br />
more consistent with the way the business is now managed.<br />
The property and marine business was reclassiÑed<br />
from the specialty insurance segment to the commercial<br />
insurance segment and some business that was included<br />
within executive protection was reclassiÑed to multiple<br />
peril. Prior period amounts have been reclassiÑed to<br />
conform to the new presentation.<br />
Corporate and other includes investment income<br />
earned on corporate invested assets, corporate expenses<br />
and the results <strong>of</strong> CFSI and the Corporation's real estate<br />
and other non-insurance subsidiaries.<br />
The accounting policies <strong>of</strong> the segments are the same<br />
as those described in the summary <strong>of</strong> signiÑcant account-<br />
ing policies in Note (1). Performance <strong>of</strong> the property<br />
and casualty underwriting segments is based on under-<br />
writing results before deferred policy acquisition costs,<br />
amortization <strong>of</strong> goodwill and certain charges. Investment<br />
income performance is based on investment income net<br />
<strong>of</strong> investment expenses, excluding realized investment<br />
gains.<br />
67
Distinct investment portfolios are not maintained for each underwriting segment. Property and casualty invested<br />
assets are available for payment <strong>of</strong> claims and expenses for all classes <strong>of</strong> business. Therefore, such assets and the related<br />
investment income are not allocated to underwriting segments.<br />
Revenues, income before income tax and assets <strong>of</strong> each operating segment were as follows:<br />
Years Ended December 31<br />
<strong>2001</strong> 2000 1999<br />
Revenues<br />
(in millions)<br />
Property and casualty insurance<br />
Premiums earned<br />
Personal insurance ÏÏÏÏÏÏÏÏÏÏÏÏÏÏÏÏÏÏÏÏÏÏÏÏÏÏÏÏÏÏÏÏÏÏÏÏÏÏÏÏÏÏÏÏÏÏÏÏÏÏÏÏÏÏÏÏ $1,847.9 $1,620.6 $1,447.5<br />
Commercial insurance ÏÏÏÏÏÏÏÏÏÏÏÏÏÏÏÏÏÏÏÏÏÏÏÏÏÏÏÏÏÏÏÏÏÏÏÏÏÏÏÏÏÏÏÏÏÏÏÏÏÏÏÏÏ 2,366.3 2,353.7 2,495.2<br />
Specialty insuranceÏÏÏÏÏÏÏÏÏÏÏÏÏÏÏÏÏÏÏÏÏÏÏÏÏÏÏÏÏÏÏÏÏÏÏÏÏÏÏÏÏÏÏÏÏÏÏÏÏÏÏÏÏÏÏÏ 2,442.2 2,171.6 1,709.3<br />
6,656.4 6,145.9 5,652.0<br />
Investment incomeÏÏÏÏÏÏÏÏÏÏÏÏÏÏÏÏÏÏÏÏÏÏÏÏÏÏÏÏÏÏÏÏÏÏÏÏÏÏÏÏÏÏÏÏÏÏÏÏÏÏÏÏÏÏÏÏÏÏÏÏ 914.7 890.8 832.6<br />
Total property and casualty insuranceÏÏÏÏÏÏÏÏÏÏÏÏÏÏÏÏÏÏÏÏÏÏÏÏÏÏÏÏÏÏÏÏÏÏÏÏÏÏÏÏ 7,571.1 7,036.7 6,484.6<br />
Corporate and other<br />
Corporate investment incomeÏÏÏÏÏÏÏÏÏÏÏÏÏÏÏÏÏÏÏÏÏÏÏÏÏÏÏÏÏÏÏÏÏÏÏÏÏÏÏÏÏÏÏÏÏÏÏÏÏÏÏ 68.1 66.4 60.8<br />
Real estate and other ÏÏÏÏÏÏÏÏÏÏÏÏÏÏÏÏÏÏÏÏÏÏÏÏÏÏÏÏÏÏÏÏÏÏÏÏÏÏÏÏÏÏÏÏÏÏÏÏÏÏÏÏÏÏÏÏÏÏ 114.0 96.9 96.8<br />
Realized investment gains ÏÏÏÏÏÏÏÏÏÏÏÏÏÏÏÏÏÏÏÏÏÏÏÏÏÏÏÏÏÏÏÏÏÏÏÏÏÏÏÏÏÏÏÏÏÏÏÏÏÏÏÏÏÏÏÏÏÏ .8 51.5 87.4<br />
Total revenues ÏÏÏÏÏÏÏÏÏÏÏÏÏÏÏÏÏÏÏÏÏÏÏÏÏÏÏÏÏÏÏÏÏÏÏÏÏÏÏÏÏÏÏÏÏÏÏÏÏÏÏÏÏÏÏÏÏÏÏ $7,754.0 $7,251.5 $6,729.6<br />
Income (loss) before income tax<br />
Property and casualty insurance<br />
Underwriting<br />
Personal insurance ÏÏÏÏÏÏÏÏÏÏÏÏÏÏÏÏÏÏÏÏÏÏÏÏÏÏÏÏÏÏÏÏÏÏÏÏÏÏÏÏÏÏÏÏÏÏÏÏÏÏÏÏÏÏÏÏ $ (67.3) $ 80.7 $ 121.1<br />
Commercial insurance ÏÏÏÏÏÏÏÏÏÏÏÏÏÏÏÏÏÏÏÏÏÏÏÏÏÏÏÏÏÏÏÏÏÏÏÏÏÏÏÏÏÏÏÏÏÏÏÏÏÏÏÏÏ (290.2) (326.7) (464.1)<br />
Specialty insuranceÏÏÏÏÏÏÏÏÏÏÏÏÏÏÏÏÏÏÏÏÏÏÏÏÏÏÏÏÏÏÏÏÏÏÏÏÏÏÏÏÏÏÏÏÏÏÏÏÏÏÏÏÏÏÏÏ (632.8) 160.1 168.4<br />
(990.3) (85.9) (174.6)<br />
Increase (decrease) in deferred policy acquisition costs ÏÏÏÏÏÏÏÏÏÏÏÏÏÏÏÏÏÏÏÏÏÏÏÏÏ 86.8 62.3 (4.2)<br />
Underwriting lossÏÏÏÏÏÏÏÏÏÏÏÏÏÏÏÏÏÏÏÏÏÏÏÏÏÏÏÏÏÏÏÏÏÏÏÏÏÏÏÏÏÏÏÏÏÏÏÏÏÏÏÏÏÏÏÏÏÏÏÏÏ (903.5) (23.6) (178.8)<br />
Investment incomeÏÏÏÏÏÏÏÏÏÏÏÏÏÏÏÏÏÏÏÏÏÏÏÏÏÏÏÏÏÏÏÏÏÏÏÏÏÏÏÏÏÏÏÏÏÏÏÏÏÏÏÏÏÏÏÏÏÏÏÏ 902.6 879.2 821.0<br />
Amortization <strong>of</strong> goodwill and other chargesÏÏÏÏÏÏÏÏÏÏÏÏÏÏÏÏÏÏÏÏÏÏÏÏÏÏÏÏÏÏÏÏÏÏÏÏÏÏÏ (52.3) (52.2) (16.0)<br />
Total property and casualty insuranceÏÏÏÏÏÏÏÏÏÏÏÏÏÏÏÏÏÏÏÏÏÏÏÏÏÏÏÏÏÏÏÏÏÏÏÏÏÏÏÏ (53.2) 803.4 626.2<br />
Corporate and other income (loss)ÏÏÏÏÏÏÏÏÏÏÏÏÏÏÏÏÏÏÏÏÏÏÏÏÏÏÏÏÏÏÏÏÏÏÏÏÏÏÏÏÏÏÏÏÏÏÏÏÏÏ (13.6) (3.9) (3.5)<br />
Realized investment gains ÏÏÏÏÏÏÏÏÏÏÏÏÏÏÏÏÏÏÏÏÏÏÏÏÏÏÏÏÏÏÏÏÏÏÏÏÏÏÏÏÏÏÏÏÏÏÏÏÏÏÏÏÏÏÏÏÏÏ .8 51.5 87.4<br />
Total income (loss) before income taxÏÏÏÏÏÏÏÏÏÏÏÏÏÏÏÏÏÏÏÏÏÏÏÏÏÏÏÏÏÏÏÏÏÏÏÏÏÏÏ $ (66.0) $ 851.0 $ 710.1<br />
December 31<br />
<strong>2001</strong> 2000 1999<br />
(in millions)<br />
Assets<br />
Property and casualty insurance ÏÏÏÏÏÏÏÏÏÏÏÏÏÏÏÏÏÏÏÏÏÏÏÏÏÏÏÏÏÏÏÏÏÏÏÏÏÏÏÏÏÏÏÏÏÏÏÏÏÏÏÏÏ $27,767.0 $23,066.1 $21,628.1<br />
Corporate and other ÏÏÏÏÏÏÏÏÏÏÏÏÏÏÏÏÏÏÏÏÏÏÏÏÏÏÏÏÏÏÏÏÏÏÏÏÏÏÏÏÏÏÏÏÏÏÏÏÏÏÏÏÏÏÏÏÏÏÏÏÏÏ 1,752.9 2,030.4 1,976.9<br />
Adjustments and eliminationsÏÏÏÏÏÏÏÏÏÏÏÏÏÏÏÏÏÏÏÏÏÏÏÏÏÏÏÏÏÏÏÏÏÏÏÏÏÏÏÏÏÏÏÏÏÏÏÏÏÏÏÏÏÏÏ (70.9) (69.8) (68.0)<br />
Total assets ÏÏÏÏÏÏÏÏÏÏÏÏÏÏÏÏÏÏÏÏÏÏÏÏÏÏÏÏÏÏÏÏÏÏÏÏÏÏÏÏÏÏÏÏÏÏÏÏÏÏÏÏÏÏÏÏÏÏÏÏÏÏ $29,449.0 $25,026.7 $23,537.0<br />
Property and casualty results for <strong>2001</strong> included an underwriting loss <strong>of</strong> $635.0 million from the September 11<br />
attack, comprising $20.0 million in personal insurance, $103.2 million in commercial insurance and $511.8 million in<br />
specialty insurance, as well as other charges <strong>of</strong> $10.0 million. Specialty insurance underwriting results in <strong>2001</strong> also<br />
included net surety bond losses <strong>of</strong> $220.0 million related to the bankruptcy <strong>of</strong> Enron Corp.<br />
The international business <strong>of</strong> the property and casualty insurance segment is conducted primarily through<br />
subsidiaries that operate solely outside <strong>of</strong> the United States. Their assets and liabilities are located principally in the<br />
countries where the insurance risks are written. International business is also written by branch oÇces <strong>of</strong> certain<br />
domestic subsidiaries.<br />
Revenues <strong>of</strong> the property and casualty insurance subsidiaries by geographic area were as follows:<br />
Years Ended December 31<br />
<strong>2001</strong> 2000 1999<br />
(in millions)<br />
Revenues<br />
United States ÏÏÏÏÏÏÏÏÏÏÏÏÏÏÏÏÏÏÏÏÏÏÏÏÏÏÏÏÏÏÏÏÏÏÏÏÏÏÏÏÏÏÏÏÏÏÏÏÏÏÏÏÏÏÏÏÏÏÏÏÏÏÏÏÏÏÏÏÏÏÏÏÏÏÏÏÏÏ $6,331.9 $5,914.9 $5,452.1<br />
InternationalÏÏÏÏÏÏÏÏÏÏÏÏÏÏÏÏÏÏÏÏÏÏÏÏÏÏÏÏÏÏÏÏÏÏÏÏÏÏÏÏÏÏÏÏÏÏÏÏÏÏÏÏÏÏÏÏÏÏÏÏÏÏÏÏÏÏÏÏÏÏÏÏÏÏÏÏÏÏÏ 1,239.2 1,121.8 1,032.5<br />
Total ÏÏÏÏÏÏÏÏÏÏÏÏÏÏÏÏÏÏÏÏÏÏÏÏÏÏÏÏÏÏÏÏÏÏÏÏÏÏÏÏÏÏÏÏÏÏÏÏÏÏÏÏÏÏÏÏÏÏÏÏÏÏÏÏÏÏÏÏÏÏÏÏÏÏÏÏÏÏÏÏÏÏÏ $7,571.1 $7,036.7 $6,484.6<br />
68
(19) Fair Values <strong>of</strong> Financial Instruments (iii) Fair values <strong>of</strong> equity securities with active<br />
markets are based on quoted market prices. For other<br />
Fair values <strong>of</strong> Ñnancial instruments are based on equity securities, fair values are estimates <strong>of</strong> value.<br />
quoted market prices where available. Fair values <strong>of</strong><br />
(iv) Fair values <strong>of</strong> real estate mortgages and notes<br />
Ñnancial instruments for which quoted market prices are<br />
receivable are estimated individually as the value <strong>of</strong> the<br />
not available are based on estimates using present value<br />
discounted future cash Öows <strong>of</strong> the loan, subject to the<br />
or other valuation techniques. Those techniques are<br />
estimated fair value <strong>of</strong> the underlying collateral. The<br />
signiÑcantly aÅected by the assumptions used, including<br />
cash Öows are discounted at rates based on a U.S.<br />
the discount rates and the estimated amounts and timing<br />
Treasury security with a maturity similar to the loan,<br />
<strong>of</strong> future cash Öows. In such instances, the derived fair<br />
adjusted for credit risk.<br />
value estimates cannot be substantiated by comparison to<br />
independent markets and are not necessarily indicative <strong>of</strong> (v) The carrying value <strong>of</strong> short term debt approxithe<br />
amounts that could be realized in immediate settle- mates fair value due to the short maturities <strong>of</strong> this<br />
ment <strong>of</strong> the instrument. Certain Ñnancial instruments, debt.<br />
particularly insurance contracts, are excluded from fair<br />
value disclosure requirements.<br />
(vi) Long term debt consists <strong>of</strong> a term loan, mort-<br />
gages payable, long term notes and capital securities.<br />
The methods and assumptions used to estimate the fair<br />
The fair value <strong>of</strong> the term loan approximates the<br />
value <strong>of</strong> Ñnancial instruments are as follows:<br />
carrying value because such loan consists <strong>of</strong> variable-<br />
rate debt that reprices frequently. Fair values <strong>of</strong> mortgages<br />
payable are estimated using discounted cash Öow<br />
(i) The carrying value <strong>of</strong> short term investments<br />
approximates fair value due to the short maturities <strong>of</strong><br />
analyses. Fair values <strong>of</strong> the long term notes and capital<br />
these investments.<br />
securities are based on prices quoted by dealers.<br />
(vii) Fair values <strong>of</strong> credit derivatives, principally<br />
(ii) Fair values <strong>of</strong> Ñxed maturities with active mar- credit default swaps, are determined using an internal<br />
kets are based on quoted market prices. For Ñxed valuation model that is similar to external valuation<br />
maturities that trade in less active markets, fair values models. The fair value <strong>of</strong> a credit default swap is<br />
are obtained from independent pricing services. Fair subject to Öuctuations arising from, among other facvalues<br />
<strong>of</strong> Ñxed maturities are principally a function <strong>of</strong> tors, observable changes in credit spreads and interest<br />
current interest rates. Care should be used in evaluat- rates.<br />
ing the signiÑcance <strong>of</strong> these estimated market values<br />
which can Öuctuate based on such factors as interest<br />
rates, inÖation, monetary policy and general economic<br />
conditions.<br />
The carrying values and fair values <strong>of</strong> Ñnancial instruments were as follows:<br />
December 31<br />
<strong>2001</strong> 2000<br />
Carrying Fair Carrying Fair<br />
Value Value Value Value<br />
(in millions)<br />
Assets<br />
Invested assets<br />
Short term investments ÏÏÏÏÏÏÏÏÏÏÏÏÏÏÏÏÏÏÏÏÏÏÏÏÏÏÏÏÏÏÏÏÏÏÏÏÏÏÏÏÏÏÏÏÏÏÏÏÏÏÏÏÏÏÏÏ $ 956.8 $ 956.8 $ 605.6 $ 605.6<br />
Fixed maturities (Note 5)<br />
Held-to-maturity ÏÏÏÏÏÏÏÏÏÏÏÏÏÏÏÏÏÏÏÏÏÏÏÏÏÏÏÏÏÏÏÏÏÏÏÏÏÏÏÏÏÏÏÏÏÏÏÏÏÏÏÏÏÏÏÏÏÏÏÏ 1,218.5 1,282.5 1,496.1 1,564.7<br />
Available-for-sale ÏÏÏÏÏÏÏÏÏÏÏÏÏÏÏÏÏÏÏÏÏÏÏÏÏÏÏÏÏÏÏÏÏÏÏÏÏÏÏÏÏÏÏÏÏÏÏÏÏÏÏÏÏÏÏÏÏÏÏÏ 14,898.2 14,898.2 14,068.3 14,068.3<br />
Equity securities ÏÏÏÏÏÏÏÏÏÏÏÏÏÏÏÏÏÏÏÏÏÏÏÏÏÏÏÏÏÏÏÏÏÏÏÏÏÏÏÏÏÏÏÏÏÏÏÏÏÏÏÏÏÏÏÏÏÏÏÏÏÏ 710.4 710.4 830.6 830.6<br />
Real estate mortgages and notes receivable (Note 7) ÏÏÏÏÏÏÏÏÏÏÏÏÏÏÏÏÏÏÏÏÏÏÏÏÏÏÏÏÏÏÏÏÏ 97.7 89.0 89.7 81.9<br />
Liabilities<br />
Short term debt (Note 10)ÏÏÏÏÏÏÏÏÏÏÏÏÏÏÏÏÏÏÏÏÏÏÏÏÏÏÏÏÏÏÏÏÏÏÏÏÏÏÏÏÏÏÏÏÏÏÏÏÏÏÏÏÏÏÏ 199.0 199.0 Ì Ì<br />
Long term debt (Note 10) ÏÏÏÏÏÏÏÏÏÏÏÏÏÏÏÏÏÏÏÏÏÏÏÏÏÏÏÏÏÏÏÏÏÏÏÏÏÏÏÏÏÏÏÏÏÏÏÏÏÏÏÏÏÏÏ 1,351.0 1,387.1 753.8 745.8<br />
Credit derivatives (Note 16) ÏÏÏÏÏÏÏÏÏÏÏÏÏÏÏÏÏÏÏÏÏÏÏÏÏÏÏÏÏÏÏÏÏÏÏÏÏÏÏÏÏÏÏÏÏÏÏÏÏÏÏÏÏ 47.9 47.9 6.2 6.2<br />
69
(20) Comprehensive Income<br />
Comprehensive income is deÑned as all changes in shareholders' equity, except those arising from transactions with<br />
shareholders. Comprehensive income includes net income and other comprehensive income, which for the Corporation<br />
consists <strong>of</strong> changes in unrealized appreciation or depreciation <strong>of</strong> investments carried at market value and changes in<br />
foreign currency translation gains or losses.<br />
The components <strong>of</strong> other comprehensive income or loss were as follows:<br />
Years Ended December 31<br />
<strong>2001</strong> 2000 1999<br />
Income Income Income<br />
Before Tax Before Tax Before Tax<br />
Tax (Credit) Net Tax (Credit) Net Tax (Credit) Net<br />
(in millions)<br />
Unrealized holding gains (losses) arising<br />
during the year ÏÏÏÏÏÏÏÏÏÏÏÏÏÏÏÏÏÏÏÏÏ $ 50.8 $ 17.8 $ 33.0 $502.8 $136.6* $366.2 $(663.2) $(191.7)* $(471.5)<br />
Less: reclassiÑcation adjustment for<br />
realized gains included in net income ÏÏ .8 .3 .5 51.5 18.0 33.5 87.4 31.6 55.8<br />
Net unrealized gains (losses) recognized<br />
in other comprehensive income ÏÏÏÏÏÏÏ 50.0 17.5 32.5 451.3 118.6 332.7 (750.6) (223.3) (527.3)<br />
Foreign currency translation losses ÏÏÏÏÏÏ (6.7) (2.2) (4.5) (36.6) (12.9) (23.7) (14.2) (5.4) (8.8)<br />
Total other comprehensive<br />
income (loss) ÏÏÏÏÏÏÏÏÏÏÏÏÏÏÏÏÏÏÏÏ $ 43.3 $ 15.3 $ 28.0 $414.7 $105.7 $309.0 $(764.8) $(228.7) $(536.1)<br />
* ReÖects a decrease <strong>of</strong> $39.4 million and an increase <strong>of</strong> $39.4 million in a valuation allowance in 2000 and 1999, respectively.<br />
(21) Shareholders' Equity<br />
(a) The authorized but unissued preferred shares may be issued in one or more series and the shares <strong>of</strong> each series<br />
shall have such rights as Ñxed by the Board <strong>of</strong> Directors.<br />
(b) The activity <strong>of</strong> the Corporation's common stock was as follows:<br />
Years Ended December 31<br />
<strong>2001</strong> 2000 1999<br />
(number <strong>of</strong> shares)<br />
Common stock issued<br />
Balance, beginning <strong>of</strong> year ÏÏÏÏÏÏÏÏÏÏÏÏÏÏÏÏÏÏÏÏÏÏÏÏÏÏÏÏÏÏÏÏÏÏÏÏÏÏÏÏÏÏÏÏÏÏÏÏÏÏÏÏÏÏÏÏÏÏ 178,833,278 177,272,322 175,989,202<br />
Share activity related to acquisition <strong>of</strong> Executive Risk ÏÏÏÏÏÏÏÏÏÏÏÏÏÏÏÏÏÏÏÏÏÏÏÏÏÏÏÏÏÏÏÏÏÏ Ì Ì 641,474<br />
Share activity under option and incentive plansÏÏÏÏÏÏÏÏÏÏÏÏÏÏÏÏÏÏÏÏÏÏÏÏÏÏÏÏÏÏÏÏÏÏÏÏÏÏÏÏ 1,297,960 1,560,956 641,646<br />
Balance, end <strong>of</strong> year ÏÏÏÏÏÏÏÏÏÏÏÏÏÏÏÏÏÏÏÏÏÏÏÏÏÏÏÏÏÏÏÏÏÏÏÏÏÏÏÏÏÏÏÏÏÏÏÏÏÏÏÏÏÏÏÏÏÏÏ 180,131,238 178,833,278 177,272,322<br />
Treasury stock<br />
Balance, beginning <strong>of</strong> year ÏÏÏÏÏÏÏÏÏÏÏÏÏÏÏÏÏÏÏÏÏÏÏÏÏÏÏÏÏÏÏÏÏÏÏÏÏÏÏÏÏÏÏÏÏÏÏÏÏÏÏÏÏÏÏÏÏÏ 3,914,105 1,782,489 13,722,376<br />
Share activity related to acquisition <strong>of</strong> Executive Risk ÏÏÏÏÏÏÏÏÏÏÏÏÏÏÏÏÏÏÏÏÏÏÏÏÏÏÏÏÏÏÏÏÏÏ Ì Ì (13,651,028)<br />
Repurchase <strong>of</strong> shares ÏÏÏÏÏÏÏÏÏÏÏÏÏÏÏÏÏÏÏÏÏÏÏÏÏÏÏÏÏÏÏÏÏÏÏÏÏÏÏÏÏÏÏÏÏÏÏÏÏÏÏÏÏÏÏÏÏÏÏÏÏÏ 7,971,600 3,783,400 2,596,700<br />
Share activity under option and incentive plansÏÏÏÏÏÏÏÏÏÏÏÏÏÏÏÏÏÏÏÏÏÏÏÏÏÏÏÏÏÏÏÏÏÏÏÏÏÏÏÏ (1,825,848) (1,651,784) (885,559)<br />
Balance, end <strong>of</strong> year ÏÏÏÏÏÏÏÏÏÏÏÏÏÏÏÏÏÏÏÏÏÏÏÏÏÏÏÏÏÏÏÏÏÏÏÏÏÏÏÏÏÏÏÏÏÏÏÏÏÏÏÏÏÏÏÏÏÏÏ 10,059,857 3,914,105 1,782,489<br />
Common stock outstanding, end <strong>of</strong> yearÏÏÏÏÏÏÏÏÏÏÏÏÏÏÏÏÏÏÏÏÏÏÏÏÏÏÏÏÏÏÏÏÏÏÏÏÏÏÏÏÏÏ 170,071,381 174,919,173 175,489,833<br />
(c) The Corporation has a shareholders rights plan under which each shareholder has one right for each share <strong>of</strong><br />
common stock <strong>of</strong> the Corporation held. Each right entitles the holder to purchase from the Corporation one onethousandth<br />
<strong>of</strong> a share <strong>of</strong> Series B Participating Cumulative Preferred Stock at an exercise price <strong>of</strong> $240. The rights are<br />
attached to all outstanding shares <strong>of</strong> common stock and trade with the common stock until the rights become<br />
exercisable. The rights are subject to adjustment to prevent dilution <strong>of</strong> the interests represented by each right.<br />
The rights will become exercisable and will detach from the common stock ten days after a person or group either<br />
acquires 20% or more <strong>of</strong> the outstanding shares <strong>of</strong> the Corporation's common stock or announces a tender or exchange<br />
oÅer which, if consummated, would result in that person or group owning 20% or more <strong>of</strong> the outstanding shares <strong>of</strong> the<br />
Corporation's common stock.<br />
70
In the event that any person or group acquires 20% or more <strong>of</strong> the outstanding shares <strong>of</strong> the Corporation's<br />
common stock, each right will entitle the holder, other than such person or group, to purchase that number <strong>of</strong> shares <strong>of</strong><br />
the Corporation's common stock having a market value <strong>of</strong> two times the exercise price <strong>of</strong> the right. In the event that,<br />
following the acquisition <strong>of</strong> 20% or more <strong>of</strong> the Corporation's outstanding common stock by a person or group, the<br />
Corporation is acquired in a merger or other business combination transaction or 50% or more <strong>of</strong> the Corporation's<br />
assets or earning power is sold, each right will entitle the holder to purchase common stock <strong>of</strong> the acquiring company<br />
having a value equal to two times the exercise price <strong>of</strong> the right.<br />
At any time after any person or group acquires 20% or more <strong>of</strong> the Corporation's common stock, but before such<br />
person or group acquires 50% or more <strong>of</strong> such stock, the Corporation may exchange all or part <strong>of</strong> the rights, other than<br />
the rights owned by such person or group, for shares <strong>of</strong> the Corporation's common stock at an exchange ratio <strong>of</strong> one<br />
share <strong>of</strong> common stock per right.<br />
The rights do not have the right to vote or to receive dividends. The rights may be redeemed in whole, but not in<br />
part, at a price <strong>of</strong> $.01 per right by the Corporation at any time until the tenth day after the acquisition <strong>of</strong> 20% or more<br />
<strong>of</strong> the Corporation's outstanding common stock by a person or group. The rights will expire at the close <strong>of</strong> business on<br />
March 12, 2009, unless previously exchanged or redeemed by the Corporation.<br />
(d) The Corporation's insurance subsidiaries are required to Ñle annual statements with insurance regulatory<br />
authorities prepared on an accounting basis prescribed or permitted by such authorities (statutory basis). For such<br />
subsidiaries, generally accepted accounting principles (GAAP) diÅer in certain respects from statutory accounting<br />
practices. EÅective January 1, <strong>2001</strong>, the Corporation's U.S. domiciled insurance subsidiaries adopted the National<br />
Association <strong>of</strong> <strong>Insurance</strong> Commissioners' CodiÑcation <strong>of</strong> Statutory Accounting Principles (CodiÑcation). CodiÑcation<br />
is intended to standardize regulatory reporting to state insurance departments. The adoption <strong>of</strong> CodiÑcation increased<br />
the statutory basis policyholders' surplus <strong>of</strong> the Corporation's insurance subsidiaries at December 31, <strong>2001</strong> by<br />
approximately $295 million.<br />
A comparison <strong>of</strong> shareholders' equity on a GAAP basis and policyholders' surplus on a statutory basis is as follows:<br />
December 31<br />
<strong>2001</strong> 2000<br />
GAAP Statutory GAAP Statutory<br />
(in millions)<br />
Property and casualty insurance subsidiaries ÏÏÏÏÏÏÏÏÏÏÏÏÏÏÏÏÏÏÏÏÏÏÏÏÏÏÏÏÏÏÏÏÏÏÏÏÏÏÏ $6,566.6 $3,814.8 $5,974.6 $3,483.7<br />
Corporate and other ÏÏÏÏÏÏÏÏÏÏÏÏÏÏÏÏÏÏÏÏÏÏÏÏÏÏÏÏÏÏÏÏÏÏÏÏÏÏÏÏÏÏÏÏÏÏÏÏÏÏÏÏÏÏÏÏÏÏÏ (41.3) 1,007.1<br />
$6,525.3 $6,981.7<br />
A comparison <strong>of</strong> GAAP and statutory net income (loss) is as follows:<br />
Years Ended December 31<br />
<strong>2001</strong> 2000 1999<br />
GAAP Statutory GAAP Statutory GAAP Statutory<br />
(in millions)<br />
Property and casualty insurance subsidiaries ÏÏÏÏÏÏÏÏÏÏÏÏÏÏÏÏÏÏ $ 95.0 $(239.2) $711.3 $622.2 $610.6 $609.3<br />
Corporate and other ÏÏÏÏÏÏÏÏÏÏÏÏÏÏÏÏÏÏÏÏÏÏÏÏÏÏÏÏÏÏÏÏÏÏÏÏÏÏ 16.5 3.3 10.5<br />
$111.5 $714.6 $621.1<br />
(e) The Corporation's ability to continue to pay dividends to shareholders and interest on debt obligations relies<br />
on the availability <strong>of</strong> liquid assets in the Corporation, which is dependent on the dividend paying ability <strong>of</strong> its property<br />
and casualty insurance subsidiaries. Various state insurance laws restrict the Corporation's property and casualty<br />
insurance subsidiaries as to the amount <strong>of</strong> dividends they may pay to the Corporation without the prior approval <strong>of</strong><br />
regulatory authorities. The restrictions are generally based on net income and on certain levels <strong>of</strong> policyholders' surplus<br />
as determined in accordance with statutory accounting practices. Dividends in excess <strong>of</strong> such thresholds are considered<br />
""extraordinary'' and require prior regulatory approval. During <strong>2001</strong>, these subsidiaries paid cash dividends to the<br />
Corporation totaling $240 million.<br />
The maximum dividend distribution that may be made by the property and casualty insurance subsidiaries to the<br />
Corporation during 2002 without prior approval is approximately $350 million.<br />
71
REPORT OF INDEPENDENT AUDITORS<br />
ERNST & YOUNG LLP<br />
787 Seventh Avenue<br />
New York, New York 10019<br />
The Board <strong>of</strong> Directors and Shareholders<br />
The <strong>Chubb</strong> Corporation<br />
We have audited the accompanying consolidated balance sheets <strong>of</strong> The <strong>Chubb</strong> Corporation as <strong>of</strong> December 31,<br />
<strong>2001</strong> and 2000, and the related consolidated statements <strong>of</strong> income, shareholders' equity, cash Öows and comprehensive<br />
income for each <strong>of</strong> the three years in the period ended December 31, <strong>2001</strong>. These Ñnancial statements are the<br />
responsibility <strong>of</strong> the Corporation's management. Our responsibility is to express an opinion on these Ñnancial<br />
statements based on our audits.<br />
We conducted our audits in accordance with auditing standards generally accepted in the United States. Those<br />
standards require that we plan and perform the audit to obtain reasonable assurance about whether the Ñnancial<br />
statements are free <strong>of</strong> material misstatement. An audit includes examining, on a test basis, evidence supporting the<br />
amounts and disclosures in the Ñnancial statements. An audit also includes assessing the accounting principles used and<br />
signiÑcant estimates made by management, as well as evaluating the overall Ñnancial statement presentation. We believe<br />
that our audits provide a reasonable basis for our opinion.<br />
In our opinion, the Ñnancial statements referred to above present fairly, in all material respects, the consolidated<br />
Ñnancial position <strong>of</strong> The <strong>Chubb</strong> Corporation at December 31, <strong>2001</strong> and 2000 and the consolidated results <strong>of</strong> its<br />
operations and its cash Öows for each <strong>of</strong> the three years in the period ended December 31, <strong>2001</strong> in conformity with<br />
accounting principles generally accepted in the United States.<br />
February 28, 2002<br />
72
QUARTERLY FINANCIAL DATA<br />
Summarized unaudited quarterly Ñnancial data for <strong>2001</strong> and 2000 are shown below. In management's opinion, the<br />
interim Ñnancial data contain all adjustments, consisting <strong>of</strong> normal recurring items, necessary to present fairly the results<br />
<strong>of</strong> operations for the interim periods.<br />
Three Months Ended<br />
March 31 June 30 September 30 December 31<br />
<strong>2001</strong> 2000 <strong>2001</strong> 2000 <strong>2001</strong>(a) 2000 <strong>2001</strong>(b) 2000<br />
(in millions except for per share amounts)<br />
RevenuesÏÏÏÏÏÏÏÏÏÏÏÏÏÏÏÏÏÏÏÏÏÏÏÏÏÏÏÏ $1,891.5 $1,767.0 $1,914.5 $1,774.0 $1,956.3 $1,858.5 $1,991.7 $1,852.0<br />
Claims and expenses ÏÏÏÏÏÏÏÏÏÏÏÏÏÏÏÏÏÏ 1,682.1 1,592.9 1,748.3 1,549.8 2,383.7 1,601.4 2,005.9 1,656.4<br />
Federal and foreign income tax (credit) 34.4 20.4 19.4 39.6 (188.4) 49.2 (42.9) 27.2<br />
Net income (loss) ÏÏÏÏÏÏÏÏÏÏÏÏÏÏÏÏ $ 175.0 $ 153.7 $ 146.8 $ 184.6 $ (239.0) $ 207.9 $ 28.7 $ 168.4<br />
Basic earnings (loss) per share ÏÏÏÏÏÏÏÏÏ $ 1.00 $ .88 $ .84 $ 1.05 $ (1.40) $ 1.20 $ .17 $ .97<br />
Diluted earnings (loss) per share ÏÏÏÏÏÏÏ $ .97 $ .87 $ .83 $ 1.02 $ (1.40) $ 1.17 $ .16 $ .95<br />
Underwriting ratios<br />
Losses to premiums earned ÏÏÏÏÏÏÏÏÏÏ 67.0% 69.2% 70.0% 65.9% 105.7% 66.9% 79.9% 67.9%<br />
Expenses to premiums writtenÏÏÏÏÏÏÏÏ 32.9 32.7 33.5 32.7 32.1 32.5 32.0 33.8<br />
Combined ÏÏÏÏÏÏÏÏÏÏÏÏÏÏÏÏÏÏÏÏÏÏÏ 99.9% 101.9% 103.5% 98.6% 137.8% 99.4% 111.9% 101.7%<br />
(a) In the third quarter <strong>of</strong> <strong>2001</strong>, revenues included reinstatement premiums <strong>of</strong> $30.0 million and claims and expenses included costs <strong>of</strong><br />
$675.0 million related to the September 11 attack. Net income for the quarter was reduced by $420.0 million or $2.46 per basic and diluted share<br />
for the after-tax eÅect <strong>of</strong> the net costs. Excluding the impact <strong>of</strong> the September 11 attack, the losses to premiums earned ratio was 67.2%, the<br />
expenses to premiums written ratio was 32.7% and the combined ratio was 99.9%.<br />
(b) In the fourth quarter <strong>of</strong> <strong>2001</strong>, claims and expenses included net surety bond losses <strong>of</strong> $220.0 million related to the bankruptcy <strong>of</strong> Enron Corp.,<br />
resulting in an after-tax charge to net income <strong>of</strong> $143.0 million or $0.83 per diluted share ($0.85 per basic share). Excluding the eÅect <strong>of</strong> the<br />
Enron surety losses, the losses to premiums earned ratio for the quarter was 67.0% and the combined ratio was 99.0%.<br />
COMMON STOCK DATA<br />
The common stock <strong>of</strong> the Corporation is listed and principally traded on the New York Stock Exchange (NYSE).<br />
The following are the high and low closing sale prices as reported on the NYSE Composite Tape and the quarterly<br />
dividends declared for each quarter <strong>of</strong> <strong>2001</strong> and 2000.<br />
<strong>2001</strong><br />
First Second Third Fourth<br />
Quarter Quarter Quarter Quarter<br />
Common stock prices<br />
High ÏÏÏÏÏÏÏÏÏÏÏÏÏÏÏÏÏÏÏÏÏÏÏÏÏÏÏÏÏÏÏÏÏÏÏÏÏÏÏÏÏÏÏÏÏÏÏÏÏÏÏÏÏÏÏÏÏÏÏÏÏÏÏÏÏÏ $83.44 $79.00 $76.89 $77.66<br />
LowÏÏÏÏÏÏÏÏÏÏÏÏÏÏÏÏÏÏÏÏÏÏÏÏÏÏÏÏÏÏÏÏÏÏÏÏÏÏÏÏÏÏÏÏÏÏÏÏÏÏÏÏÏÏÏÏÏÏÏÏÏÏÏÏÏÏÏ 65.27 64.32 58.59 66.02<br />
Dividends declared ÏÏÏÏÏÏÏÏÏÏÏÏÏÏÏÏÏÏÏÏÏÏÏÏÏÏÏÏÏÏÏÏÏÏÏÏÏÏÏÏÏÏÏÏÏÏÏÏÏÏÏÏÏÏÏÏÏÏ .34 .34 .34 .34<br />
2000<br />
First Second Third Fourth<br />
Quarter Quarter Quarter Quarter<br />
Common stock prices<br />
High ÏÏÏÏÏÏÏÏÏÏÏÏÏÏÏÏÏÏÏÏÏÏÏÏÏÏÏÏÏÏÏÏÏÏÏÏÏÏÏÏÏÏÏÏÏÏÏÏÏÏÏÏÏÏÏÏÏÏÏÏÏÏÏÏÏÏ $67.56 $72.38 $82.00 $90.00<br />
LowÏÏÏÏÏÏÏÏÏÏÏÏÏÏÏÏÏÏÏÏÏÏÏÏÏÏÏÏÏÏÏÏÏÏÏÏÏÏÏÏÏÏÏÏÏÏÏÏÏÏÏÏÏÏÏÏÏÏÏÏÏÏÏÏÏÏÏ 44.75 59.63 62.75 72.25<br />
Dividends declared ÏÏÏÏÏÏÏÏÏÏÏÏÏÏÏÏÏÏÏÏÏÏÏÏÏÏÏÏÏÏÏÏÏÏÏÏÏÏÏÏÏÏÏÏÏÏÏÏÏÏÏÏÏÏÏÏÏÏ .33 .33 .33 .33<br />
At March 11, 2002, there were approximately 6,300 common shareholders <strong>of</strong> record.<br />
73
CHUBB & SON, a division <strong>of</strong> Federal <strong>Insurance</strong> Company<br />
Managing Directors<br />
JOHN L. ANGERAMI WILLIAM J. FALSONE WESTON M. HICKS DONALD E. MERGEN DINO E. ROBUSTO<br />
JOEL D. ARONCHICK GEORGE R. FAY JAYNE E. HILL ELLEN J. MOORE PAUL F. ROMANO<br />
RONALD G. BENNETT EDWARD J. FERNANDEZ DORIS M. JOHNSON HAROLD L. MORRISON, JR. MARIO D. ROSSI<br />
JON C. BIDWELL DAVID S. FOWLER RALPH E. JONES, III THOMAS F. MOTAMED PARKER W. RUSH<br />
JOANNE L. BOBER BRICE R. GAMBER JOHN F. KEARNEY D. UDO NIXDORF TIMOTHY J. SZERLONG<br />
JAMES P. BRONNER GREGORY GEORGIEFF JOHN F. KIRBY, JR. JOSEPH C. O'DONNELL WILLIAM J. TABINSKY<br />
ALAN C. BROWN CHRIS J. GILES PAUL J. KRUMP DEAN R. O'HARE ROBERT W. TESCHKE<br />
MALCOLM B. BURTON JOHN H. GILLESPIE CHARLES M. LUCHS MICHAEL O'REILLY JANICE M. TOMLINSON<br />
JOHN F. CASELLA BAXTER W. GRAHAM ROBERT M. LYNYAK RICHARD H. ORT GARY TRUST<br />
TERRENCE W. CAVANAUGH MARK E. GREENBERG MICHAEL J. MARCHIO GARY C. PETROSINO WILLIAM P. TULLY<br />
ROBERT C. COX DONNA M. GRIFFIN GEORGE F. MARTS STEVEN R. POZZI BERT VAN DER VOSSEN<br />
JIMMY R. DEADERICK WALTER P. GUZZO CHARLES G. MCCAIG MARJORIE D. RAINES THOMAS T. WARDEN<br />
JOHN J. DEGNAN DAVID G. HARTMAN ANDREW A. MCELWEE, JR.<br />
OÇcers<br />
Chairman HAROLD L. MORRISON, JR. RICHARD W. BARNETT STEVEN D. HERNANDEZ RICHARD P. MUNSON<br />
DEAN R. O'HARE FRANCES D. O'BRIEN WILLIAM E. BARR, JR. JOHN HERNANDEZ KEVIN M. NEARY<br />
JOSEPH C. O'DONNELL WAYNE A. BAYER FREDERICK P. HESSENTHALER LYNN S. NEVILLE<br />
President<br />
ROBERT A. PATULO JOHN L. BAYLEY MAUREEN Y. HIGDON CATHERINE J. NIKODEN<br />
JOHN J. DEGNAN<br />
JOSEPH V. PERNO ARTHUR J. BEAVER MICHAEL A. HINOJOSA BARBARA NISIVOCCIA<br />
Executive Vice Presidents<br />
GARY C. PETROSINO MARK L. BERTHIAUME JANE L. HODGSON DOUGLAS A. NORDSTROM<br />
GEORGE R. FAY<br />
PATRICK A. PISANO STANLEY V. BLOOM HENRY B. HOFFER RANDALL G. OATES<br />
DAVID S. FOWLER<br />
STEVEN R. POZZI PETER G. BOCCHER JEFFREY HOFFMAN RAYMOND C. O'BYRNE<br />
WESTON M. HICKS<br />
DANIEL R. REID CHARLES A. BORDA PAMELA D. HOFFMAN MOSES I. OJEISEKHOBA<br />
RALPH E. JONES, III<br />
DINO E. ROBUSTO THOMAS S. BOTSFORD KEVIN G. HOGAN KELLY P. O'LEARY<br />
PAUL J. KRUMP<br />
PAUL F. ROMANO THOMAS B. BREINER KRISTEN A. HOLDEN MICHAEL W. O'MALLEY<br />
CHARLES M. LUCHS<br />
EVAN J. ROSENBERG PATRICIA A. BUBB ROBERT S. HOLLEY, JR. BRIDGET ONDA<br />
THOMAS F. MOTAMED<br />
LEE M. ROTH TIMOTHY D. BUCKLEY MICHAEL S. HOWEY MICHAEL D. OPPE<br />
MICHAEL O'REILLY<br />
PARKER W. RUSH GERARD M. BUTLER THOMAS B. HOWLAND KATHLEEN A. ORENCZAK<br />
RICHARD H. ORT<br />
TIMOTHY M. SHANNAHAN PAUL J. BUTLER SUSAN R. HUNTINGTON ROCCO C. ORLANDO<br />
RICHARD I. SIMON ROBERT E. CALLARD GERALD A. IPPOLITO JOAN L. O'SULLIVAN<br />
Senior Vice Presidents PATRICIA SKOLD MICHAEL J. CASELLA ROBERT A. IVEY, III DANIEL A. PACICCO<br />
JOHN L. ANGERAMI<br />
GAIL W. SOJA JOHN C. CAVANAUGH PATRICIA L. JACKSON-HALL DEBRA A. PALERMINO<br />
JOEL D. ARONCHICK<br />
RICHARD P. SOJA RICHARD A. CIULLO STEVEN JAKUBOWSKI JOSEPH A. PALLADINO<br />
WILLIAM D. ARRIGHI<br />
EDWARD G. SPELL LAURA B. CLARK MARK JAMES KRISTEN PARK<br />
JON C. BIDWELL<br />
JOHN M. SWORDS FRANK L. CLAYBROOKS JOHN M. JEFFREY NANCY D. PATE-NELSON<br />
JULIA T. BOLAND<br />
TIMOTHY J. SZERLONG THEODORE R. CLAYTON COLLEEN A. JENNINGS AUDREY L. PETERSEN<br />
GEORGE F. BREUER<br />
WILLIAM J. TABINSKY WILLIAM T. CONWAY BRADFORD W. JONES JANE M. PETERSON<br />
JAMES P. BRONNER<br />
CLIFTON E. THOMAS JOHN P. COONAN JOHN J. JUAREZ, JR. JEFFREY PETERSON<br />
DEBORAH L. BRONSON<br />
BRUCE W. THORNE TIMOTHY J. COVELLO DAVID L. KEENAN IRENE D. PETILLO<br />
DAVID J. BROSNAN<br />
JANICE M. TOMLINSON EDWIN E. CRETER DEBRA ANN KEISER DONALD W. PETRIN<br />
ALAN C. BROWN<br />
ROGER D. TRACHSEL WILLIAM S. CROWLEY TIMOTHY J. KELLY MARYBETH PITTINGER<br />
R. JEFFERY BROWN<br />
GARY TRUST DOUGLAS J. DALRYMPLE JOHN J. KENNEDY JAMES H. PROFERES<br />
MALCOLM B. BURTON<br />
PETER J. TUCKER CHRISTINA A. DART THOMAS R. KERR PAUL T. PRUETT<br />
ANDREW C. CARNASE<br />
WILLIAM P. TULLY KENNETH L. DAVIDSON, JR. PATRICIA J. KEY ERIC PRUSS<br />
JOHN F. CASELLA<br />
RICHARD V. WERNER MARK W. DAVIS ELSBETH KIRKPATRICK JOSEPH W. PTASZYNSKI<br />
TERRENCE W. CAVANAUGH<br />
JAMES L. WEST BRUCE V. DAY MARGARET A. KLOSE WILLIAM J. PULEO<br />
MARIO J. CHIAPPETTI<br />
CAROL A. DEFRANCE JAMES P. KNIGHT DOUGLAS J. PURCELL<br />
Senior Vice President and<br />
ROBERT C. COX<br />
GARY R. DELONG CILLE KOCH EDWARD J. RADZINSKI<br />
GARDNER R. CUNNINGHAM, JR. Chief Accounting OÇcer<br />
PHILLIP C. DEMMEL JOSEPH M. KORKUCH MARJORIE D. RAINES<br />
ROBERT F. DADD HENRY B. SCHRAM<br />
JOHN M. DENEGRE LINDA A. KORTLANDT RICHARD D. REED<br />
D. SCOTT DALTON<br />
Senior Vice President and<br />
SUSAN DEVRIES AMELANG KATHLEEN W. KOUFACOS RICHARD P. REED<br />
JAMES A. DARLING<br />
Chief Actuary<br />
DEBRA A. DIKEN ERIC T. KRANTZ JOSEPH A. RICCIO<br />
JIMMY R. DEADERICK<br />
DAVID G. HARTMAN<br />
TIMOTHY R. DIVELEY ULLI KRELL JENIFER L. RINEHART<br />
CHRISTOPHE N. DISIPIO<br />
MATTHEW P. DOLAN JOHN B. KRISTIANSEN CHRISTOPH C. RITTERSON<br />
ALAN G. DRISCOLL Senior Vice Presidents and ROBERT J. DONNELLY ANDREW N. LAGRAVENESE ERIC M. RIVERA<br />
KATHLEEN S. ELLIS Actuaries ALFRED C. DROWNE JAMES V. LALOR FRANK E. ROBERTSON<br />
TIMOTHY T. ELLIS JAMES E. BILLER<br />
KATHLEEN M. DUBIA MARY M. LEAHY MARK J. ROBINSON<br />
WILLIAM J. FALSONE ADRIENNE B. KANE<br />
MARK D. DUGLE LEOPOLD H. LEMMELIN, II DAVID C. ROBINSON<br />
EDWARD J. FERNANDEZ MICHAEL F. MCMANUS<br />
LESLIE L. EDSALL ROBERT A. LIPPERT EDWARD F. ROCHFORD<br />
SEAN M. FITZPATRICK<br />
Senior Vice President and<br />
JAMES P. EKDAHL FREDERICK W. LOBDELL MARYLOUS RODDEN<br />
THOMAS V. FITZPATRICK<br />
RICK J. ELDRIDGE DONNA M. LOMBARDI BEATRIZ RODRIGUEZ<br />
General Counsel<br />
BRICE R. GAMBER<br />
JOANNE L. BOBER<br />
NILO S. ENRIQUEZ KATHLEEN K. LUBIN JAMES ROMANELLI<br />
JAMES E. GARDNER<br />
VICTORIA S. ESPOSITO MATTHEW E. LUBIN MARY E. RUSSO<br />
GREGORY GEORGIEFF Senior Vice President and TIMOTHY J. FARR BEVERLY J. LUEHS JEFFREY W. RYAN<br />
GERALD T. GIESLER Assistant General Counsel MICHELE N. FINCHER AMELIA C. LYNCH RUTH M. RYAN<br />
CHRIS J. GILES WILLIAM J. MURRAY ADAM FINKLE ROBERT LYNCH CELIA SANTANA<br />
JOHN H. GILLESPIE<br />
Senior Vice President and<br />
PHILIP W. FISCUS RICHARD C. MAHLE ROBERT F. SANTORO<br />
BAXTER W. GRAHAM<br />
Secretary<br />
PHILIP G. FOLZ HELEN A. MAKSYMIUK MARY A. SCELBA<br />
LAWRENCE GRANT<br />
HENRY G. GULICK<br />
PATRICK G. FOUCHE MICHAEL J. MALONEY ERIC D. SCHALL<br />
MARK E. GREENBERG<br />
PAUL W. FRANKLIN MICHAEL L. MARINARO ANTHONY C. SCHIAVONE<br />
DONNA M. GRIFFIN Senior Vice President and JOHN B. FUOSS KATHLEEN P. MARVEL BRAD S. SCHRUM<br />
CHARLES S. GUNTER Treasurer FREDERICK W. GAERTNER MELISSA S. MASLES ROBERT D. SCHUCK<br />
WALTER P. GUZZO PHILIP J. SEMPIER SUSAN A. GAFFNEY BRIAN MATES STEVEN SCHULMAN<br />
JAYNE E. HILL<br />
ANTHONY S. GALBAN RICHARD D. MAUK DOREEN SEMPIER<br />
Vice Presidents<br />
KIM D. HOGREFE<br />
THOMAS J. GANTER FRANCES K. MCGUINN ASHWIN K. SHAH<br />
WILLIAM A. ACCORDINO<br />
PATRICIA A. HURLEY<br />
WALLACE W. GARDNER, JR. DAVID P. MCKEON MARY T. SHERIDAN<br />
VINCENT R. AGNEW<br />
JAMES S. HYATT<br />
MICHAEL A. GARGUILO ELIZABETH C. MCCARTHY ANTHONY W. SHINE<br />
VALERIE A. AGUIRRE<br />
DORIS M. JOHNSON<br />
DONALD M. GARVEY, JR. JAMES C. MCCARTHY DONALD L. SIEGRIST, JR.<br />
PETER L. AITKEN<br />
JOHN F. KEARNEY T. BRIAN GAUEN LISA M. MCGEE MARY N. SKLARSKI<br />
JAMES D. ALBERTSON<br />
JOHN F. KIRBY, JR. NED I. GERSTMAN DENISE B. MELICK MICHAEL A. SLOR<br />
JAMES E. ALTMAN<br />
MARK P. KORSGAARD<br />
JOSEPHINE A. GOODWIN ROBERT MEOLA JOHN P. SMITH<br />
NAVEEN ANAND<br />
KATHLEEN S. LANGNER<br />
JEFFREY S. GRANGE JOSEPH G. MERTEN KEVIN G. SMITH<br />
JOHN C. ANDERSON<br />
DONALD B. LAWSON<br />
PERRY S. GRANOF SCOTT D. MEYERS VERONICA SOMARRIBA<br />
MARY S. AQUINO<br />
KEVIN J. LEIDWINGER<br />
EDWARD J. GUMBRECHT MICHELLE D. MIDDLETON VICTOR J. SORDILLO<br />
MICHAEL ARCURI<br />
PAUL L. LEWIS<br />
MARC R. HACHEY ROBERT P. MIDWOOD SCOTT R. SPENCER<br />
RONALD J. ARIGO<br />
ROBERT W. LINGEMAN<br />
NANCY HALPIN-BIRKNER MARK A. MILEUSNIC PAUL M. STACHURA<br />
BRENDAN ARNOTT<br />
ROBERT M. LYNYAK<br />
CHARLES F. HAMANN JOHN J. MIZZI MICHAEL E. STAPLETON<br />
MARY ANN AVNET<br />
GARY S. MAIER<br />
ROBERT A. HAMBURGER JOHN MOELLER JOSHUA O. STEIN<br />
DOROTHY M. BADGER<br />
MICHAEL J. MARCHIO<br />
JAMES R. HAMILTON TERRY D. MONTGOMERY KENNETH J. STEPHENS<br />
KIRK O. BAILEY<br />
GEORGE F. MARTS<br />
LAWRENCE T. HANNON, JR. GREGORY D. MOORE VICTOR C. STEWMAN<br />
WALTER BAKER, JR.<br />
ROBERT A. MARZOCCHI<br />
JAMES HASLEY FRANK MORELLI DORIT D. STRAUS<br />
J. MICHAEL BALDWIN<br />
CHARLES G. MCCAIG<br />
GARY L. HEARD PAUL N. MORRISSETTE DIANE T. STREHLE<br />
GREGORY P. BARABAS<br />
THOMAS J. MCCORMACK<br />
MICHAEL W. HEEMBROCK MATTHEW A. MUELLER JOEL M. TEALER<br />
DONALD E. BARB<br />
DONALD E. MERGEN<br />
FRANCES M. BARFOOT<br />
ELLEN J. MOORE<br />
74
CHUBB & SON, a division <strong>of</strong> Federal <strong>Insurance</strong> Company (continued)<br />
OÇcers<br />
JOSEPH R. TERESI EMILY J. URBAN RYAN L. WATSON GLENN J. WRIGHT Vice President and<br />
ROBERT W. TESCHKE LOUISE E. VALLEE CAROLE J. WEBER THOMAS WRIGHT Counsel<br />
PETER J. THOMPSON RUSSELL A. VAN HOUTEN ERROL L. WHISLER STEPHEN J. ZAPPAS LOUIS NAGY<br />
KATHLEEN M. TIERNEY EDGARDO VAN RHYN W. JAMES WHITE, JR. ANN H. ZAPRAZNY<br />
Vice Presidents and<br />
EDWARD TIRPAK PETER H. VOGT, II JUDITH A. WIELAND<br />
Vice Presidents and<br />
Associate Counsels<br />
RICHARD E. TOWLE RICHARD VREELAND ROBERT C. WIGGER<br />
Actuaries<br />
PETER K. BARBER<br />
JOEL S. TOWNSEND JILL E. WADLUND DAVID B. WILLIAMS<br />
W. BRIAN BARNES MATTHEW CAMPBELL<br />
WALTER R. TRIPPE CHARLES J. WALKONIS G. EUGENE WILLIAMS<br />
PETER V. BURCHETT<br />
SUSAN J. MURR<br />
WILLIAM C. TURNBULL, JR. SUSAN C. WALTERMIRE JEREMY N.R. WINTER<br />
LINDA M. GROH<br />
STEPHEN P. TASY<br />
MICHELE E. TWYMAN CHRISTINE WARTELLA SUZANNE L. WITT<br />
KEVIN A. KESBY<br />
LINDA F. WALKER<br />
RICHARD L. UGHETTA WALTER B. WASHINGTON ALAN J. WONSOWSKI<br />
KEITH R. SPALDING<br />
PAULA C. UMREIKO EVAN P. WASSERMAN GARY C. WOODRING<br />
MAUREEN B. WATERBURY<br />
FEDERAL INSURANCE COMPANY<br />
OÇcers<br />
Chairman and President MICHAEL O'REILLY JACKIE CHANG AMELIA C. LYNCH STEPHEN P. WARREN<br />
DEAN R. O'HARE GARY C. PETROSINO BAY HON CHIN ROBERT A. MARZOCCHI DOREEN YIP<br />
MICHAEL COLLINS<br />
MELISSA S. MASLES<br />
Senior Vice Presidents Senior Vice President Vice President and<br />
ANDRE DALLAIRE<br />
DAVID P. MCKEON<br />
BRENDON R. ALLAN and General Counsel Actuary<br />
RICK J. ELDRIDGE<br />
MARK A. MILEUSNIC<br />
ROGER C.P. BROOKHOUSE JOANNE L. BOBER DAVID G. HARTMAN<br />
BRANT W. FREE, JR.<br />
MARK B. MITCHELL<br />
JOHN J. DEGNAN<br />
Vice Presidents<br />
BRICE R. GAMBER<br />
GLENN A. MONTGOMERY Vice President and<br />
IAN R. FARAGHER<br />
STEPHEN BLASINA<br />
LAWRENCE GRANT<br />
DOUGLAS J. PURCELL<br />
DAVID S. FOWLER<br />
Secretary<br />
ROHAN BORRELL<br />
RICK A. GRAY<br />
MARJORIE D. RAINES<br />
CHRIS J. GILES<br />
HENRY G. GULICK<br />
THOMAS B. BREINER<br />
MICHAEL S. HOWEY<br />
FRANK E. ROBERTSON<br />
CHRISTOPHER HAMILTON<br />
GEORGE X.Z. HUANG<br />
PARKER W. RUSH<br />
Vice President and<br />
MALCOLM B. BURTON<br />
IAN LANCASTER<br />
ROBERT E. CALLARD<br />
JAMES E. KERNS<br />
HENRY B. SCHRAM<br />
Treasurer<br />
MARK T. LINGAFELTER<br />
MICHAEL J. CASELLA<br />
IRENE LIANG<br />
STEPHEN P. TASY<br />
PHILIP J. SEMPIER<br />
DONALD E. MERGEN<br />
JANICE M. TOMLINSON<br />
CHUBB INSURANCE COMPANY OF CANADA<br />
Directors<br />
DIANE P. BAXTER BARRY T. GRANT D. UDO NIXDORF PETER B. SMITH JANICE M. TOMLINSON<br />
DENIS C. BROWN ANDREW A. MCELWEE, JR. DEAN R. O'HARE CRAWFORD W. SPRATT<br />
OÇcers<br />
Chairman, President and Chief D. UDO NIXDORF Vice Presidents RONEE GERMAN FRED SHURBAJI<br />
Executive OÇcer RICHARD F. NOBLES JEAN BERTRAND SUSAN MACEACHERN ANDREW STEEN<br />
JANICE M. TOMLINSON SUSAN VELLA BARRY BLACKBURN MARY MALONEY THOMAS T. WARDEN<br />
LEEANN BOYD<br />
MICHAEL J. ORRELL<br />
Senior Vice Presidents Senior Vice President and NICOLE BROUILLARD<br />
GARTH PEPPER<br />
Secretary<br />
DIANE P. BAXTER Chief Financial OÇcer GIOVANNI DAMIANO<br />
DAVID PRICE<br />
CRAWFORD W. SPRATT<br />
JAMES V. NEWMAN GEOFFREY D. SHIELDS PATRICIA EWEN SAMI SAYEGH<br />
CHUBB INSURANCE COMPANY OF EUROPE, S.A.<br />
Directors<br />
JOEL D. ARONCHICK GREGORY GEORGIEFF DEAN R. O'HARE KEVIN O'SHIEL SIR DAVID G. SCHOLEY, CBE<br />
CECILE COUNE<br />
ANDREW A. MCELWEE, JR.<br />
OÇcers<br />
President and Chief Executive DAVID STEVENS KENNETH CHUNG HORST IHLAS MERVYN SKEET<br />
OÇcer BERT VAN DER VOSSEN BERNARD CLAUDINON HELEN KOUSTAS CHRIS TAIT<br />
JOEL D. ARONCHICK PAUL R. VAN PELT BIJAN DAFTARI ANDREAS LUBERICHS PETER THOMAS<br />
THOMAS T. WARDEN THIERRY DAUCOURT DANIEL MAURER ROBERT TROTT<br />
Executive Vice President CHRISTIAN DE HERICOURT ANDREW MCKEE HELEN TURNER<br />
GREGORY GEORGIEFF Senior Vice President and PHILIPPE DEVERDUN MIGUEL MOLINA ALBERT VAN KERCKHOVEN<br />
Chief Financial OÇcer JONATHAN DYE TOM NEWARK SIMON WARNER<br />
Senior Vice Presidents KEVIN O'SHIEL HALCYON ELLIS CLEMENS NIEUWENSTEIN WOLFGANG WEIS<br />
MICHAEL J. CASELLA<br />
JOHANNES ETTEN RENE NIEUWLAND JEREMY N.R. WINTER<br />
PAUL CHAPMAN<br />
Vice Presidents<br />
RICHARD EVELEIGH JONATHAN PHILLIPS SIMON WOOD<br />
CECILE COUNE<br />
DIDIER ARMINJON<br />
ANDRE FORD<br />
HUGH POLLINGTON<br />
ROBERT F. DADD JAN AUERBACH<br />
BARRY GOLDSMITH<br />
JALIL REHMAN<br />
Vice President and Actuary<br />
CHRIS J. GILES LOTFI BACCOUCHE<br />
BOGISLAV GRAF VON SCHWERIN DAVID ROBINSON<br />
COLIN CROUCH<br />
JEREMIAH M. HOURIHAN<br />
RON BAKKER<br />
CAROLYN HAMILTON<br />
JOHN ROOME<br />
CARLOS MERINO JANIC BAUDRIHAYE Vice President, General Counsel<br />
ERIC HASSEL<br />
HENRIK SCHWIENING<br />
KAREN MORRIS BERNHARD BUDDE and Secretary<br />
ROBERT HAURY<br />
ALAN SHEIL<br />
MOSES I. OJEISEKHOBA BAUDOUIN CAILLEMER RANALD T.I. MUNRO<br />
ISABELLE HILAIRE<br />
ERIC SIDGWICK<br />
JOHN REDMOND<br />
CLIVE CHIPPERFIELD<br />
JOHN SIMS<br />
75
THE CHUBB CORPORATION<br />
Directors ZO E BAIRD DEAN R. O'HARE<br />
President<br />
Chairman and Chief Executive OÇcer<br />
The Markle Foundation<br />
<strong>of</strong> the Corporation<br />
JOHN C. BECK<br />
Member<br />
Beck, Mack & Oliver LLC<br />
SHEILA P. BURKE<br />
Under Secretary for American Museums and<br />
National Programs<br />
Smithsonian Institution<br />
JAMES I. CASH, JR.<br />
Pr<strong>of</strong>essor<br />
Harvard Graduate School <strong>of</strong><br />
Business Administration<br />
PERCY CHUBB, III<br />
Former Vice Chairman <strong>of</strong> the Corporation<br />
JOEL J. COHEN<br />
Retired Managing Director<br />
Donaldson, Lufkin & Jenrette Securities Corp.<br />
JAMES M. CORNELIUS<br />
Chairman<br />
Guidant Corporation<br />
DAVID H. HOAG<br />
Former Chairman and Chief Executive OÇcer<br />
The LTV Corporation<br />
WARREN B. RUDMAN<br />
Partner<br />
Paul, Weiss, Rifkind, Wharton & Garrison<br />
SIR DAVID G. SCHOLEY, CBE<br />
Senior Advisor<br />
UBS Warburg<br />
RAYMOND G.H. SEITZ<br />
Vice Chairman<br />
Lehman Bros. International (Europe)<br />
LAWRENCE M. SMALL<br />
Secretary<br />
Smithsonian Institution<br />
KAREN HASTIE WILLIAMS<br />
Partner<br />
Crowell & Moring LLP<br />
JAMES M. ZIMMERMAN<br />
Chairman and Chief Executive OÇcer<br />
Federated Department Stores, Inc.<br />
ALFRED W. ZOLLAR<br />
General Manager<br />
Lotus S<strong>of</strong>tware<br />
IBM S<strong>of</strong>tware <strong>Group</strong><br />
DR. KLAUS J. MANGOLD<br />
President and Chief Executive OÇcer<br />
DaimlerChrysler Services (debis) AG<br />
All <strong>of</strong> the above directors are also directors <strong>of</strong> Federal <strong>Insurance</strong> Company. Certain are also<br />
directors <strong>of</strong> other subsidiaries <strong>of</strong> the Corporation.<br />
OÇcers Chairman and Chief Executive OÇcer Senior Vice President and General Counsel<br />
DEAN R. O'HARE<br />
JOANNE L. BOBER<br />
President<br />
JOHN J. DEGNAN<br />
Executive Vice Presidents<br />
WESTON M. HICKS<br />
THOMAS F. MOTAMED<br />
MICHAEL O'REILLY<br />
Senior Vice Presidents<br />
DANIEL J. CONWAY<br />
DAVID S. FOWLER<br />
BRANT W. FREE, JR.<br />
FREDERICK W. GAERTNER<br />
NED I. GERSTMAN<br />
MARK E. GREENBERG<br />
ANDREW A. MCELWEE, JR.<br />
GLENN A. MONTGOMERY<br />
MARJORIE D. RAINES<br />
HENRY B. SCHRAM<br />
Senior Vice President and Counsel<br />
MICHAEL J. O'NEILL, JR.<br />
Vice Presidents<br />
STEPHEN A. FULLER<br />
PAUL R. GEYER<br />
ROBERT A. MARZOCCHI<br />
THOMAS J. SWARTZ, III<br />
JOEL M. TEALER<br />
RICHARD V. WERNER<br />
ROBERT M. WITKOFF<br />
Vice President and Associate Counsel<br />
JOHN E. WISINGER<br />
Vice President and Secretary<br />
HENRY G. GULICK<br />
Vice President and Treasurer<br />
PHILIP J. SEMPIER<br />
76
Subsidiaries<br />
Property and Casualty <strong>Insurance</strong><br />
Federal <strong>Insurance</strong> Company<br />
Vigilant <strong>Insurance</strong> Company<br />
Great Northern <strong>Insurance</strong> Company<br />
Pacific Indemnity Company<br />
Northwestern Pacific Indemnity Company<br />
Texas Pacific Indemnity Company<br />
Executive Risk Indemnity Inc.<br />
Executive Risk Specialty <strong>Insurance</strong> Company<br />
Quadrant Indemnity Company<br />
<strong>Chubb</strong> Custom <strong>Insurance</strong> Company<br />
<strong>Chubb</strong> Indemnity <strong>Insurance</strong> Company<br />
<strong>Chubb</strong> <strong>Insurance</strong> Company <strong>of</strong> New Jersey<br />
<strong>Chubb</strong> National <strong>Insurance</strong> Company<br />
<strong>Chubb</strong> Atlantic Indemnity, Ltd.<br />
<strong>Chubb</strong> <strong>Insurance</strong> Company <strong>of</strong> Australia, Limited<br />
<strong>Chubb</strong> <strong>Insurance</strong> Company <strong>of</strong> Canada<br />
<strong>Chubb</strong> <strong>Insurance</strong> Company <strong>of</strong> Europe, S.A.<br />
<strong>Chubb</strong> Argentina de Seguros, S.A.<br />
<strong>Chubb</strong> do Brasil Companhia de Seguros<br />
<strong>Chubb</strong> de Colombia Compañía de Seguros S.A.<br />
<strong>Chubb</strong> de Chile Compañía de Seguros Generales S.A.<br />
<strong>Chubb</strong> de Mexico, Compania Afianzadora, S.A. de S.V.<br />
<strong>Chubb</strong> de Mexico, Compania de Seguros, S.A. de S.V.<br />
<strong>Chubb</strong> de Venezuela Compania de Seguros C.A.<br />
PT Asuransi <strong>Chubb</strong> Indonesia<br />
Affiliates<br />
Allied World Assurance Company, Ltd.<br />
Bhakdikij Company Ltd.<br />
<strong>Chubb</strong> <strong>Insurance</strong> Company (Thailand), Limited<br />
Hiscox Plc<br />
Dividend Agent, Transfer Agent and Registrar<br />
EquiServe Trust Company, N.A.<br />
P.O. Box 2500<br />
Jersey City, NJ 07303-2500<br />
Telephone 800-317-4445<br />
Company Code 1816<br />
www.EquiServe.com<br />
Stock Listing<br />
The common stock <strong>of</strong> the Corporation<br />
is traded on the New York Stock Exchange<br />
under the symbol CB.<br />
The <strong>Chubb</strong> Corporation<br />
15 Mountain View Road, P.O. Box 1615<br />
Warren, NJ 07061-1615<br />
Telephone (908) 903-2000<br />
www.chubb.com<br />
Property and Casualty <strong>Insurance</strong> Underwriting Managers<br />
<strong>Chubb</strong> & Son, a division <strong>of</strong> Federal <strong>Insurance</strong> Company<br />
<strong>Chubb</strong> Custom Market, Inc.<br />
<strong>Chubb</strong> Multinational Managers, Inc.<br />
Reinsurance<br />
Foundation Reinsurance (pcc) Limited<br />
Reinsurance Services<br />
<strong>Chubb</strong> Re, Inc.<br />
Consulting — Claims Administration — Services<br />
<strong>Chubb</strong> Services Corporation<br />
<strong>Insurance</strong> Agency<br />
Personal Lines <strong>Insurance</strong> Brokerage, Inc.<br />
<strong>Chubb</strong> <strong>Insurance</strong> Solutions Agency, Inc.<br />
Financial Services<br />
<strong>Chubb</strong> Financial Solutions, Inc.<br />
Financing<br />
<strong>Chubb</strong> Capital Corporation<br />
Registered Investment Adviser<br />
<strong>Chubb</strong> Asset Managers, Inc.<br />
Real Estate<br />
Bellemead Development Corporation<br />
Computer Training And Staffing<br />
<strong>Chubb</strong> Computer Services, Inc.<br />
The <strong>Chubb</strong> Institute, Inc.<br />
Photography Greg Leshe, pages 1, 18-19; courtesy <strong>of</strong> C-SPAN, page 2; Allan H. Shoemake, pages 10 -15, 17;<br />
Rob Gale, Corbis/SABA, page 16; Ka Tai Leong, Corbis/SABA, page 19.
THE CHUBB CORPORATION<br />
15 Mountain View Road, P.O. Box 1615<br />
Warren, New Jersey 07061-1615<br />
Telephone: (908) 903-2000<br />
www.chubb.com