Annual Report 2001 - Chubb Group of Insurance Companies
Annual Report 2001 - Chubb Group of Insurance Companies
Annual Report 2001 - Chubb Group of Insurance Companies

You also want an ePaper? Increase the reach of your titles
YUMPU automatically turns print PDFs into web optimized ePapers that Google loves.
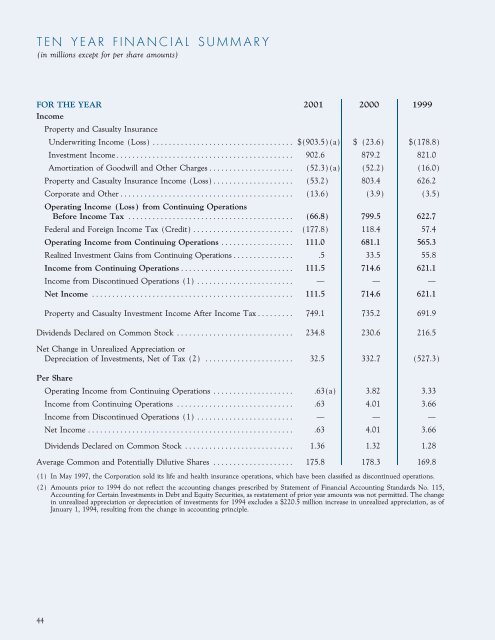
TEN YEAR FINANCIAL SUMMARY<br />
(in millions except for per share amounts)<br />
FOR THE YEAR <strong>2001</strong> 2000 1999<br />
Income<br />
Property and Casualty <strong>Insurance</strong><br />
Underwriting Income (Loss) ÏÏÏÏÏÏÏÏÏÏÏÏÏÏÏÏÏÏÏÏÏÏÏÏÏÏÏÏÏÏÏÏÏÏÏ $(903.5)(a) $ (23.6) $(178.8)<br />
Investment IncomeÏÏÏÏÏÏÏÏÏÏÏÏÏÏÏÏÏÏÏÏÏÏÏÏÏÏÏÏÏÏÏÏÏÏÏÏÏÏÏÏÏÏÏÏ 902.6 879.2 821.0<br />
Amortization <strong>of</strong> Goodwill and Other ChargesÏÏÏÏÏÏÏÏÏÏÏÏÏÏÏÏÏÏÏÏÏ (52.3)(a) (52.2) (16.0)<br />
Property and Casualty <strong>Insurance</strong> Income (Loss)ÏÏÏÏÏÏÏÏÏÏÏÏÏÏÏÏÏÏÏÏ (53.2) 803.4 626.2<br />
Corporate and OtherÏÏÏÏÏÏÏÏÏÏÏÏÏÏÏÏÏÏÏÏÏÏÏÏÏÏÏÏÏÏÏÏÏÏÏÏÏÏÏÏÏÏÏ (13.6) (3.9) (3.5)<br />
Operating Income (Loss) from Continuing Operations<br />
Before Income Tax ÏÏÏÏÏÏÏÏÏÏÏÏÏÏÏÏÏÏÏÏÏÏÏÏÏÏÏÏÏÏÏÏÏÏÏÏÏÏÏÏÏ (66.8) 799.5 622.7<br />
Federal and Foreign Income Tax (Credit)ÏÏÏÏÏÏÏÏÏÏÏÏÏÏÏÏÏÏÏÏÏÏÏÏÏ (177.8) 118.4 57.4<br />
Operating Income from Continuing Operations ÏÏÏÏÏÏÏÏÏÏÏÏÏÏÏÏÏÏ 111.0 681.1 565.3<br />
Realized Investment Gains from Continuing OperationsÏÏÏÏÏÏÏÏÏÏÏÏÏÏÏ .5 33.5 55.8<br />
Income from Continuing Operations ÏÏÏÏÏÏÏÏÏÏÏÏÏÏÏÏÏÏÏÏÏÏÏÏÏÏÏÏ 111.5 714.6 621.1<br />
Income from Discontinued Operations (1) ÏÏÏÏÏÏÏÏÏÏÏÏÏÏÏÏÏÏÏÏÏÏÏÏ Ì Ì Ì<br />
Net Income ÏÏÏÏÏÏÏÏÏÏÏÏÏÏÏÏÏÏÏÏÏÏÏÏÏÏÏÏÏÏÏÏÏÏÏÏÏÏÏÏÏÏÏÏÏÏÏÏÏÏ 111.5 714.6 621.1<br />
Property and Casualty Investment Income After Income TaxÏÏÏÏÏÏÏÏÏ 749.1 735.2 691.9<br />
Dividends Declared on Common Stock ÏÏÏÏÏÏÏÏÏÏÏÏÏÏÏÏÏÏÏÏÏÏÏÏÏÏÏÏÏ 234.8 230.6 216.5<br />
Net Change in Unrealized Appreciation or<br />
Depreciation <strong>of</strong> Investments, Net <strong>of</strong> Tax (2) ÏÏÏÏÏÏÏÏÏÏÏÏÏÏÏÏÏÏÏÏÏÏ 32.5 332.7 (527.3)<br />
Per Share<br />
Operating Income from Continuing Operations ÏÏÏÏÏÏÏÏÏÏÏÏÏÏÏÏÏÏÏÏ .63(a) 3.82 3.33<br />
Income from Continuing Operations ÏÏÏÏÏÏÏÏÏÏÏÏÏÏÏÏÏÏÏÏÏÏÏÏÏÏÏÏÏ .63 4.01 3.66<br />
Income from Discontinued Operations (1) ÏÏÏÏÏÏÏÏÏÏÏÏÏÏÏÏÏÏÏÏÏÏÏÏ Ì Ì Ì<br />
Net Income ÏÏÏÏÏÏÏÏÏÏÏÏÏÏÏÏÏÏÏÏÏÏÏÏÏÏÏÏÏÏÏÏÏÏÏÏÏÏÏÏÏÏÏÏÏÏÏÏÏÏÏ .63 4.01 3.66<br />
Dividends Declared on Common Stock ÏÏÏÏÏÏÏÏÏÏÏÏÏÏÏÏÏÏÏÏÏÏÏÏÏÏÏ 1.36 1.32 1.28<br />
Average Common and Potentially Dilutive Shares ÏÏÏÏÏÏÏÏÏÏÏÏÏÏÏÏÏÏÏÏ 175.8 178.3 169.8<br />
(1) In May 1997, the Corporation sold its life and health insurance operations, which have been classiÑed as discontinued operations.<br />
(2) Amounts prior to 1994 do not reÖect the accounting changes prescribed by Statement <strong>of</strong> Financial Accounting Standards No. 115,<br />
Accounting for Certain Investments in Debt and Equity Securities, as restatement <strong>of</strong> prior year amounts was not permitted. The change<br />
in unrealized appreciation or depreciation <strong>of</strong> investments for 1994 excludes a $220.5 million increase in unrealized appreciation, as <strong>of</strong><br />
January 1, 1994, resulting from the change in accounting principle.<br />
44